Information
LHCb-PAPER-2020-026
CERN-EP-2020-185
arXiv:2010.15931 [PDF]
(Submitted on 29 Oct 2020)
Eur. Phys. J. C81 (2021) 601
Inspire 1827313
Tools
Abstract
A structure is observed in the $B^+K^-$ mass spectrum in a sample of proton--proton collisions at centre-of-mass energies of 7, 8, and 13 TeV, collected with the LHCb detector and corresponding to a total integrated luminosity of 9 fb${}^-1$. The structure is interpreted as the result of overlapping excited $B_s^0$ states. With high significance, a two-peak hypothesis provides a better description of the data than a single resonance. Under this hypothesis the masses and widths of the two states, assuming they decay directly to $B^+K^-$, are determined to be $m_1 = 6063.5 \pm 1.2 \text{ (stat)} \pm 0.8\text{ (syst) MeV},$ $\Gamma_1 = 26 \pm 4 \text{ (stat)} \pm 4\text{ (syst) MeV},$ $m_2 = 6114 \pm 3 \text{ (stat)} \pm 5\text{ (syst) MeV},$ $\Gamma_2 = 66 \pm 18 \text{ (stat)} \pm 21\text{ (syst) MeV}.$ Alternative values assuming a decay through $B^{*+}K^-$, with a missing photon from the $B^{*+} \rightarrow B^+\gamma$ decay, which are shifted by approximately 45 MeV are also determined. The possibility of a single state decaying in both channels is also considered. The ratio of the total production cross-section times branching fraction of the new states relative to the previously observed $B_{s2}^{*0}$ state is determined to be $0.87 \pm 0.15 \text{ (stat)} \pm 0.19 \text{ (syst)}$.
Figures and captions
|
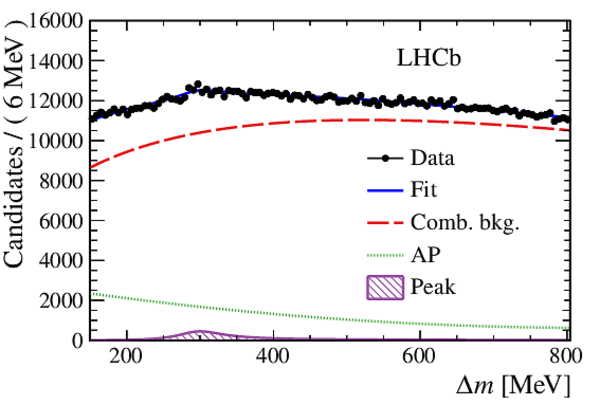
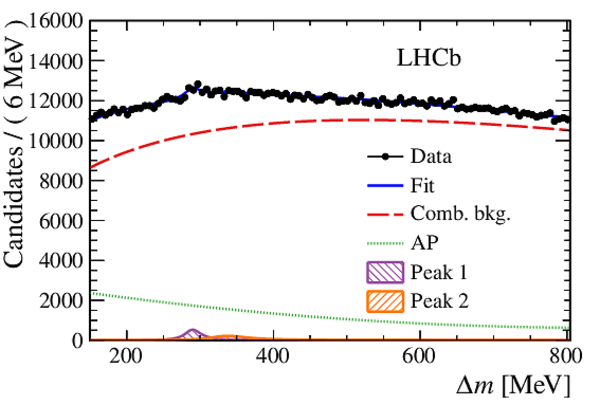
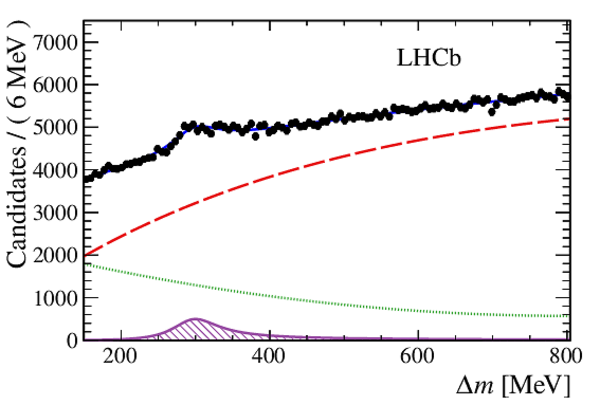
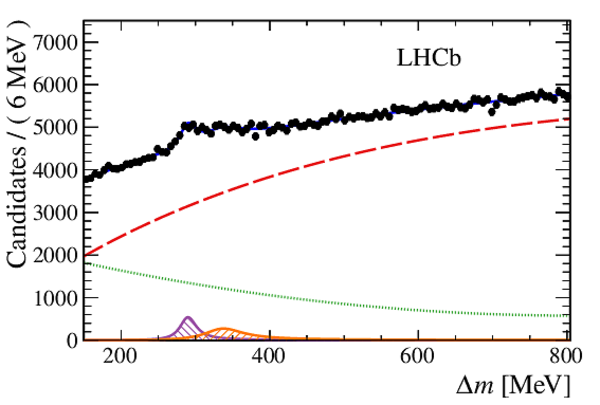
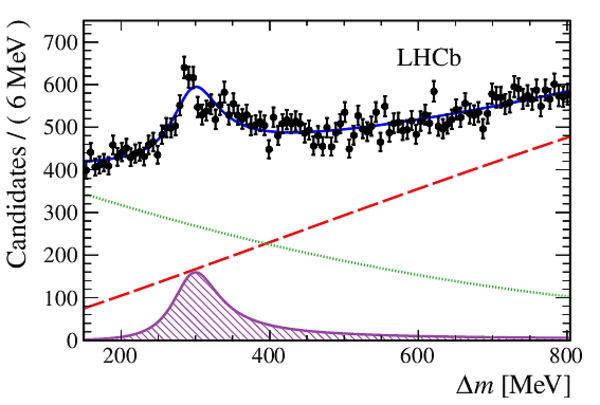
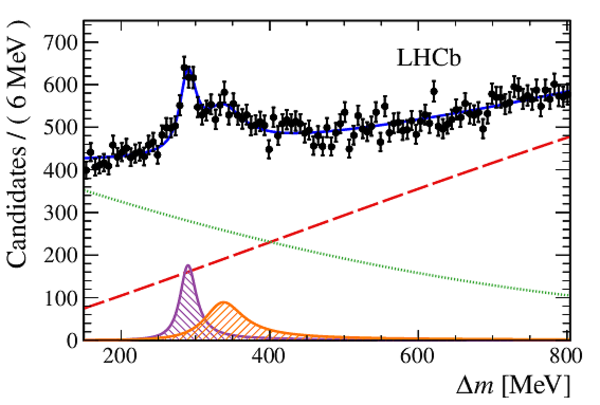
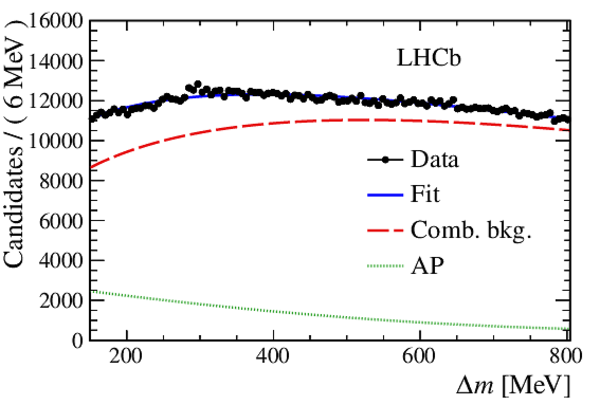
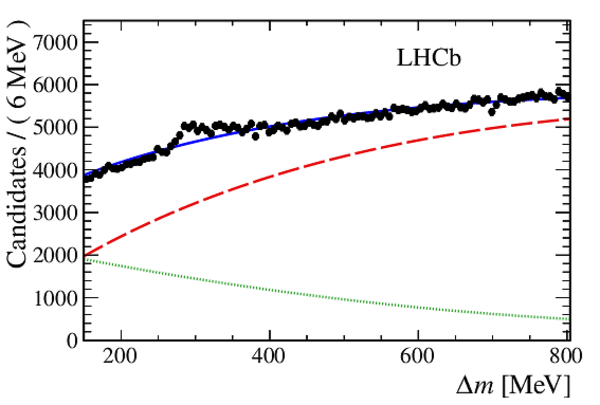
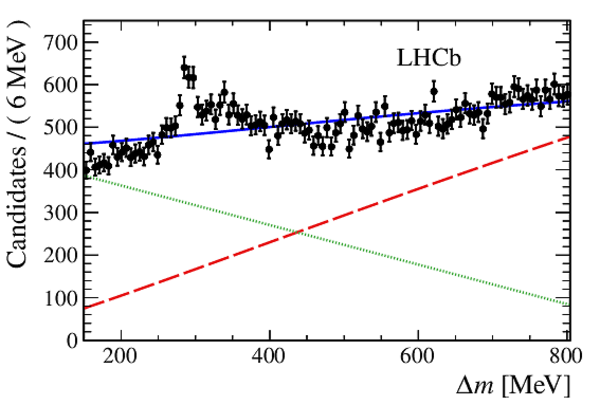
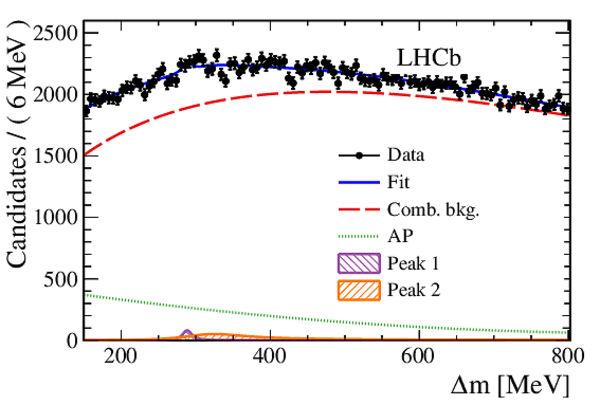
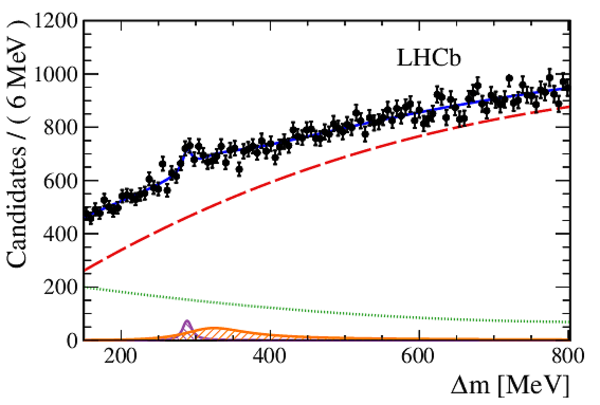
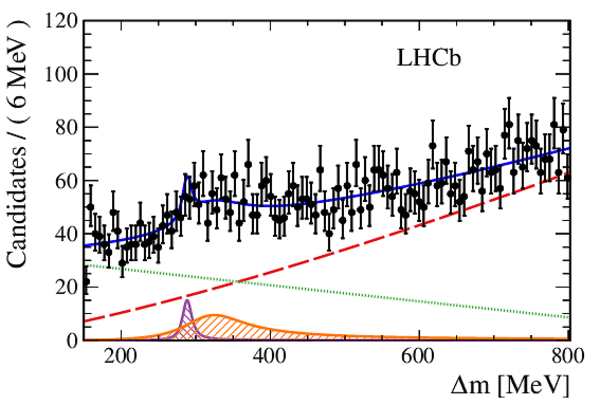
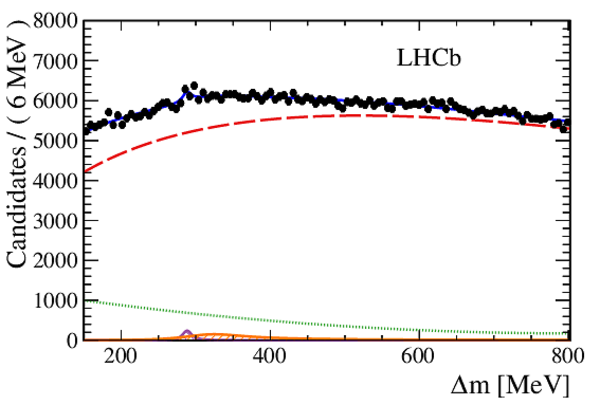
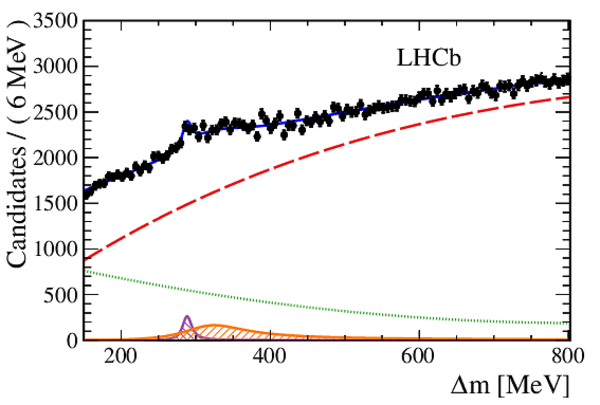
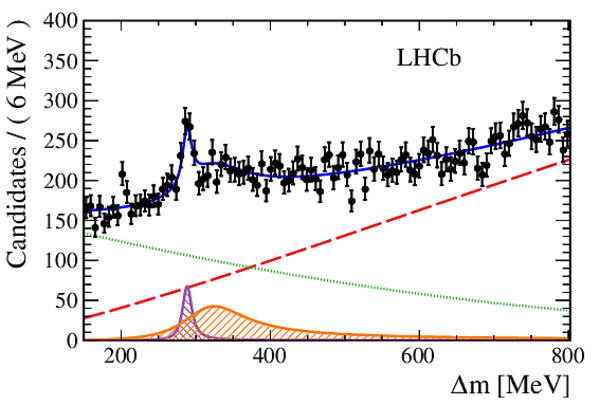
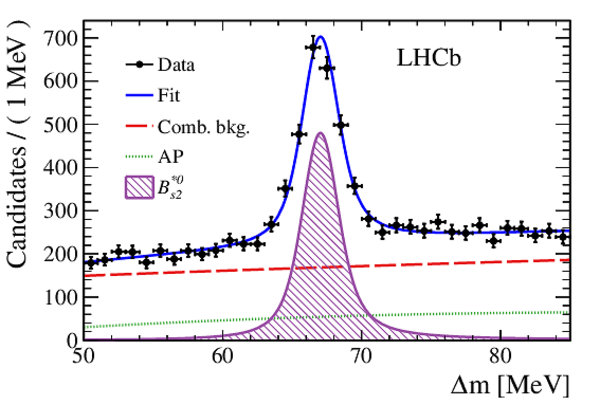
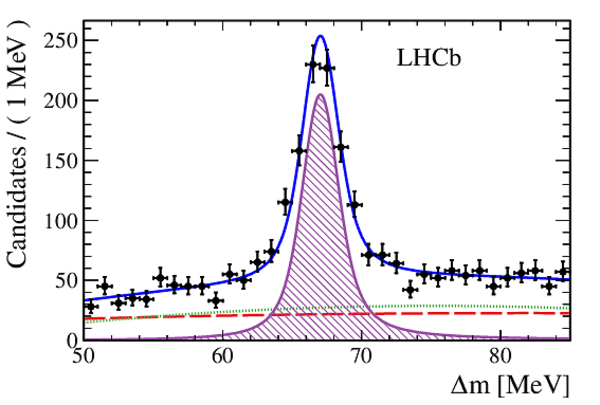
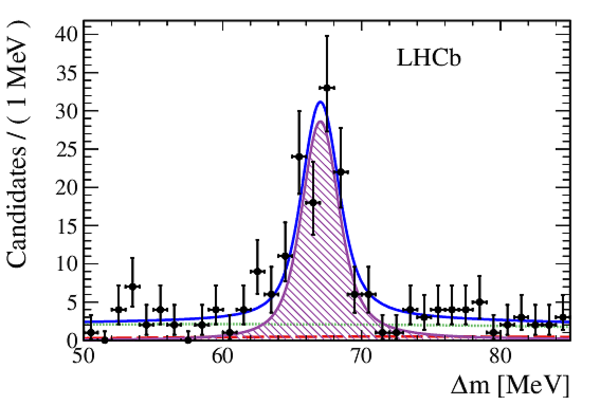
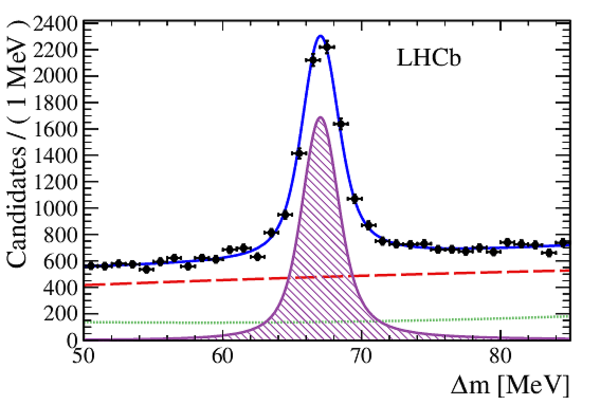
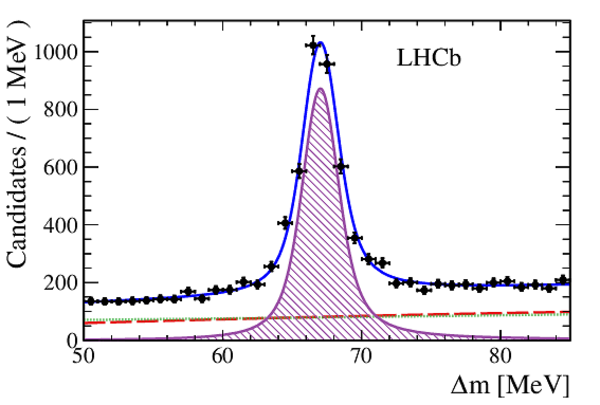
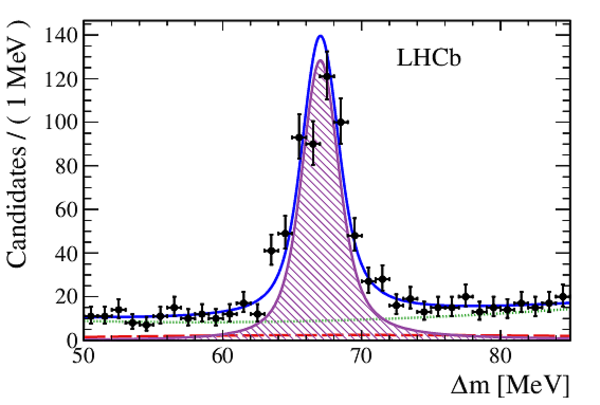
The $ B ^+$ $ K ^-$ mass difference distributions in data, overlaid with the fit models: (left column) one-peak hypothesis and (right column) two-peak hypothesis. In each column, the rows are from top to bottom for candidates with the prompt kaon $ p_{\mathrm{T}}$ : $0.5 < p_{\mathrm{T}} < \SI{1}{\giga\evolt}$, $1 < p_{\mathrm{T}} < \SI{2}{\giga\evolt}$, and $ p_{\mathrm{T}} > \SI{2}{\giga\evolt}$. The legend in the top row applies for each column. The associated production (AP) background is described by a second-degree polynomial in each fit. The combinatorial background shape is fixed from a fit to the $ B ^+$ $ K ^+$ mass difference distributions. |
Fig1a.pdf [38 KiB] HiDef png [256 KiB] Thumbnail [193 KiB] *.C file |
|
|
Fig1d.pdf [40 KiB] HiDef png [260 KiB] Thumbnail [197 KiB] *.C file |
|
|
|
Fig1b.pdf [38 KiB] HiDef png [243 KiB] Thumbnail [178 KiB] *.C file |
|
|
|
Fig1e.pdf [40 KiB] HiDef png [233 KiB] Thumbnail [175 KiB] *.C file |
|
|
|
Fig1c.pdf [38 KiB] HiDef png [347 KiB] Thumbnail [248 KiB] *.C file |
|
|
|
Fig1f.pdf [40 KiB] HiDef png [329 KiB] Thumbnail [237 KiB] *.C file |
|
|
|
Animated gif made out of all figures. |
PAPER-2020-026.gif Thumbnail |

|
Tables and captions
|
Sources of systematic uncertainty on the peak parameters assuming a two-peak structure decaying either directly to $ B ^+ K ^- $ or through $B^{*+} K ^- $. The parameter differences with respect to the nominal fit result are given in $\text{ Me V}$ . |
Table_1.pdf [57 KiB] HiDef png [71 KiB] Thumbnail [32 KiB] tex code |

|
|
Summary of the systematic uncertainties on the production ratio. The effect of the unknown $ p_{\mathrm{T}}$ distribution is separated from other uncertainties affecting the relative efficiency. |
Table_2.pdf [62 KiB] HiDef png [66 KiB] Thumbnail [29 KiB] tex code |

|
Supplementary Material [file]
![HiDef png [256 KiB]](Directory_LHCb-PAPER-2020-026/hidef_Fig1a.png)
![HiDef png [260 KiB]](Directory_LHCb-PAPER-2020-026/hidef_Fig1d.png)
![HiDef png [243 KiB]](Directory_LHCb-PAPER-2020-026/hidef_Fig1b.png)
![HiDef png [233 KiB]](Directory_LHCb-PAPER-2020-026/hidef_Fig1e.png)
![HiDef png [347 KiB]](Directory_LHCb-PAPER-2020-026/hidef_Fig1c.png)
![HiDef png [329 KiB]](Directory_LHCb-PAPER-2020-026/hidef_Fig1f.png)
![HiDef png [71 KiB]](Directory_LHCb-PAPER-2020-026/hidef_Table_1.png)
![HiDef png [66 KiB]](Directory_LHCb-PAPER-2020-026/hidef_Table_2.png)
![HiDef png [222 KiB]](Directory_LHCb-PAPER-2020-026/supplementary/hidef_Fig1a-S.png)
![HiDef png [208 KiB]](Directory_LHCb-PAPER-2020-026/supplementary/hidef_Fig1b-S.png)
![HiDef png [255 KiB]](Directory_LHCb-PAPER-2020-026/supplementary/hidef_Fig1c-S.png)
![HiDef png [277 KiB]](Directory_LHCb-PAPER-2020-026/supplementary/hidef_Fig2a-S.png)
![HiDef png [273 KiB]](Directory_LHCb-PAPER-2020-026/supplementary/hidef_Fig2b-S.png)
![HiDef png [318 KiB]](Directory_LHCb-PAPER-2020-026/supplementary/hidef_Fig2c-S.png)
![HiDef png [227 KiB]](Directory_LHCb-PAPER-2020-026/supplementary/hidef_Fig2d-S.png)
![HiDef png [261 KiB]](Directory_LHCb-PAPER-2020-026/supplementary/hidef_Fig2e-S.png)
![HiDef png [335 KiB]](Directory_LHCb-PAPER-2020-026/supplementary/hidef_Fig2f-S.png)
![HiDef png [407 KiB]](Directory_LHCb-PAPER-2020-026/supplementary/hidef_Fig3a-S.png)
![HiDef png [393 KiB]](Directory_LHCb-PAPER-2020-026/supplementary/hidef_Fig3b-S.png)
![HiDef png [362 KiB]](Directory_LHCb-PAPER-2020-026/supplementary/hidef_Fig3c-S.png)
![HiDef png [407 KiB]](Directory_LHCb-PAPER-2020-026/supplementary/hidef_Fig3d-S.png)
![HiDef png [389 KiB]](Directory_LHCb-PAPER-2020-026/supplementary/hidef_Fig3e-S.png)
![HiDef png [413 KiB]](Directory_LHCb-PAPER-2020-026/supplementary/hidef_Fig3f-S.png)
Created on 19 April 2024.