Measurement of the relative branching fractions of $B^+ \to h^+h^{\prime +}h^{\prime -}$ decays
[to restricted-access page]Information
LHCb-PAPER-2020-031
CERN-EP-2020-189
arXiv:2010.11802 [PDF]
(Submitted on 22 Oct 2020)
Phys. Rev. D102 (2020) 112010
Inspire 1824493
Tools
Abstract
The relative branching fractions of $B^+ \to h^+h^{\prime +}h^{\prime -}$ decays, where $h^{(\prime)}$ is a pion or kaon, are measured. The analysis is performed with a data sample, collected with the LHCb detector, corresponding to an integrated luminosity of $3.0 {\rm fb}^{-1}$ of $pp$ collisions. The results obtained improve significantly on previous measurements of these quantities, and are important for the interpretation of Dalitz plot analyses of three-body charmless hadronic decays of $B^+$ mesons.
Figures and captions
|
Example Feynman diagrams that contribute to $ B ^+ \rightarrow h^+h^{\prime +}h^{\prime -}$ decays. (Top row) tree-level processes with external $W$ emission coupling to (left) pion and (right) kaon; (second row) (left) $\bar{b} \rightarrow \bar{s}$ and (right) $\bar{b} \rightarrow \bar{d}$ loop-level processes with $u\bar{u}$ production; (following rows) same, but with (third row) $d\bar{d}$ and (bottom row) $s\bar{s}$ production. Where final-state particles other than $\pi ^+ $ and $ K ^+ $ are given, it should be understood that a range of resonances are possible, and where these are unflavoured in many cases decays to both $\pi ^+ \pi ^- $ and $ K ^+ K ^- $ are possible. Other types of Feynman diagrams that can also contribute, such as internal $W$ emission and annihilation amplitudes as well as rescattering processes, are not shown. |
diagrams_3.pdf [46 KiB] HiDef png [21 KiB] Thumbnail [10 KiB] *.C file |

|
|
diagrams_5.pdf [46 KiB] HiDef png [21 KiB] Thumbnail [10 KiB] *.C file |

|
|
|
diagrams_6.pdf [48 KiB] HiDef png [26 KiB] Thumbnail [12 KiB] *.C file |

|
|
|
diagrams_4.pdf [48 KiB] HiDef png [25 KiB] Thumbnail [12 KiB] *.C file |

|
|
|
diagrams_7.pdf [55 KiB] HiDef png [23 KiB] Thumbnail [11 KiB] *.C file |

|
|
|
diagra[..].pdf [48 KiB] HiDef png [26 KiB] Thumbnail [12 KiB] *.C file |

|
|
|
diagrams_2.pdf [48 KiB] HiDef png [27 KiB] Thumbnail [13 KiB] *.C file |

|
|
|
diagra[..].pdf [55 KiB] HiDef png [23 KiB] Thumbnail [11 KiB] *.C file |

|
|
|
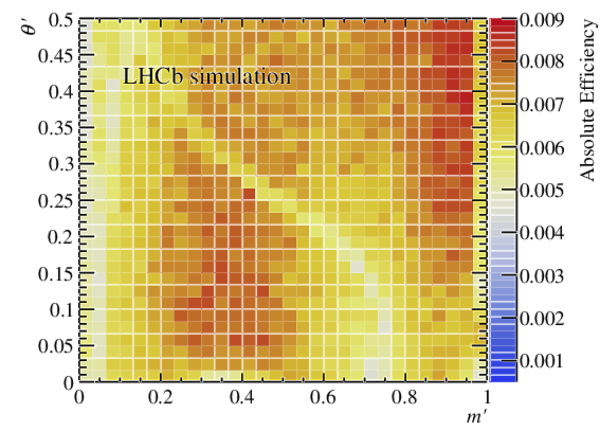
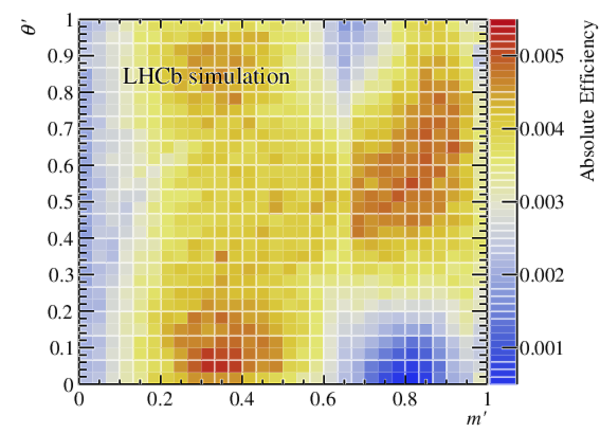
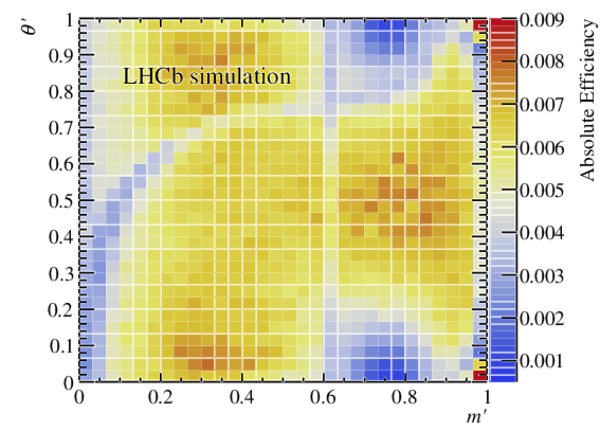
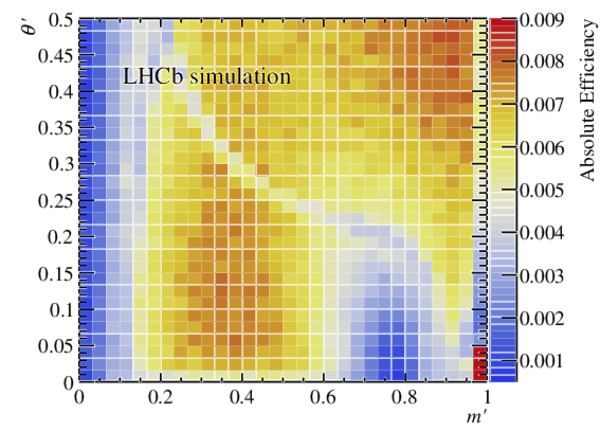
Total efficiency, $\epsilon^{\rm tot}$, as a function of SDP position for (top left) $ B ^+ \rightarrow K ^+ K ^+ K ^- $ , (top right) $ B ^+ \rightarrow \pi ^+ K ^+ K ^- $ , (bottom left) $ B ^+ \rightarrow K ^+ \pi ^+ \pi ^- $ , and (bottom right) $ B ^+ \rightarrow \pi ^+ \pi ^+ \pi ^- $ . |
htot_B[..].pdf [20 KiB] HiDef png [437 KiB] Thumbnail [352 KiB] *.C file |
|
|
htot_B[..].pdf [20 KiB] HiDef png [394 KiB] Thumbnail [324 KiB] *.C file |
|
|
|
htot_B[..].pdf [20 KiB] HiDef png [428 KiB] Thumbnail [346 KiB] *.C file |
|
|
|
htot_B[..].pdf [20 KiB] HiDef png [439 KiB] Thumbnail [355 KiB] *.C file |
|
|
|
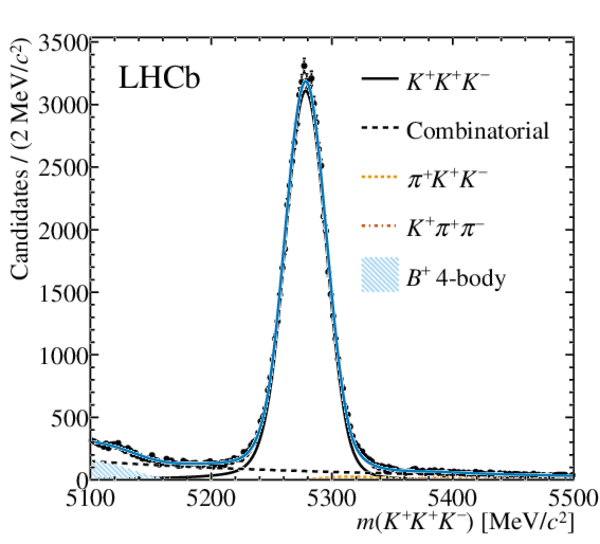
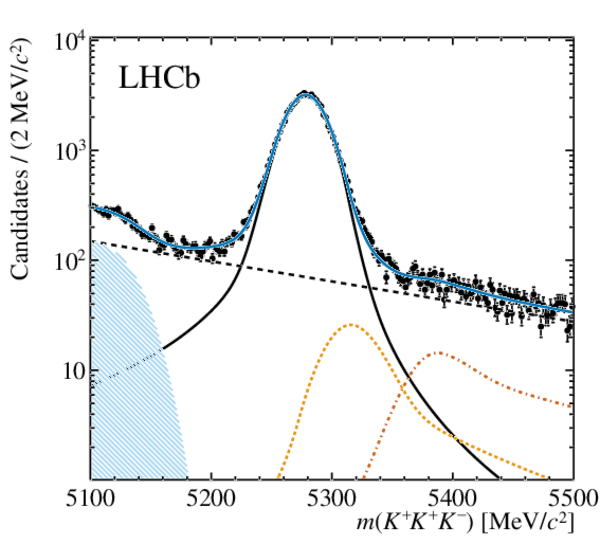
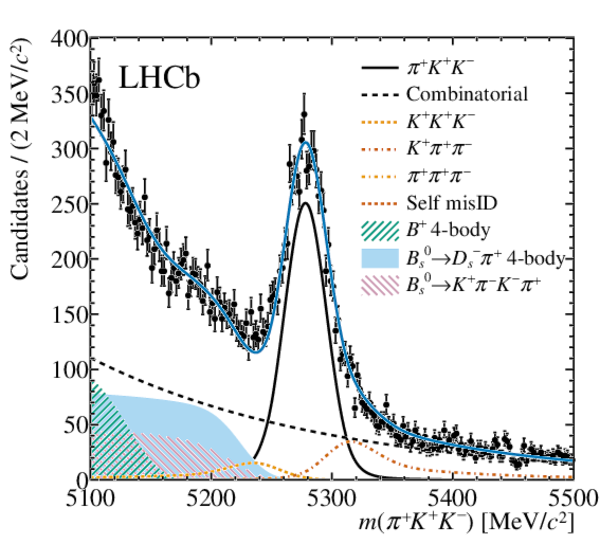
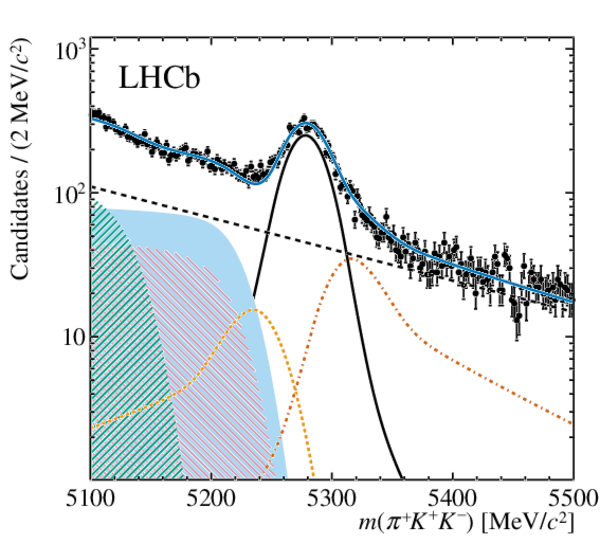
Invariant-mass distributions of the (top) $ B ^+ \rightarrow K ^+ K ^+ K ^- $ and (bottom) $ B ^+ \rightarrow \pi ^+ K ^+ K ^- $ candidates compared to the results of the simultaneous fit with (left) linear and (right) logarithmic $y$-axis scales. |
kkk.pdf [41 KiB] HiDef png [462 KiB] Thumbnail [282 KiB] *.C file |
|
|
kkk_log.pdf [39 KiB] HiDef png [738 KiB] Thumbnail [370 KiB] *.C file |
|
|
|
kpik.pdf [44 KiB] HiDef png [738 KiB] Thumbnail [440 KiB] *.C file |
|
|
|
kpik_log.pdf [39 KiB] HiDef png [1 MiB] Thumbnail [547 KiB] *.C file |
|
|
|
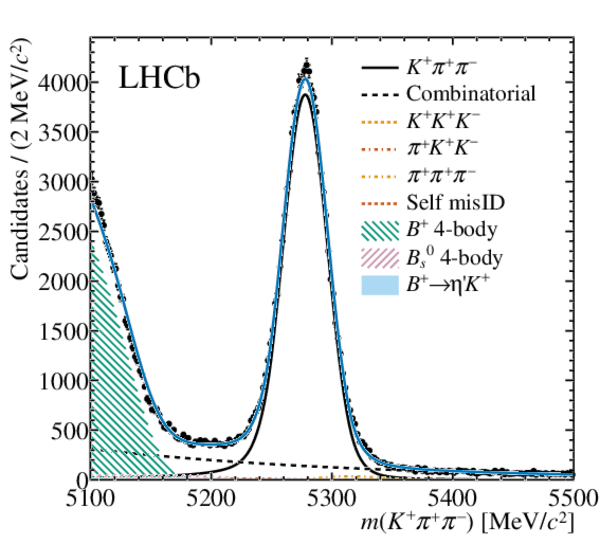
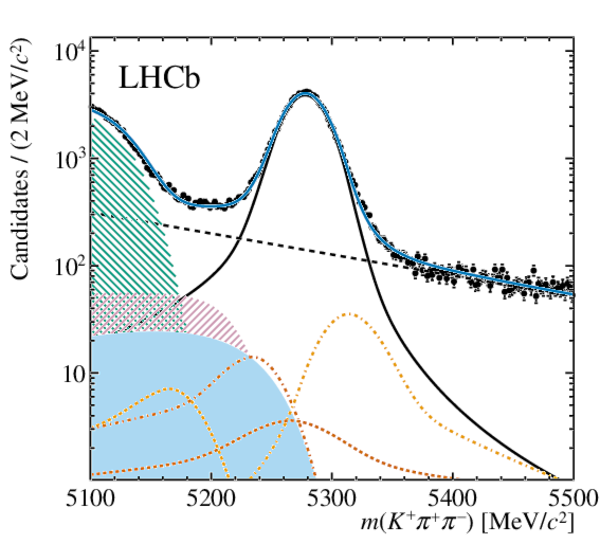
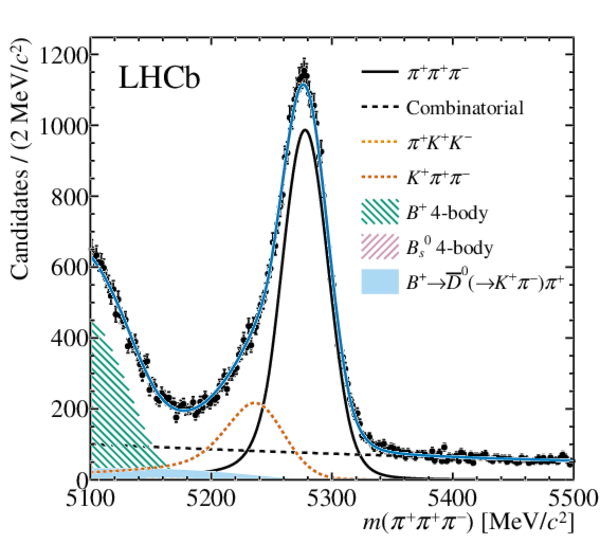
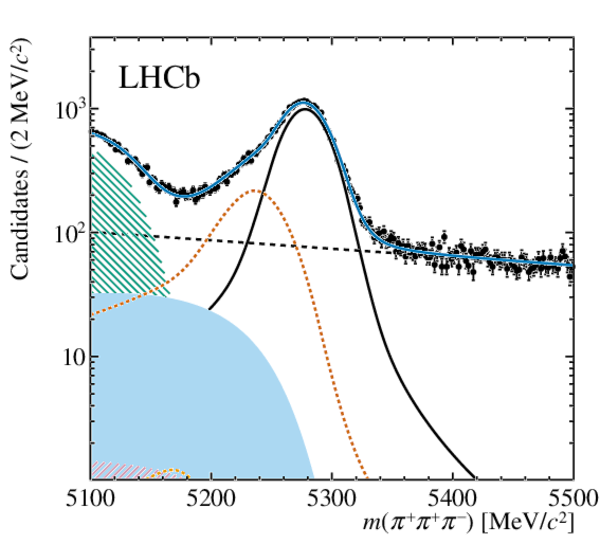
Invariant-mass distributions of the (top) $ B ^+ \rightarrow K ^+ \pi ^+ \pi ^- $ and (bottom) $ B ^+ \rightarrow \pi ^+ \pi ^+ \pi ^- $ candidates compared to the results of the simultaneous fit with (left) linear and (right) logarithmic $y$-axis scales. |
kpipi.pdf [45 KiB] HiDef png [647 KiB] Thumbnail [391 KiB] *.C file |
|
|
kpipi_log.pdf [42 KiB] HiDef png [685 KiB] Thumbnail [395 KiB] *.C file |
|
|
|
pipipi.pdf [42 KiB] HiDef png [606 KiB] Thumbnail [366 KiB] *.C file |
|
|
|
pipipi_log.pdf [39 KiB] HiDef png [496 KiB] Thumbnail [300 KiB] *.C file |
|
|
|
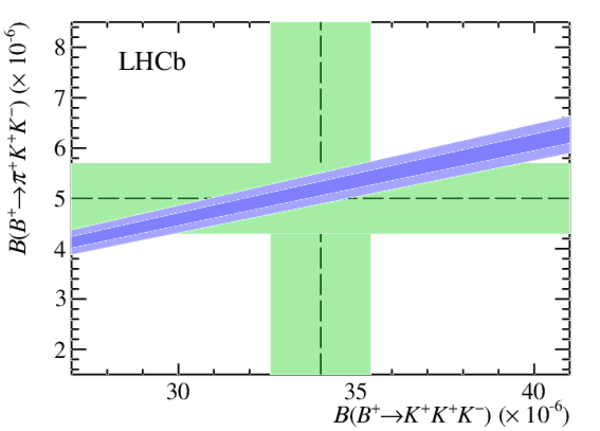
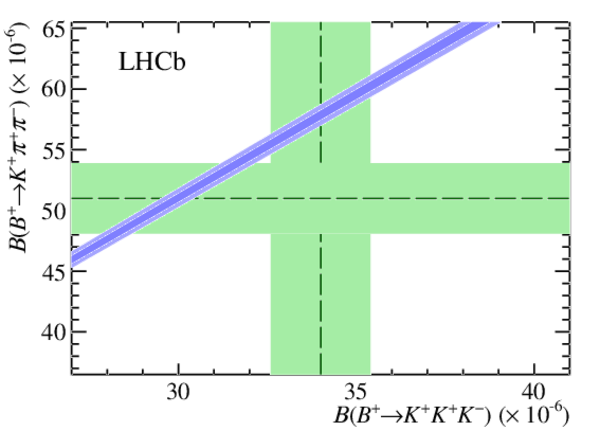
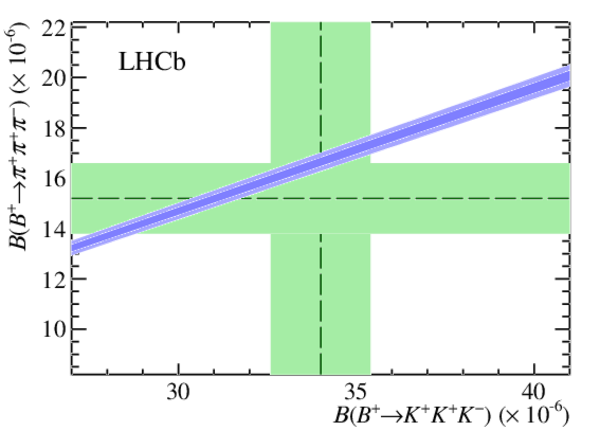
Comparisons of the measured branching fraction ratios, with $\mathcal{B} ( B ^+ \rightarrow K ^+ K ^+ K ^- )$ as denominator, with the current world averages \cite{PDG2020}. Light (dark) bands associated with the branching fraction ratio correspond to the $\pm1\sigma$ total (statistical) uncertainty intervals. For horizontal and vertical bands taken from the PDG only the total uncertainty is shown. |
kpik_k[..].pdf [15 KiB] HiDef png [195 KiB] Thumbnail [141 KiB] *.C file |
|
|
kpipi_[..].pdf [15 KiB] HiDef png [204 KiB] Thumbnail [146 KiB] *.C file |
|
|
|
pipipi[..].pdf [15 KiB] HiDef png [203 KiB] Thumbnail [145 KiB] *.C file |
|
|
|
Animated gif made out of all figures. |
PAPER-2020-031.gif Thumbnail |

|
![HiDef png [21 KiB]](Directory_LHCb-PAPER-2020-031/hidef_diagrams_3.png)
![HiDef png [21 KiB]](Directory_LHCb-PAPER-2020-031/hidef_diagrams_5.png)
![HiDef png [26 KiB]](Directory_LHCb-PAPER-2020-031/hidef_diagrams_6.png)
![HiDef png [25 KiB]](Directory_LHCb-PAPER-2020-031/hidef_diagrams_4.png)
![HiDef png [23 KiB]](Directory_LHCb-PAPER-2020-031/hidef_diagrams_7.png)
![HiDef png [26 KiB]](Directory_LHCb-PAPER-2020-031/hidef_diagrams_11.png)
![HiDef png [27 KiB]](Directory_LHCb-PAPER-2020-031/hidef_diagrams_2.png)
![HiDef png [23 KiB]](Directory_LHCb-PAPER-2020-031/hidef_diagrams_12.png)
![HiDef png [437 KiB]](Directory_LHCb-PAPER-2020-031/hidef_htot_Bu2KKK_Run1.png)
![HiDef png [394 KiB]](Directory_LHCb-PAPER-2020-031/hidef_htot_Bu2KpiK_Run1.png)
![HiDef png [428 KiB]](Directory_LHCb-PAPER-2020-031/hidef_htot_Bu2Kpipi_Run1.png)
![HiDef png [439 KiB]](Directory_LHCb-PAPER-2020-031/hidef_htot_Bu2pipipi_Run1.png)
![HiDef png [462 KiB]](Directory_LHCb-PAPER-2020-031/hidef_kkk.png)
![HiDef png [738 KiB]](Directory_LHCb-PAPER-2020-031/hidef_kkk_log.png)
![HiDef png [738 KiB]](Directory_LHCb-PAPER-2020-031/hidef_kpik.png)
![HiDef png [1 MiB]](Directory_LHCb-PAPER-2020-031/hidef_kpik_log.png)
![HiDef png [647 KiB]](Directory_LHCb-PAPER-2020-031/hidef_kpipi.png)
![HiDef png [685 KiB]](Directory_LHCb-PAPER-2020-031/hidef_kpipi_log.png)
![HiDef png [606 KiB]](Directory_LHCb-PAPER-2020-031/hidef_pipipi.png)
![HiDef png [496 KiB]](Directory_LHCb-PAPER-2020-031/hidef_pipipi_log.png)
![HiDef png [195 KiB]](Directory_LHCb-PAPER-2020-031/hidef_kpik_kkk_boundaries_5s.png)
![HiDef png [204 KiB]](Directory_LHCb-PAPER-2020-031/hidef_kpipi_kkk_boundaries_5s.png)
![HiDef png [203 KiB]](Directory_LHCb-PAPER-2020-031/hidef_pipipi_kkk_boundaries_5s.png)
Tables and captions
|
Current knowledge of the branching fractions of $ B ^+ \rightarrow h^+h^{\prime +}h^{\prime -}$ decays \cite{PDG2020}. |
Table_1.pdf [69 KiB] HiDef png [44 KiB] Thumbnail [23 KiB] tex code |

|
|
Probability (%), due to the particle identification requirements, for each of the four signal modes to be correctly identified, or to form a cross-feed background to one of the other final states. Empty entries correspond to values below $0.05 \%$. The decays $ B ^+ \rightarrow \pi ^+ K ^+ K ^- $ and $ B ^+ \rightarrow K ^+ \pi ^+ \pi ^- $ can, through both $ K ^+ \rightarrow \pi ^+ $ and $\pi ^+ \rightarrow K ^+ $ misidentification, appear as a cross-feed background in the correct final state with probabilities of below $0.05 \%$ and $0.4 \%$, respectively. |
Table_2.pdf [60 KiB] HiDef png [38 KiB] Thumbnail [19 KiB] tex code |

|
|
Ordering of final-state particles used in definitions of the SDP variables. |
Table_3.pdf [56 KiB] HiDef png [47 KiB] Thumbnail [23 KiB] tex code |

|
|
Charm veto efficiencies as determined from samples of the four signal modes generated according to the most recent Dalitz-plot models. |
Table_4.pdf [59 KiB] HiDef png [81 KiB] Thumbnail [38 KiB] tex code |

|
|
Fitted signal yields and associated statistical uncertainties. |
Table_5.pdf [58 KiB] HiDef png [82 KiB] Thumbnail [37 KiB] tex code |

|
|
Absolute systematic uncertainties on the branching fraction ratios. All values are given multiplied by 100. Uncertainties are presented for all ratios of one mode to another, even though not all are independent. |
Table_6.pdf [94 KiB] HiDef png [77 KiB] Thumbnail [28 KiB] tex code |

|
|
Measured relative branching fractions of $ B ^+ \rightarrow h^+h^{\prime +}h^{\prime -}$ decays, where the first uncertainty is statistical and the second is systematic. Results are presented for all ratios of one mode to another, even though not all are independent. |
Table_7.pdf [59 KiB] HiDef png [150 KiB] Thumbnail [75 KiB] tex code |

|
|
Statistical correlations between the measured branching fraction ratios. |
Table_8.pdf [72 KiB] HiDef png [62 KiB] Thumbnail [30 KiB] tex code |

|
|
Systematic correlations between the measured branching fraction ratios. |
Table_9.pdf [72 KiB] HiDef png [63 KiB] Thumbnail [31 KiB] tex code |

|
![HiDef png [44 KiB]](Directory_LHCb-PAPER-2020-031/hidef_Table_1.png)
![HiDef png [38 KiB]](Directory_LHCb-PAPER-2020-031/hidef_Table_2.png)
![HiDef png [47 KiB]](Directory_LHCb-PAPER-2020-031/hidef_Table_3.png)
![HiDef png [81 KiB]](Directory_LHCb-PAPER-2020-031/hidef_Table_4.png)
![HiDef png [82 KiB]](Directory_LHCb-PAPER-2020-031/hidef_Table_5.png)
![HiDef png [77 KiB]](Directory_LHCb-PAPER-2020-031/hidef_Table_6.png)
![HiDef png [150 KiB]](Directory_LHCb-PAPER-2020-031/hidef_Table_7.png)
![HiDef png [62 KiB]](Directory_LHCb-PAPER-2020-031/hidef_Table_8.png)
![HiDef png [63 KiB]](Directory_LHCb-PAPER-2020-031/hidef_Table_9.png)
Created on 20 April 2024.