$J/\psi$ photoproduction in Pb-Pb peripheral collisions at $\sqrt {s_{NN}}$= 5 TeV
[to restricted-access page]Information
LHCb-PAPER-2020-043
CERN-EP-2021-122
arXiv:2108.02681 [PDF]
(Submitted on 05 Aug 2021)
Phys. Rev. C105 (2022) L032201
Inspire 1899799
Tools
Abstract
The photo-production of $J/\psi$ mesons at low transverse momentum is studied in peripheral lead-lead collisions collected by the LHCb experiment at a centre-of-mass energy per nucleon pair of 5 TeV, corresponding to an integrated luminosity of 210 $\rm{\mu b}^{-1}$. The $J/\psi$ candidates are reconstructed through the prompt decay into two muons of opposite charge in the rapidity region of $2.0<y<4.5$. The results significantly improve previous measurements and are compared to the latest theoretical prediction.
Figures and captions
|
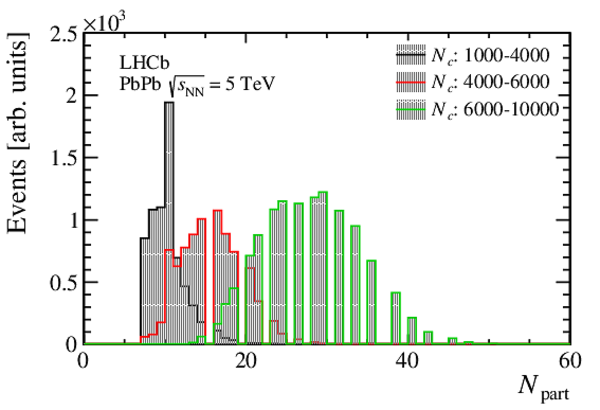
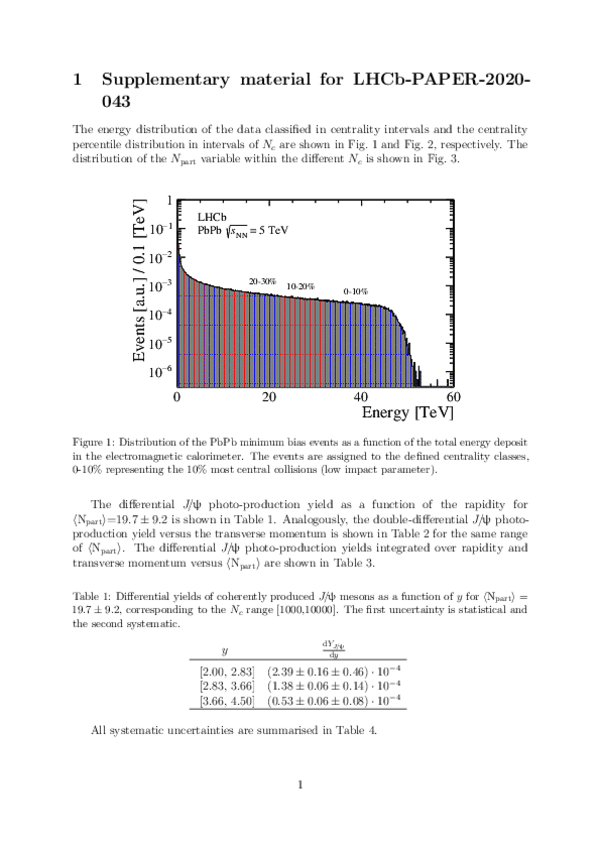
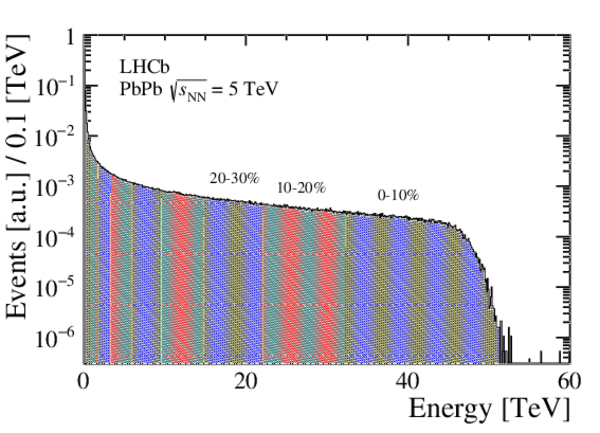
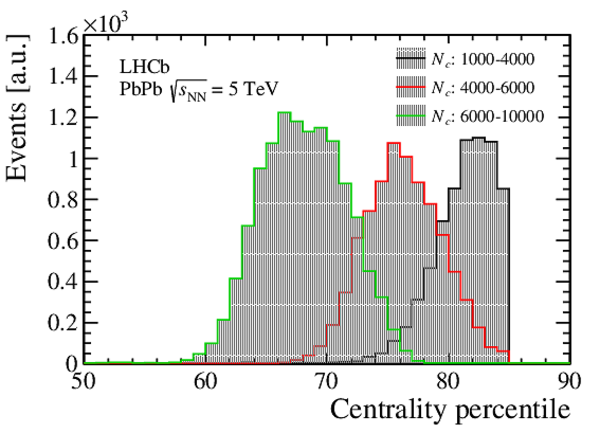
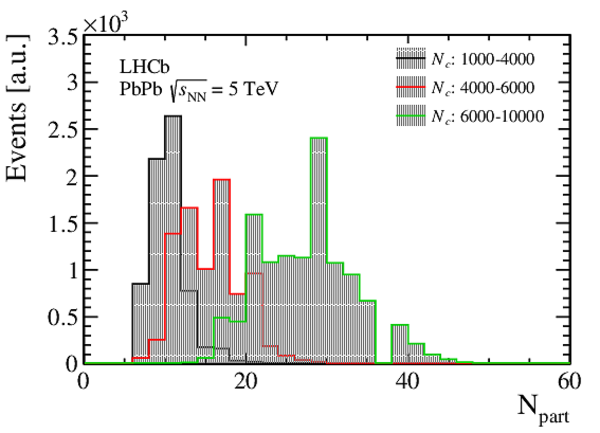
Distribution of $N_\textrm{part}$ in the three $N_c$ intervals of the minimum bias events defined in Table 1. |
Fig1.pdf [14 KiB] HiDef png [378 KiB] Thumbnail [160 KiB] *.C file |
|
|
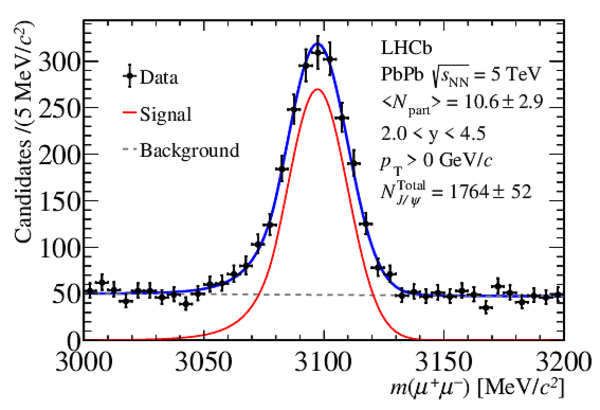
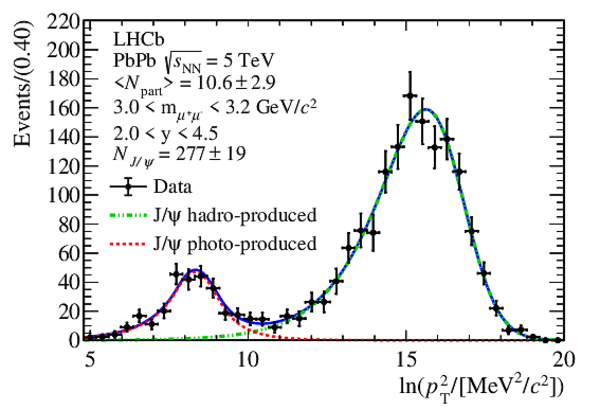
(Left) Invariant mass distribution of $ { J \mskip -3mu/\mskip -2mu\psi \mskip 2mu}$ candidates with $\langle \mathrm{N_{part}} \rangle=10.6\pm2.9$, for $ p_{\mathrm{T}} <15.0\text{ Ge V /}c $ and $2.0<y <4.5$. (Right) Distribution of $\ln( p_{\mathrm{T}} ^2)$ of the $ { J \mskip -3mu/\mskip -2mu\psi \mskip 2mu}$ candidates for $\langle \mathrm{N_{part}} \rangle=10.6\pm2.9$ after background subtraction. The projections of the fit to disentangle the coherently photo-produced and hadronically produced $ { J \mskip -3mu/\mskip -2mu\psi \mskip 2mu}$ mesons are overlaid. |
Fig2a.pdf [21 KiB] HiDef png [277 KiB] Thumbnail [237 KiB] *.C file |
|
|
Fig2b.pdf [21 KiB] HiDef png [273 KiB] Thumbnail [231 KiB] *.C file |
|
|
|
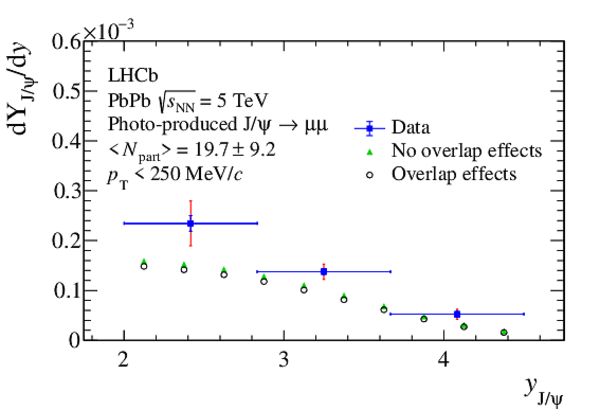
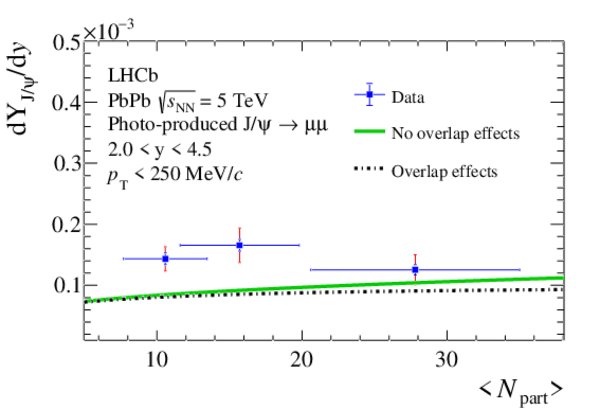
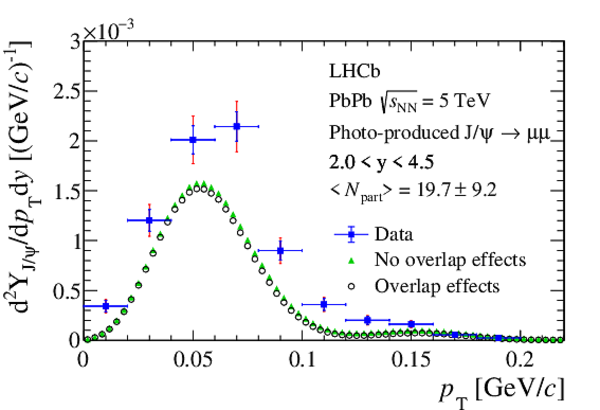
(Top left) Differential yields of photo-produced $ { J \mskip -3mu/\mskip -2mu\psi \mskip 2mu}$ candidates as a function of rapidity and (top right) $\langle \mathrm{N_{part}} \rangle$ . (Bottom) Double differential yields as a function of $ p_{\mathrm{T}}$ . The vertical inner blue bars represent the statistical uncertainty and the outer red bars the total uncertainty. The horizontal bars in the $\langle \mathrm{N_{part}} \rangle$ results correspond to the standard deviation of the $\rm{N_{part}}$ distribution of the MB events. The yields are compared to the prediction from Ref. [17,41] that take (black) or not take (green) into account the effect from the overlap region of the collision. |
Fig3a.pdf [14 KiB] HiDef png [146 KiB] Thumbnail [137 KiB] *.C file |
|
|
Fig3b.pdf [14 KiB] HiDef png [224 KiB] Thumbnail [168 KiB] *.C file |
|
|
|
Fig3c.pdf [19 KiB] HiDef png [231 KiB] Thumbnail [193 KiB] *.C file |
|
|
|
Animated gif made out of all figures. |
PAPER-2020-043.gif Thumbnail |

|
Tables and captions
|
Average number of participant nucleons, $\langle \mathrm{N_{part}} \rangle$ , along with the corresponding standard deviation of the $N_\textrm{part}$ distribution, $\sigma_{\rm part}$, for each of the selected $N_c$ intervals. |
Table_1.pdf [57 KiB] HiDef png [72 KiB] Thumbnail [29 KiB] tex code |

|
Supplementary Material [file]
![HiDef png [378 KiB]](Directory_LHCb-PAPER-2020-043/hidef_Fig1.png)
![HiDef png [277 KiB]](Directory_LHCb-PAPER-2020-043/hidef_Fig2a.png)
![HiDef png [273 KiB]](Directory_LHCb-PAPER-2020-043/hidef_Fig2b.png)
![HiDef png [146 KiB]](Directory_LHCb-PAPER-2020-043/hidef_Fig3a.png)
![HiDef png [224 KiB]](Directory_LHCb-PAPER-2020-043/hidef_Fig3b.png)
![HiDef png [231 KiB]](Directory_LHCb-PAPER-2020-043/hidef_Fig3c.png)
![HiDef png [72 KiB]](Directory_LHCb-PAPER-2020-043/hidef_Table_1.png)
![HiDef png [1 MiB]](Directory_LHCb-PAPER-2020-043/supplementary/hidef_Fig1.png)
![HiDef png [648 KiB]](Directory_LHCb-PAPER-2020-043/supplementary/hidef_Fig2.png)
![HiDef png [457 KiB]](Directory_LHCb-PAPER-2020-043/supplementary/hidef_Fig3.png)
Created on 20 April 2024.