Search for time-dependent $CP$ violation in $D^0 \to K^+ K^-$ and $D^0 \to \pi^+ \pi^-$ decays
[to restricted-access page]Information
LHCb-PAPER-2020-045
CERN-EP-2021-060
arXiv:2105.09889 [PDF]
(Submitted on 20 May 2021)
Phys. Rev. D 104, 072010
Inspire 1864385
Tools
Abstract
A search for time-dependent violation of the charge-parity symmetry in $D^0 \to K^+ K^-$ and $D^0 \to \pi^+ \pi^-$ decays is performed at the LHCb experiment using proton-proton collision data recorded from 2015 to 2018 at a centre-of-mass energy of 13 TeV, corresponding to an integrated luminosity of 6 fb$^{-1}$. The $D^0$ meson is required to originate from a $D^*(2010)^+ \to D^0 \pi^+$ decay, such that its flavour at production is identified by the charge of the accompanying pion. The slope of the time-dependent asymmetry of the decay rates of $D^0$ and $\bar{D}^0$ mesons into the final states under consideration is measured to be $\Delta Y_{K^+ K^-} = (-2.3 \pm 1.5 \pm 0.3) \times 10^{-4}$, $\Delta Y_{\pi^+ \pi^-} = (-4.0 \pm 2.8 \pm 0.4)\times 10^{-4}$, where the first uncertainties are statistical and the second are systematic. These results are compatible with the conservation of the charge-parity symmetry at the level of 2 standard deviations and improve the precision by nearly a factor of two.
Figures and captions
|
Requirement of the single-track selection of the first-stage software trigger in the $\chi^2_{\text{IP}}$ vs. $ p_{\mathrm{T}}$ plane, for the three configurations employed during data taking. The dashed region is excluded by the loosest configuration. |
Fig1.pdf [17 KiB] HiDef png [407 KiB] Thumbnail [350 KiB] *.C file |

|
|
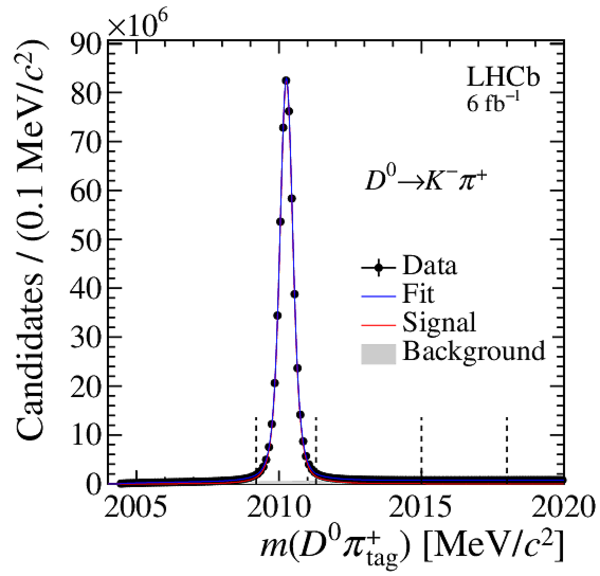
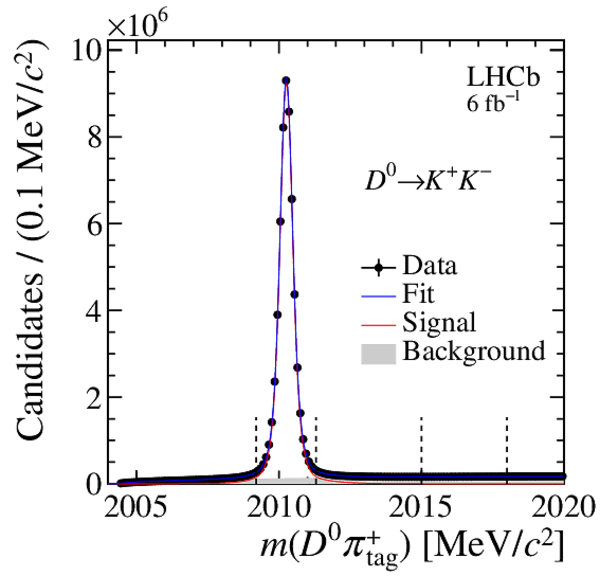
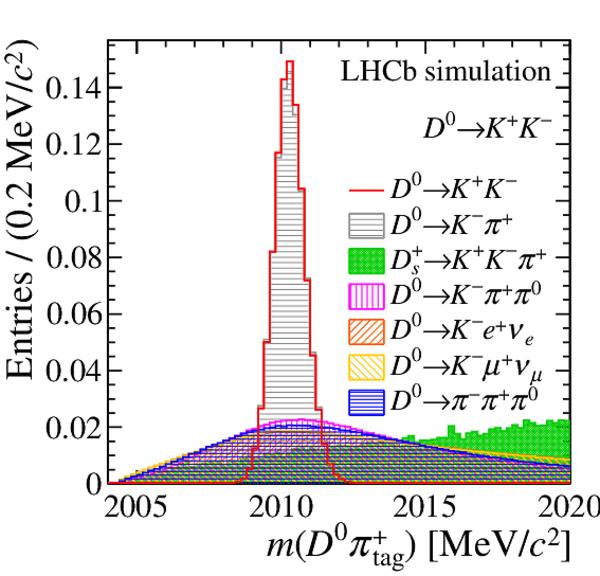
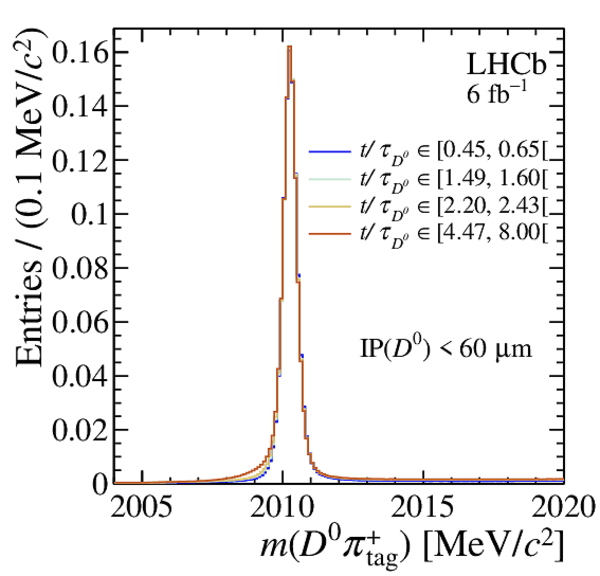
Distribution of $ m( D ^0 \pi ^{+}_{\mathrm{ \scriptscriptstyle tag}} )$ for (top) $ D ^0 \rightarrow K ^- \pi ^+ $ , (left) $ D ^0 \rightarrow K ^+ K ^- $ and (right) $ D ^0 \rightarrow \pi ^+ \pi ^- $ candidates. The signal window and the lateral window employed to remove the combinatorial background (grey filled area) are delimited by the vertical dashed lines. Fit projections are overlaid. |
Fig2a.pdf [38 KiB] HiDef png [270 KiB] Thumbnail [235 KiB] *.C file |
|
|
Fig2b.pdf [37 KiB] HiDef png [254 KiB] Thumbnail [207 KiB] *.C file |
|
|
|
Fig2c.pdf [38 KiB] HiDef png [262 KiB] Thumbnail [219 KiB] *.C file |

|
|
|
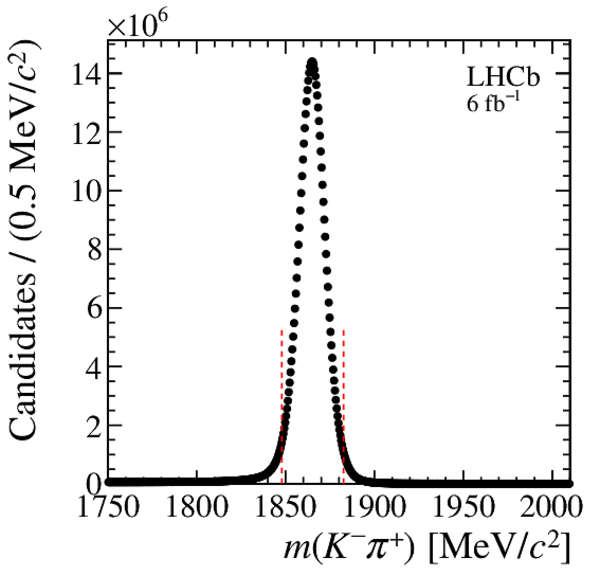
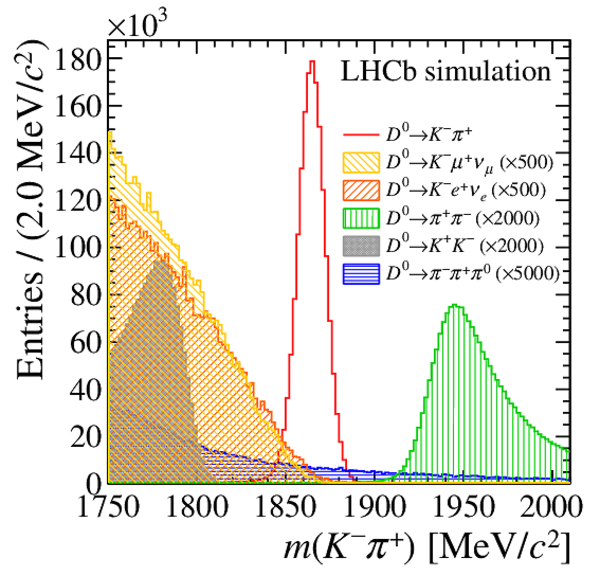
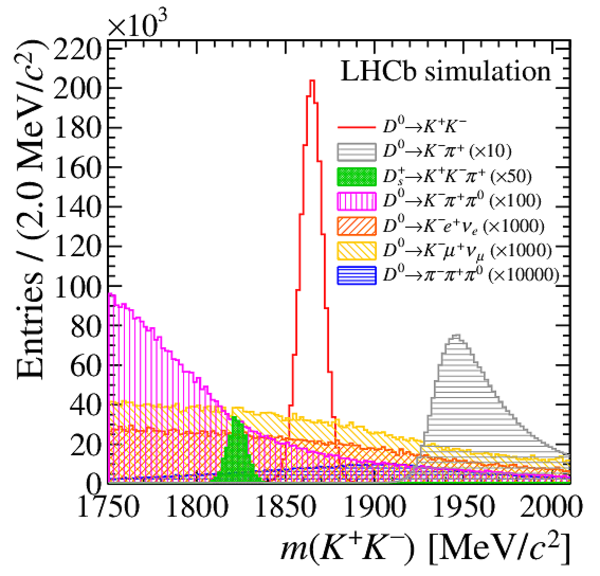
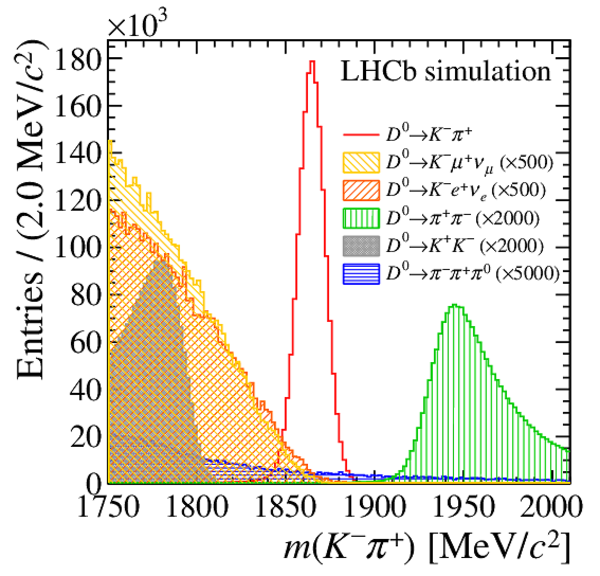
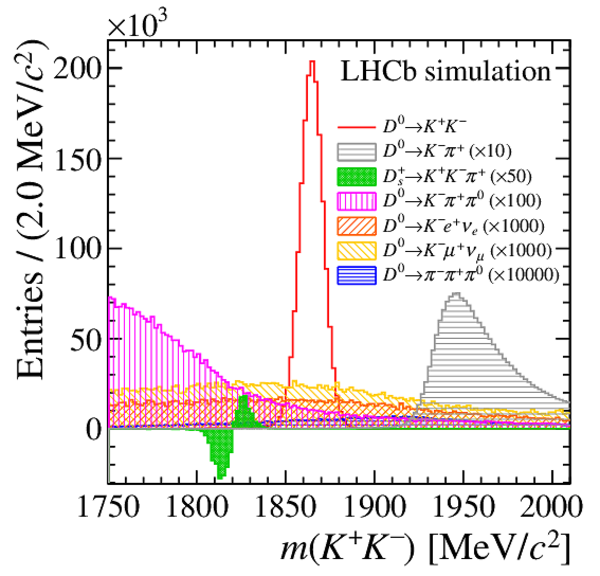
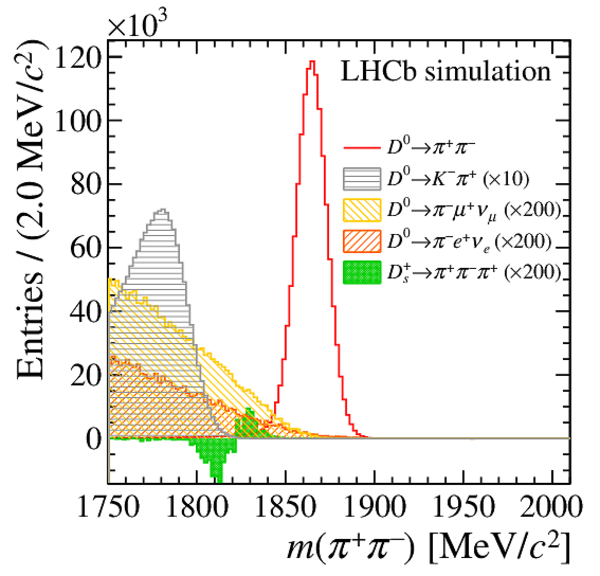
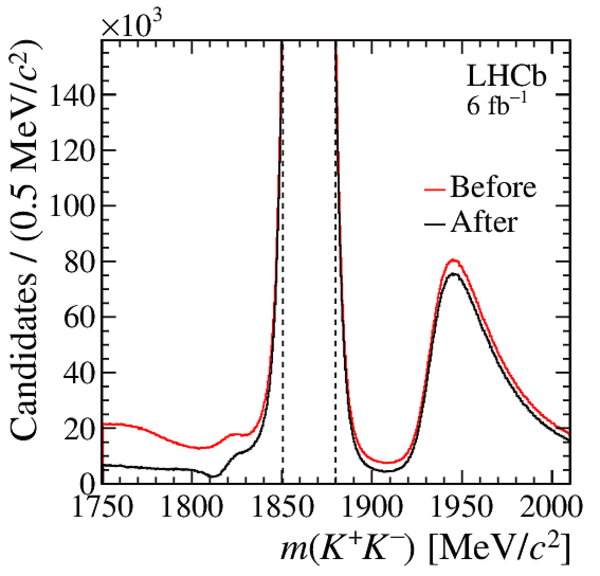
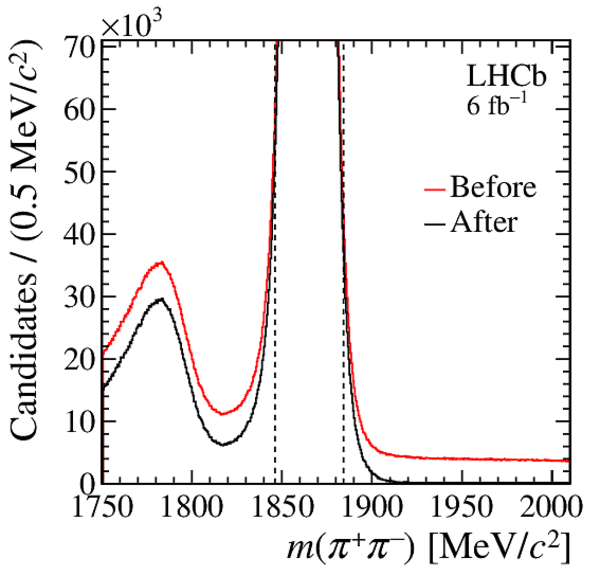
Distribution of $ m( h ^+ h ^- )$ for (top) $ D ^0 \rightarrow K ^- \pi ^+ $ , (left) $ D ^0 \rightarrow K ^+ K ^- $ and (right) $ D ^0 \rightarrow \pi ^+ \pi ^- $ background-subtracted candidates. The signal window is delimited by the vertical dashed lines. |
Fig3a.pdf [29 KiB] HiDef png [190 KiB] Thumbnail [188 KiB] *.C file |
|
|
Fig3b.pdf [30 KiB] HiDef png [204 KiB] Thumbnail [203 KiB] *.C file |

|
|
|
Fig3c.pdf [26 KiB] HiDef png [222 KiB] Thumbnail [228 KiB] *.C file |

|
|
|
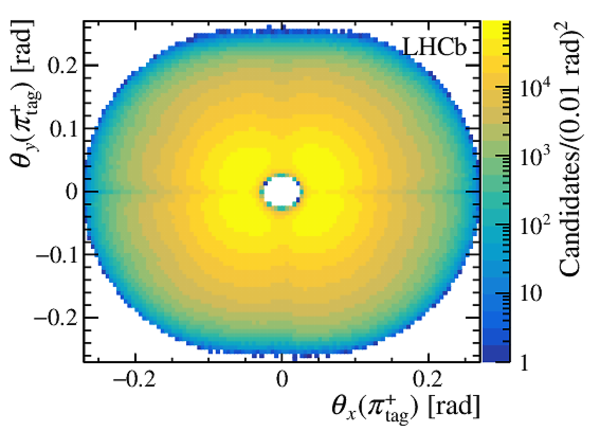
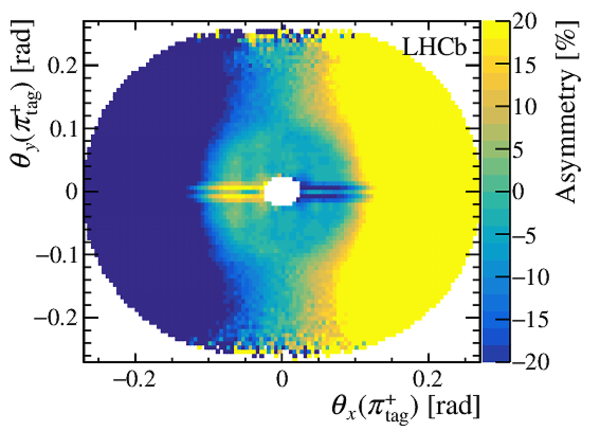
(Left) sum and (right) asymmetry of the distributions of the momentum of $\pi ^{+}_{\mathrm{ \scriptscriptstyle tag}}$ and $\pi ^{-}_{\mathrm{ \scriptscriptstyle tag}}$ candidates, projected on the (top) $k$ vs. $\theta_x$ and (bottom) $\theta_y$ vs. $\theta_x$ planes, for the $ D ^0 \rightarrow K ^- \pi ^+ $ candidates collected in 2017 with the Mag Up polarity. The angles $\theta_{x(y)}$ and the curvature $k$ are defined in the text. The asymmetries during the other data-taking years are similar, and opposite in sign for the data collected with the MagDown polarity. The regions of the distributions with asymmetries whose magnitude is larger than 20% are plotted with the same colour as $\pm 20\%$. These regions are discarded from the data sample after the kinematic weighting. |
Fig4a.pdf [57 KiB] HiDef png [732 KiB] Thumbnail [599 KiB] *.C file |

|
|
Fig4b.pdf [55 KiB] HiDef png [562 KiB] Thumbnail [523 KiB] *.C file |

|
|
|
Fig4c.pdf [44 KiB] HiDef png [527 KiB] Thumbnail [544 KiB] *.C file |
|
|
|
Fig4d.pdf [43 KiB] HiDef png [493 KiB] Thumbnail [506 KiB] *.C file |
|
|
|
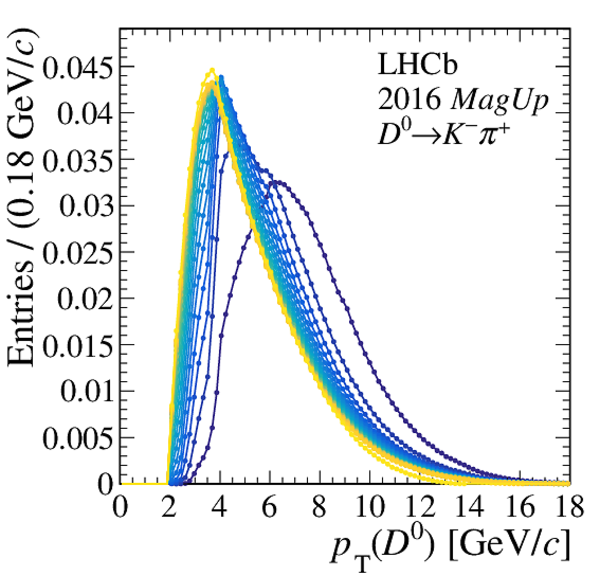
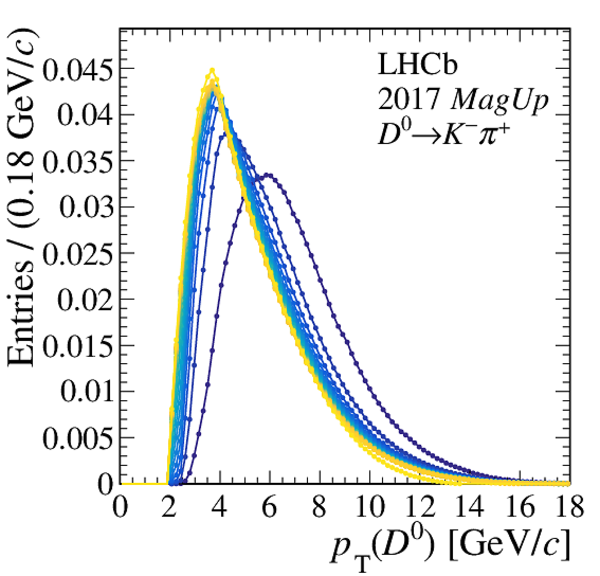
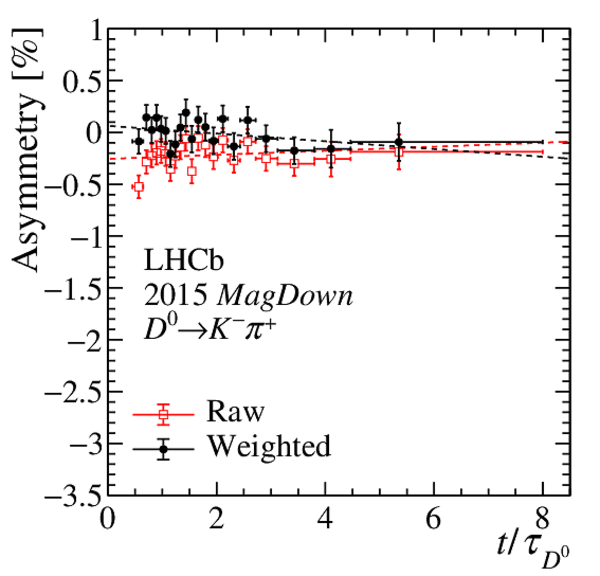
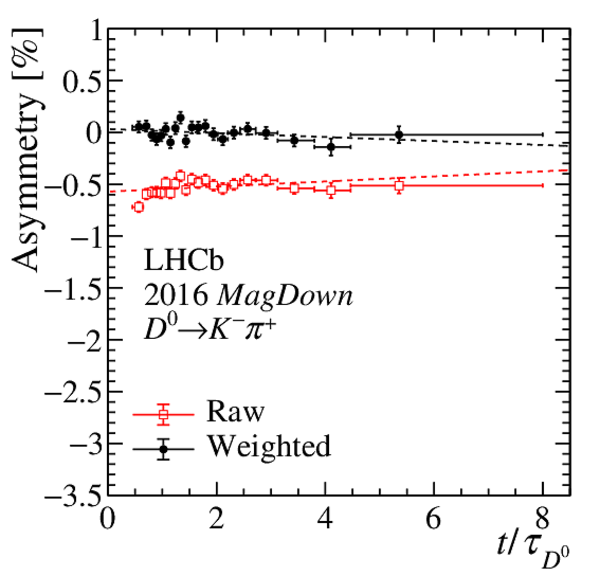
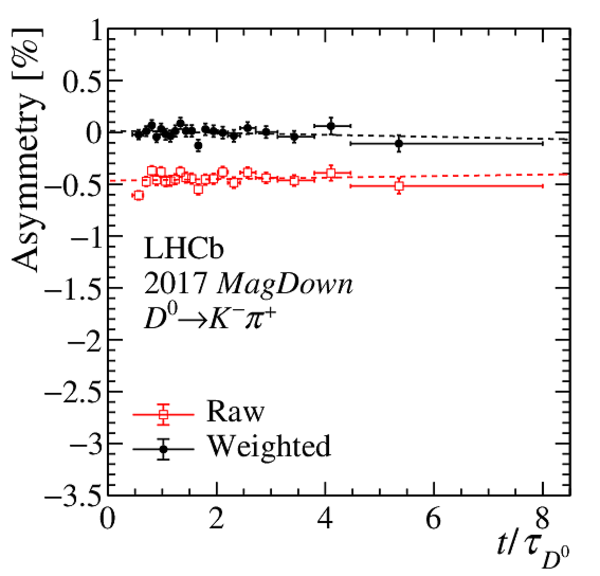
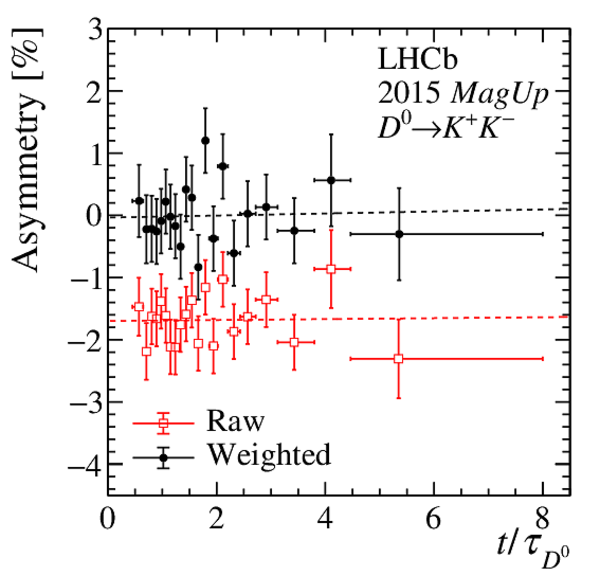
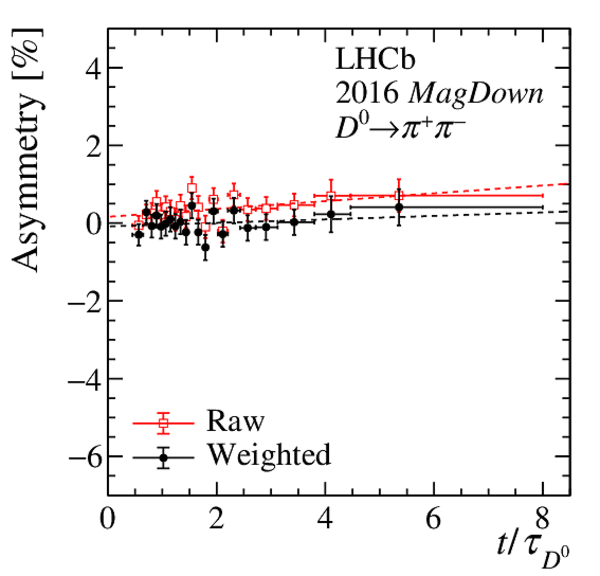
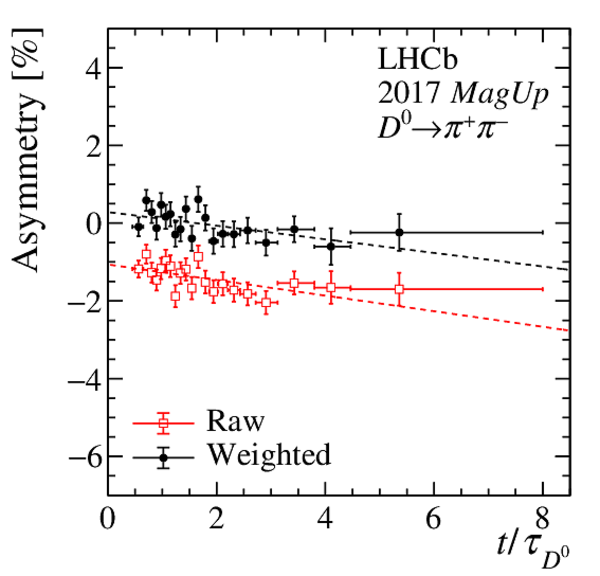
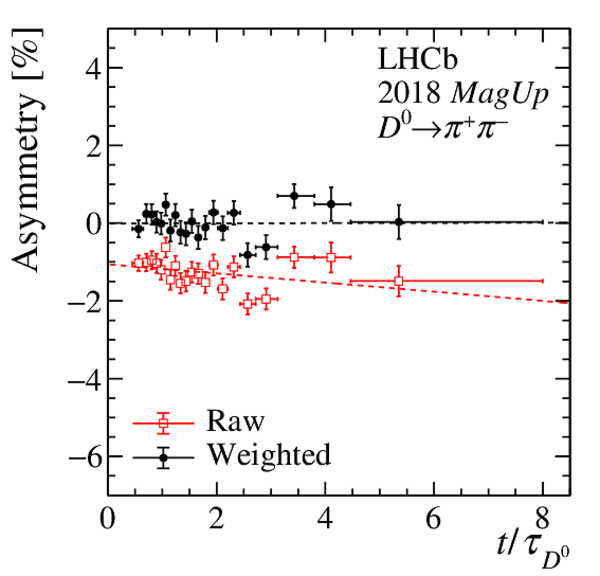
(Top) Normalised distributions of the $ D ^0$ transverse momentum, in different colours for each decay-time interval. Decay time increases from blue to yellow colour. (Centre) Asymmetry between the normalised $ p_{\mathrm{T}} $ distributions of $ D ^0$ and $\overline{ D } {}^0$ mesons. (Bottom) Linear fit to the time-dependent asymmetry (red) before and (black) after the kinematic weighting. All plots correspond to $ D ^0 \rightarrow K ^- \pi ^+ $ candidates recorded with the Mag Up polarity in (left) 2016 and (right) 2017. |
Fig5a.pdf [72 KiB] HiDef png [900 KiB] Thumbnail [403 KiB] *.C file |
|
|
Fig5b.pdf [71 KiB] HiDef png [735 KiB] Thumbnail [356 KiB] *.C file |
|
|
|
Fig5c.pdf [21 KiB] HiDef png [260 KiB] Thumbnail [253 KiB] *.C file |

|
|
|
Fig5d.pdf [21 KiB] HiDef png [259 KiB] Thumbnail [250 KiB] *.C file |

|
|
|
Fig5e.pdf [18 KiB] HiDef png [199 KiB] Thumbnail [189 KiB] *.C file |

|
|
|
Fig5f.pdf [18 KiB] HiDef png [200 KiB] Thumbnail [188 KiB] *.C file |

|
|
|
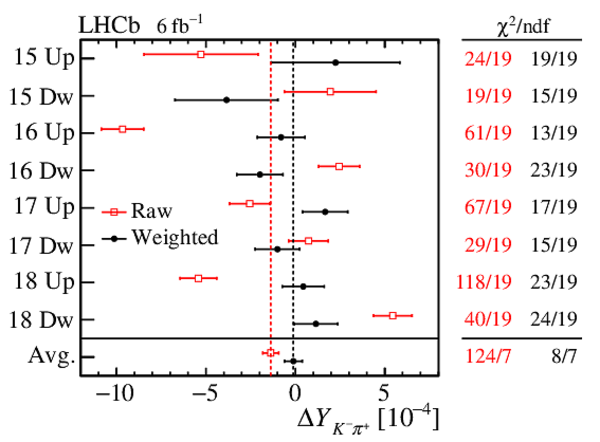
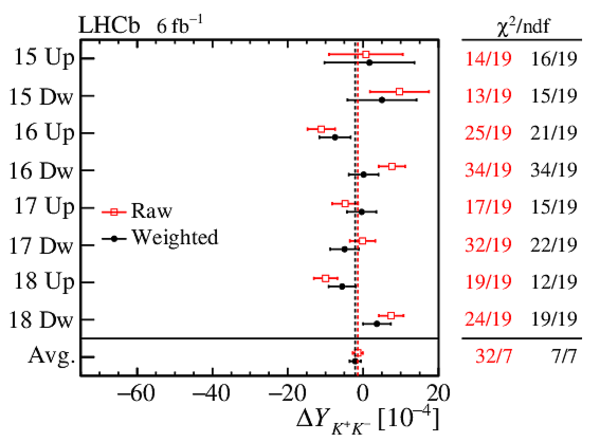
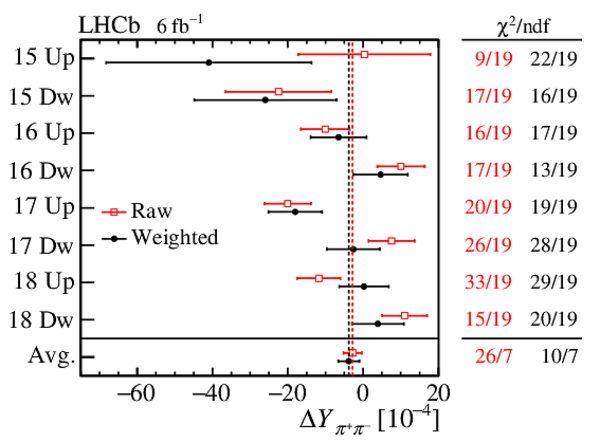
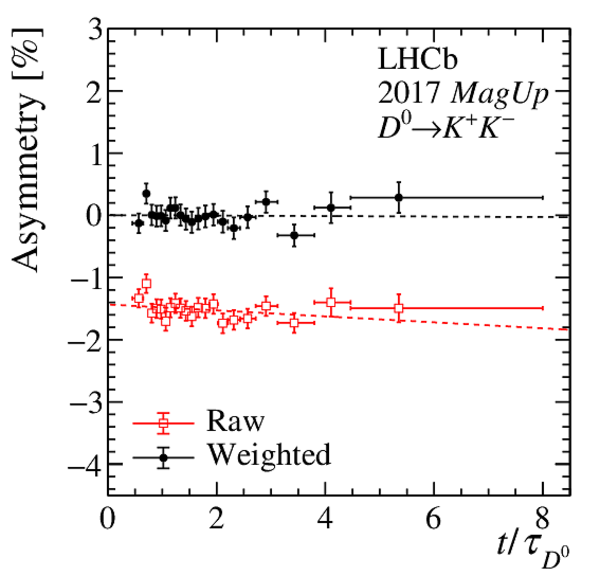
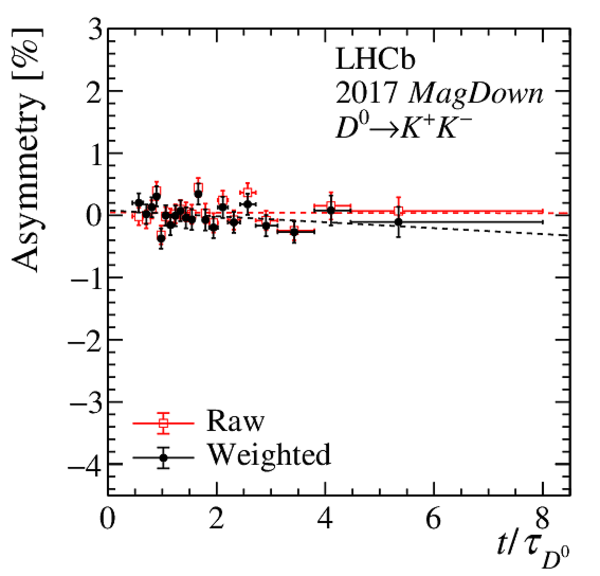
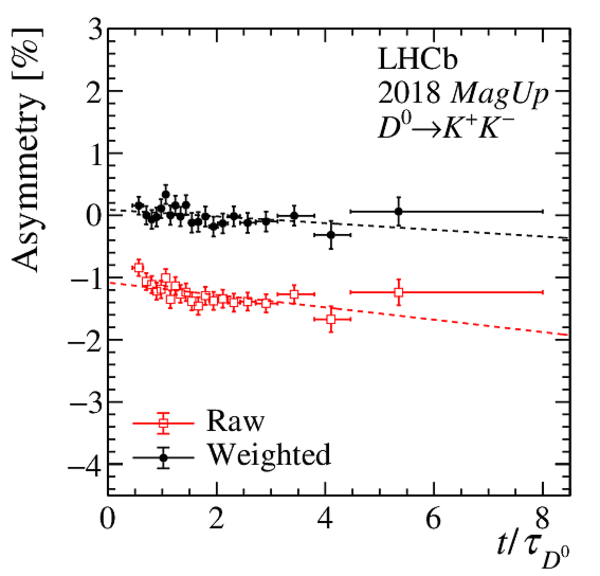
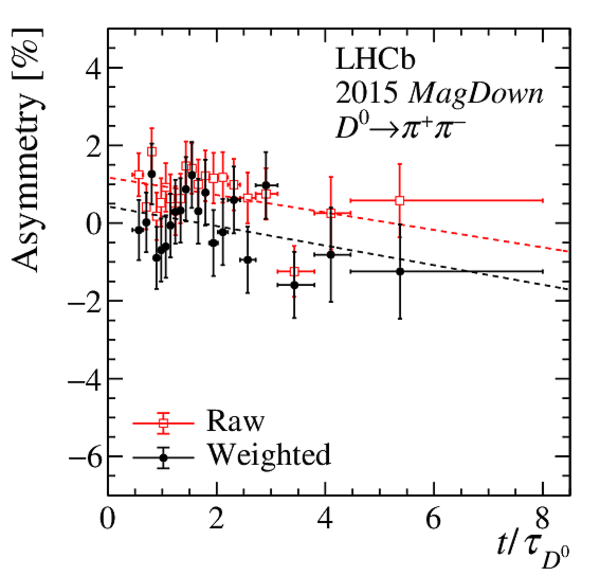
Results of the fits to the time-dependent asymmetry for each subsample, for (top) $ K ^- \pi ^+ $ , (bottom left) $ K ^+ K ^- $ and (bottom right) $\pi ^+ \pi ^- $ final states. In the $y$-axis labels, the data-taking year is abbreviated with the last two digits only and the magnet polarity Mag Up ( MagDown ) is abbreviated as "Up" ("Dw"), while "Avg." denotes the weighted average. The fit $\chi^2/\mathrm{ndf}$ are reported on the right of each plot. Empty red squares and solid black dots correspond to data before and after the equalisation of the $\pi ^{+}_{\mathrm{ \scriptscriptstyle tag}}$ and $ D ^0$ kinematics, respectively, and prior to subtracting the contribution of secondary decays described in Sect. 6. |
Fig6a.pdf [14 KiB] HiDef png [210 KiB] Thumbnail [177 KiB] *.C file |
|
|
Fig6b.pdf [14 KiB] HiDef png [211 KiB] Thumbnail [175 KiB] *.C file |
|
|
|
Fig6c.pdf [14 KiB] HiDef png [212 KiB] Thumbnail [180 KiB] *.C file |
|
|
|
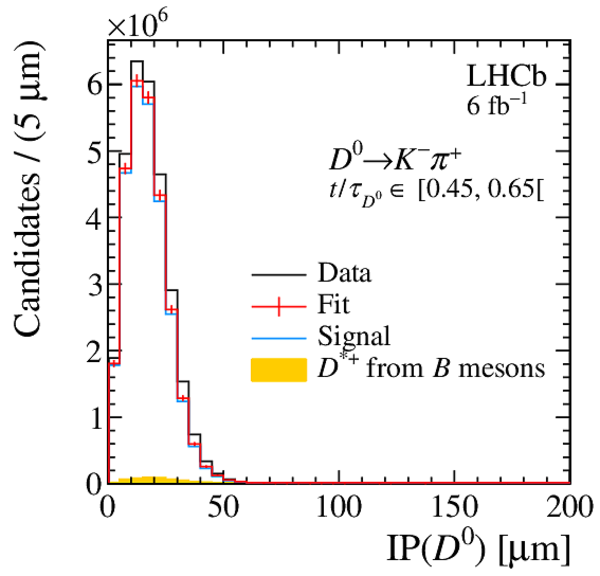
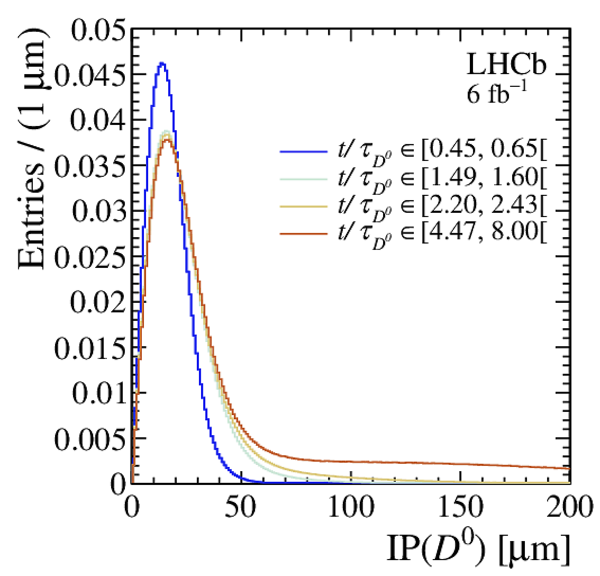
Impact parameter distribution of the $ D ^0 \rightarrow K ^- \pi ^+ $ candidates for the (top) first, (left) middle and (right) last decay-time interval. The projections of the two-dimensional template fit are superimposed. |
Fig7a.pdf [15 KiB] HiDef png [190 KiB] Thumbnail [184 KiB] *.C file |
|
|
Fig7b.pdf [16 KiB] HiDef png [204 KiB] Thumbnail [200 KiB] *.C file |

|
|
|
Fig7c.pdf [16 KiB] HiDef png [221 KiB] Thumbnail [213 KiB] *.C file |

|
|
|
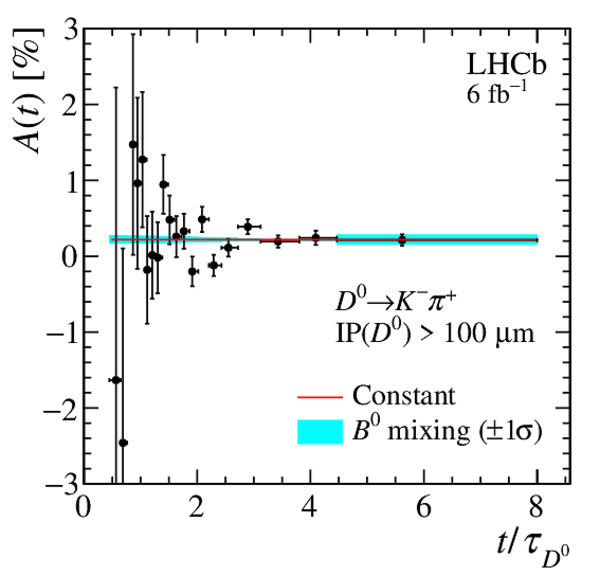
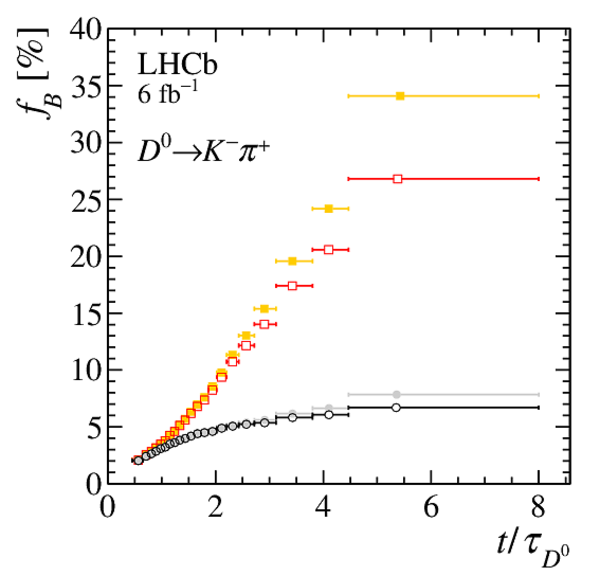
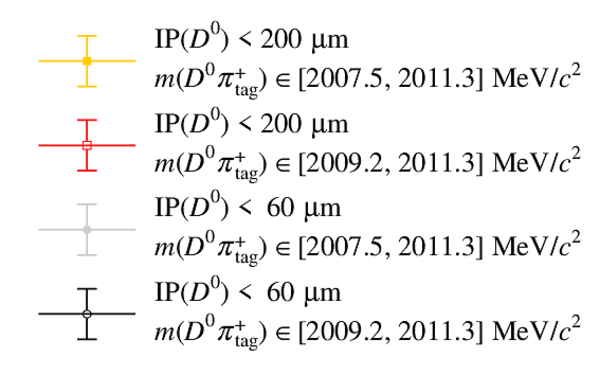
(Left) Fraction of secondary decays from $ B $ mesons measured in the template fit. Only statistical uncertainties are displayed. (Right) Measured asymmetry, after the kinematic weighting, of data with $\mathrm{IP}( D ^0 ) > 100 \upmu\text{m} $ in the enlarged $ m( D ^0 \pi ^{+}_{\mathrm{ \scriptscriptstyle tag}} )$ signal window. The fit of a constant function is shown in red, while the $1\sigma$ band corresponding to the possible impact of $ B ^0$ mixing is plotted in cyan. |
Fig8a.pdf [14 KiB] HiDef png [77 KiB] Thumbnail [49 KiB] *.C file |

|
|
Fig8b.pdf [16 KiB] HiDef png [151 KiB] Thumbnail [152 KiB] *.C file |
|
|
|
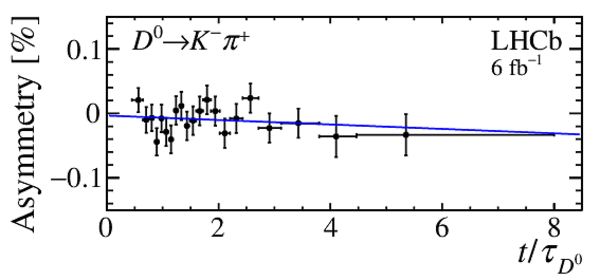
Asymmetry, $A_\mathrm{sig}(t)$, of $ D ^0 \rightarrow K ^- \pi ^+ $ candidates as a function of decay time. A linear fit is superimposed. The $\chi^2/\mathrm{ndf}$ of the fit is $17/19$. |
Fig9.pdf [16 KiB] HiDef png [108 KiB] Thumbnail [99 KiB] *.C file |
|
|
Relative shift of the $ D ^{*+}$ and $ D ^{*-}$ mass peaks as a function of decay time for the $ K ^- \pi ^+ $ decay channel. |
Fig10.pdf [16 KiB] HiDef png [170 KiB] Thumbnail [167 KiB] *.C file |

|
|
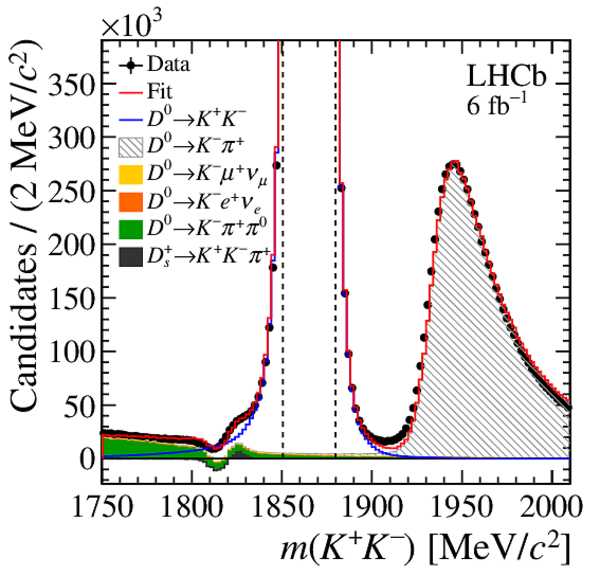
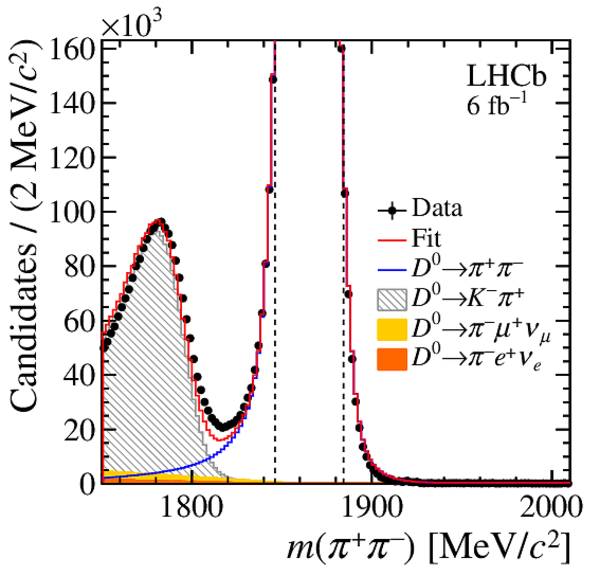
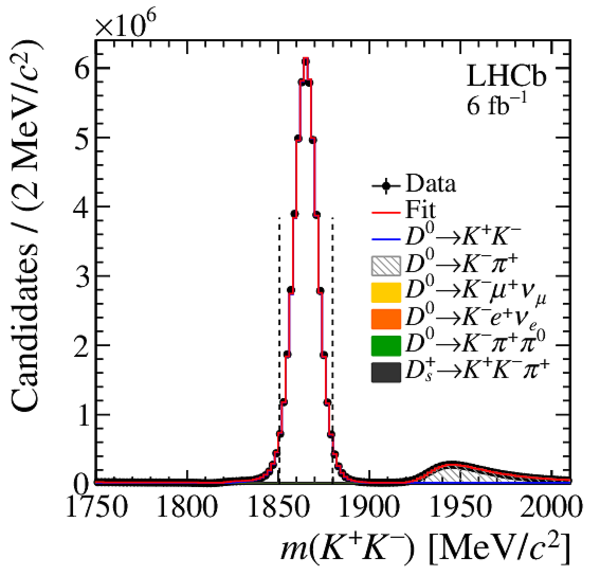
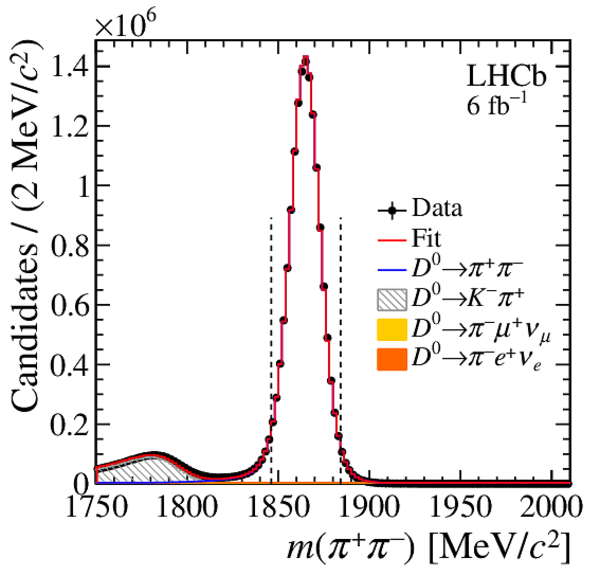
Distributions of $ m( h ^+ h ^- )$ of (top) $ K ^- \pi ^+ $ , (left) $ K ^+ K ^- $ and (right) $\pi ^+ \pi ^- $ final states, with the results superimposed. The background components are stacked; the $ m( h ^+ h ^- )$ template PDF of the $ D ^+_ s \rightarrow K ^+ K ^- \pi ^+ $ decay has a negative contribution to the left of the known $ D ^0$ mass due to the subtraction of the $ m( D ^0 \pi ^{+}_{\mathrm{ \scriptscriptstyle tag}} )$ background. The vertical dashed lines delimit the signal region. |
Fig11a.pdf [23 KiB] HiDef png [280 KiB] Thumbnail [264 KiB] *.C file |

|
|
Fig11b.pdf [26 KiB] HiDef png [458 KiB] Thumbnail [430 KiB] *.C file |
|
|
|
Fig11c.pdf [23 KiB] HiDef png [368 KiB] Thumbnail [347 KiB] *.C file |
|
|
|
Asymmetry, $A_\mathrm{sig}(t)$, as a function of decay time for (top) $ D ^0 \rightarrow K ^+ K ^- $ and (bottom) $ D ^0 \rightarrow \pi ^+ \pi ^- $ candidates. A linear fit is superimposed. The $\chi^2/\mathrm{ndf}$ of the fits are $15/19$ and $21/19$, respectively. |
Fig12a.pdf [16 KiB] HiDef png [108 KiB] Thumbnail [96 KiB] *.C file |

|
|
Fig12b.pdf [16 KiB] HiDef png [111 KiB] Thumbnail [102 KiB] *.C file |

|
|
|
Animated gif made out of all figures. |
PAPER-2020-045.gif Thumbnail |

|
Tables and captions
|
Summary of the systematic uncertainties, in units of $10^{-4}$. The statistical uncertainties are reported for comparison. |
Table_1.pdf [79 KiB] HiDef png [55 KiB] Thumbnail [24 KiB] tex code |

|
Supplementary Material [file]


![HiDef png [407 KiB]](Directory_LHCb-PAPER-2020-045/hidef_Fig1.png)
![HiDef png [270 KiB]](Directory_LHCb-PAPER-2020-045/hidef_Fig2a.png)
![HiDef png [254 KiB]](Directory_LHCb-PAPER-2020-045/hidef_Fig2b.png)
![HiDef png [262 KiB]](Directory_LHCb-PAPER-2020-045/hidef_Fig2c.png)
![HiDef png [190 KiB]](Directory_LHCb-PAPER-2020-045/hidef_Fig3a.png)
![HiDef png [204 KiB]](Directory_LHCb-PAPER-2020-045/hidef_Fig3b.png)
![HiDef png [222 KiB]](Directory_LHCb-PAPER-2020-045/hidef_Fig3c.png)
![HiDef png [732 KiB]](Directory_LHCb-PAPER-2020-045/hidef_Fig4a.png)
![HiDef png [562 KiB]](Directory_LHCb-PAPER-2020-045/hidef_Fig4b.png)
![HiDef png [527 KiB]](Directory_LHCb-PAPER-2020-045/hidef_Fig4c.png)
![HiDef png [493 KiB]](Directory_LHCb-PAPER-2020-045/hidef_Fig4d.png)
![HiDef png [900 KiB]](Directory_LHCb-PAPER-2020-045/hidef_Fig5a.png)
![HiDef png [735 KiB]](Directory_LHCb-PAPER-2020-045/hidef_Fig5b.png)
![HiDef png [260 KiB]](Directory_LHCb-PAPER-2020-045/hidef_Fig5c.png)
![HiDef png [259 KiB]](Directory_LHCb-PAPER-2020-045/hidef_Fig5d.png)
![HiDef png [199 KiB]](Directory_LHCb-PAPER-2020-045/hidef_Fig5e.png)
![HiDef png [200 KiB]](Directory_LHCb-PAPER-2020-045/hidef_Fig5f.png)
![HiDef png [210 KiB]](Directory_LHCb-PAPER-2020-045/hidef_Fig6a.png)
![HiDef png [211 KiB]](Directory_LHCb-PAPER-2020-045/hidef_Fig6b.png)
![HiDef png [212 KiB]](Directory_LHCb-PAPER-2020-045/hidef_Fig6c.png)
![HiDef png [190 KiB]](Directory_LHCb-PAPER-2020-045/hidef_Fig7a.png)
![HiDef png [204 KiB]](Directory_LHCb-PAPER-2020-045/hidef_Fig7b.png)
![HiDef png [221 KiB]](Directory_LHCb-PAPER-2020-045/hidef_Fig7c.png)
![HiDef png [77 KiB]](Directory_LHCb-PAPER-2020-045/hidef_Fig8a.png)
![HiDef png [151 KiB]](Directory_LHCb-PAPER-2020-045/hidef_Fig8b.png)
![HiDef png [108 KiB]](Directory_LHCb-PAPER-2020-045/hidef_Fig9.png)
![HiDef png [170 KiB]](Directory_LHCb-PAPER-2020-045/hidef_Fig10.png)
![HiDef png [280 KiB]](Directory_LHCb-PAPER-2020-045/hidef_Fig11a.png)
![HiDef png [458 KiB]](Directory_LHCb-PAPER-2020-045/hidef_Fig11b.png)
![HiDef png [368 KiB]](Directory_LHCb-PAPER-2020-045/hidef_Fig11c.png)
![HiDef png [108 KiB]](Directory_LHCb-PAPER-2020-045/hidef_Fig12a.png)
![HiDef png [111 KiB]](Directory_LHCb-PAPER-2020-045/hidef_Fig12b.png)
![HiDef png [55 KiB]](Directory_LHCb-PAPER-2020-045/hidef_Table_1.png)
![HiDef png [215 KiB]](Directory_LHCb-PAPER-2020-045/supplementary/hidef_Fig1.png)
![HiDef png [825 KiB]](Directory_LHCb-PAPER-2020-045/supplementary/hidef_Fig10a.png)
![HiDef png [786 KiB]](Directory_LHCb-PAPER-2020-045/supplementary/hidef_Fig10b.png)
![HiDef png [791 KiB]](Directory_LHCb-PAPER-2020-045/supplementary/hidef_Fig10c.png)
![HiDef png [996 KiB]](Directory_LHCb-PAPER-2020-045/supplementary/hidef_Fig10d.png)
![HiDef png [690 KiB]](Directory_LHCb-PAPER-2020-045/supplementary/hidef_Fig10e.png)
![HiDef png [533 KiB]](Directory_LHCb-PAPER-2020-045/supplementary/hidef_Fig10f.png)
![HiDef png [985 KiB]](Directory_LHCb-PAPER-2020-045/supplementary/hidef_Fig10g.png)
![HiDef png [550 KiB]](Directory_LHCb-PAPER-2020-045/supplementary/hidef_Fig10h.png)
![HiDef png [510 KiB]](Directory_LHCb-PAPER-2020-045/supplementary/hidef_Fig10i.png)
![HiDef png [277 KiB]](Directory_LHCb-PAPER-2020-045/supplementary/hidef_Fig11a.png)
![HiDef png [285 KiB]](Directory_LHCb-PAPER-2020-045/supplementary/hidef_Fig11b.png)
![HiDef png [250 KiB]](Directory_LHCb-PAPER-2020-045/supplementary/hidef_Fig12a.png)
![HiDef png [270 KiB]](Directory_LHCb-PAPER-2020-045/supplementary/hidef_Fig12b.png)
![HiDef png [268 KiB]](Directory_LHCb-PAPER-2020-045/supplementary/hidef_Fig12c.png)
![HiDef png [143 KiB]](Directory_LHCb-PAPER-2020-045/supplementary/hidef_Fig13.png)
![HiDef png [124 KiB]](Directory_LHCb-PAPER-2020-045/supplementary/hidef_Fig14a.png)
![HiDef png [230 KiB]](Directory_LHCb-PAPER-2020-045/supplementary/hidef_Fig14b.png)
![HiDef png [353 KiB]](Directory_LHCb-PAPER-2020-045/supplementary/hidef_Fig15a.png)
![HiDef png [326 KiB]](Directory_LHCb-PAPER-2020-045/supplementary/hidef_Fig15b.png)
![HiDef png [257 KiB]](Directory_LHCb-PAPER-2020-045/supplementary/hidef_Fig15c.png)
![HiDef png [212 KiB]](Directory_LHCb-PAPER-2020-045/supplementary/hidef_Fig2a.png)
![HiDef png [215 KiB]](Directory_LHCb-PAPER-2020-045/supplementary/hidef_Fig2b.png)
![HiDef png [199 KiB]](Directory_LHCb-PAPER-2020-045/supplementary/hidef_Fig2c.png)
![HiDef png [203 KiB]](Directory_LHCb-PAPER-2020-045/supplementary/hidef_Fig2d.png)
![HiDef png [198 KiB]](Directory_LHCb-PAPER-2020-045/supplementary/hidef_Fig2e.png)
![HiDef png [198 KiB]](Directory_LHCb-PAPER-2020-045/supplementary/hidef_Fig2f.png)
![HiDef png [195 KiB]](Directory_LHCb-PAPER-2020-045/supplementary/hidef_Fig2g.png)
![HiDef png [200 KiB]](Directory_LHCb-PAPER-2020-045/supplementary/hidef_Fig2h.png)
![HiDef png [203 KiB]](Directory_LHCb-PAPER-2020-045/supplementary/hidef_Fig3a.png)
![HiDef png [209 KiB]](Directory_LHCb-PAPER-2020-045/supplementary/hidef_Fig3b.png)
![HiDef png [199 KiB]](Directory_LHCb-PAPER-2020-045/supplementary/hidef_Fig3c.png)
![HiDef png [195 KiB]](Directory_LHCb-PAPER-2020-045/supplementary/hidef_Fig3d.png)
![HiDef png [194 KiB]](Directory_LHCb-PAPER-2020-045/supplementary/hidef_Fig3e.png)
![HiDef png [192 KiB]](Directory_LHCb-PAPER-2020-045/supplementary/hidef_Fig3f.png)
![HiDef png [198 KiB]](Directory_LHCb-PAPER-2020-045/supplementary/hidef_Fig3g.png)
![HiDef png [194 KiB]](Directory_LHCb-PAPER-2020-045/supplementary/hidef_Fig3h.png)
![HiDef png [204 KiB]](Directory_LHCb-PAPER-2020-045/supplementary/hidef_Fig4a.png)
![HiDef png [208 KiB]](Directory_LHCb-PAPER-2020-045/supplementary/hidef_Fig4b.png)
![HiDef png [193 KiB]](Directory_LHCb-PAPER-2020-045/supplementary/hidef_Fig4c.png)
![HiDef png [194 KiB]](Directory_LHCb-PAPER-2020-045/supplementary/hidef_Fig4d.png)
![HiDef png [194 KiB]](Directory_LHCb-PAPER-2020-045/supplementary/hidef_Fig4e.png)
![HiDef png [196 KiB]](Directory_LHCb-PAPER-2020-045/supplementary/hidef_Fig4f.png)
![HiDef png [191 KiB]](Directory_LHCb-PAPER-2020-045/supplementary/hidef_Fig4g.png)
![HiDef png [195 KiB]](Directory_LHCb-PAPER-2020-045/supplementary/hidef_Fig4h.png)
![HiDef png [175 KiB]](Directory_LHCb-PAPER-2020-045/supplementary/hidef_Fig5.png)
![HiDef png [340 KiB]](Directory_LHCb-PAPER-2020-045/supplementary/hidef_Fig6a.png)
![HiDef png [316 KiB]](Directory_LHCb-PAPER-2020-045/supplementary/hidef_Fig6b.png)
![HiDef png [271 KiB]](Directory_LHCb-PAPER-2020-045/supplementary/hidef_Fig7a.png)
![HiDef png [286 KiB]](Directory_LHCb-PAPER-2020-045/supplementary/hidef_Fig7b.png)
![HiDef png [149 KiB]](Directory_LHCb-PAPER-2020-045/supplementary/hidef_Fig8a.png)
![HiDef png [197 KiB]](Directory_LHCb-PAPER-2020-045/supplementary/hidef_Fig8b.png)
![HiDef png [203 KiB]](Directory_LHCb-PAPER-2020-045/supplementary/hidef_Fig9a.png)
![HiDef png [228 KiB]](Directory_LHCb-PAPER-2020-045/supplementary/hidef_Fig9b.png)
![HiDef png [221 KiB]](Directory_LHCb-PAPER-2020-045/supplementary/hidef_Fig9c.png)
![HiDef png [238 KiB]](Directory_LHCb-PAPER-2020-045/supplementary/hidef_Fig9d.png)
![HiDef png [260 KiB]](Directory_LHCb-PAPER-2020-045/supplementary/hidef_Fig9e.png)
![HiDef png [248 KiB]](Directory_LHCb-PAPER-2020-045/supplementary/hidef_Fig9f.png)
Created on 27 April 2024.