IOP : Search for the doubly heavy baryons $\Omega^0_{bc}$ and $\Xi^0_{bc}$ decaying to $\Lambda^+_c \pi^-$ and $\Xi^+_c \pi^-$
[to restricted-access page]Information
LHCb-PAPER-2021-002
CERN-EP-2021-046
arXiv:2104.04759 [PDF]
(Submitted on 10 Apr 2021)
Chin. Phys. C 45 093002
Inspire 1857805
Tools
Abstract
The first search for the doubly heavy $\it{\Omega}_{bc}^{\rm0}$ baryon and a search for $\it{\Xi}_{bc}^{\rm0}$ baryon are performed using $pp$ collision data collected via the LHCb experiment from 2016 to 2018 at a centre-of-mass energy of $13TeV$, corresponding to an integrated luminosity of 5.2$fb^{-1}$. The baryons are reconstructed via their decays to $\it{\Lambda_{c}^{+}\pi^{-}}$ and $\it{\Xi_{c}^{+}\pi^{-}}$. No significant excess is found for invariant masses between 6700 and 7300$MeV/c^2$, in a rapidity range from 2.0 to 4.5 and a transverse momentum range from 2 to 20$GeV/c$. Upper limits are set on the ratio of the $\it{\Omega}_{bc}^{\rm0}$ and $\it{\Xi}_{bc}^{\rm0}$ production cross-section times the branching fraction to $\it{\Lambda_{c}^{+}\pi^{-}}$ ($\it{\Xi_{c}^{+}\pi^{-}}$) relative to that of the $\it{\Lambda_b^{\rm0}}$ ($\it{\Xi_b^{\rm0}}$) baryon, for different lifetime hypotheses, at $95\%$ confidence level. The upper limits range from $0.5\times10^{-4}$ to $2.5\times10^{-4}$ for the $\it{\Omega}_{bc}^{\rm0}\rightarrow\it{\Lambda_{c}^{+}\pi^{-}}$ ($\it{\Xi}_{bc}^{\rm0}\rightarrow\it{\Lambda_{c}^{+}\pi^{-}}$) decay, and from $1.4\times10^{-3}$ to $6.9\times10^{-3}$ for the $\it{\Omega}_{bc}^{\rm0}\rightarrow\it{\Xi_{c}^{+}\pi^{-}}$ ($\it{\Xi}_{bc}^{\rm0}\rightarrow\it{\Xi_{c}^{+}\pi^{-}}$) decay, depending on the considered mass and lifetime of the $\it{\Omega}_{bc}^{\rm0}$ ($\it{\Xi}_{bc}^{\rm0}$) baryon.
Figures and captions
|
Examples of Feynman diagrams for the $\Omega _{ b c }^{0} \rightarrow \Lambda ^+_ c \pi ^- $, $\Omega _{ b c }^{0} \rightarrow \Xi _{ c }^{+} \pi ^- $, $\Xi _{ b c }^{0} \rightarrow \Lambda ^+_ c \pi ^- $ and $\Xi _{ b c }^{0} \rightarrow \Xi _{ c }^{+} \pi ^- $ decays. |
Omgbc2[..].pdf [35 KiB] HiDef png [26 KiB] Thumbnail [14 KiB] *.C file |

|
|
Omgbc2[..].pdf [33 KiB] HiDef png [23 KiB] Thumbnail [12 KiB] *.C file |

|
|
|
Xibc2L[..].pdf [33 KiB] HiDef png [23 KiB] Thumbnail [12 KiB] *.C file |

|
|
|
Xibc2X[..].pdf [33 KiB] HiDef png [21 KiB] Thumbnail [11 KiB] *.C file |

|
|
|
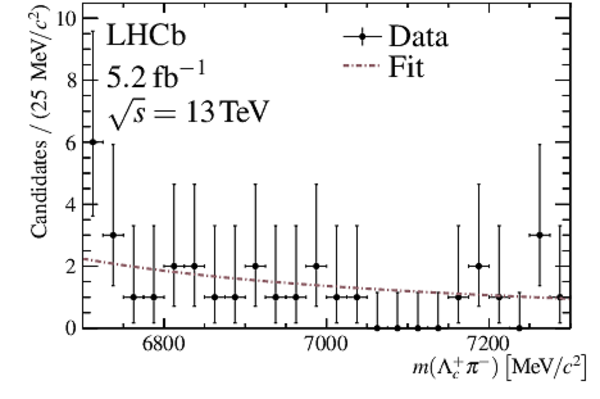
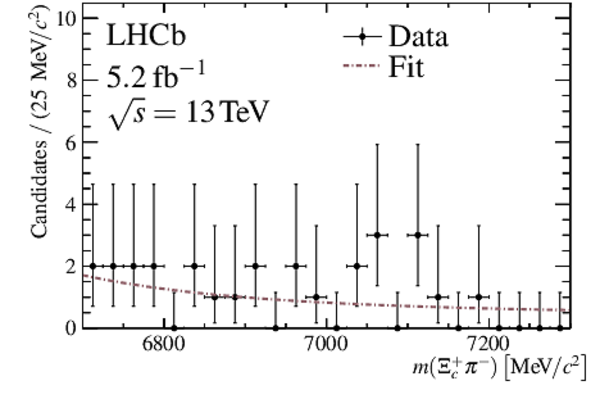
Invariant mass distributions of selected (left) $ H_{ b c }^{0} \rightarrow \Lambda ^+_ c \pi ^- $ and (right) $ H_{ b c }^{0} \rightarrow \Xi _{ c }^{+} \pi ^- $ candidates (black points), together with results of the background only fit (brown dashed line). |
Threey[..].pdf [63 KiB] HiDef png [166 KiB] Thumbnail [162 KiB] *.C file |
|
|
Threey[..].pdf [63 KiB] HiDef png [164 KiB] Thumbnail [160 KiB] *.C file |
|
|
|
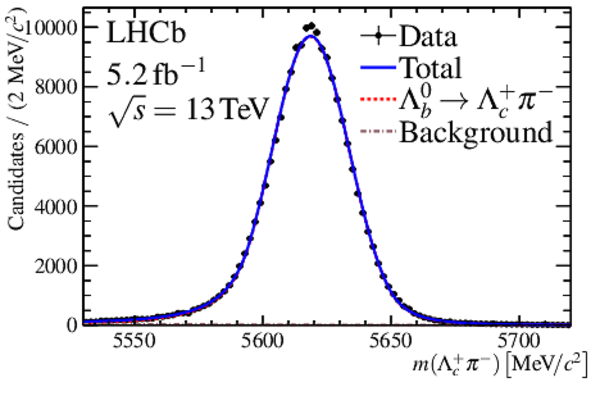
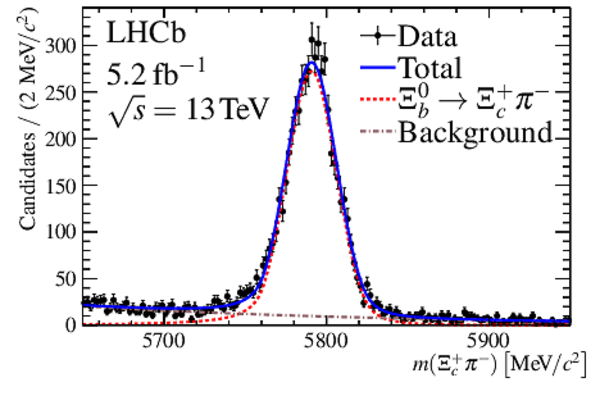
Invariant mass distributions of (left) $\Lambda ^0_ b \rightarrow \Lambda ^+_ c (\rightarrow \ p K ^- \pi ^+ )\pi ^- $ and (right) $\Xi _{ b }^{0} \rightarrow \Xi _{ c }^{+} (\rightarrow \ p K ^- \pi ^+ )\pi ^- $ candidates with the fit results overlaid (blue solid line). The black points represent the data, the red dashed line represents the signal contribution, and the gray dashed line represents the combinatorial background. |
massfi[..].pdf [74 KiB] HiDef png [237 KiB] Thumbnail [215 KiB] *.C file |
|
|
massfi[..].pdf [80 KiB] HiDef png [266 KiB] Thumbnail [239 KiB] *.C file |
|
|
|
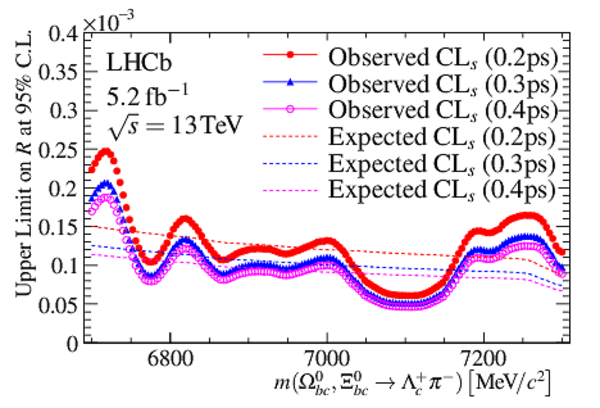
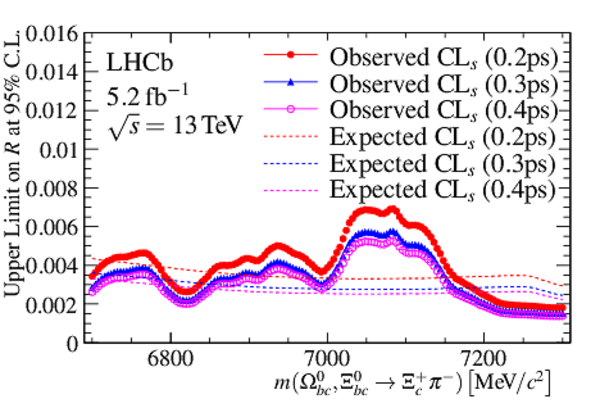
Upper limits (dotted lines) on the ratio of production cross-section for $\Omega _{ b c }^{0}$ and $\Xi _{ b c }^{0}$ via decays to (left) $\Lambda ^+_ c $ $\pi ^-$ and (right) $\Xi _{ c }^{+}$ $\pi ^-$ to that of control channels $\Lambda ^0_ b \rightarrow \Lambda ^+_ c \pi ^- $ and $\Xi _{ b }^{0} \rightarrow \Xi _{ c }^{+} \pi ^- $ . The dotted (dashed) colored lines represent the observed (expected) upper limits. The assumed lifetime hypotheses for the $\Omega _{ b c }^{0}$ ( $\Xi _{ b c }^{0}$ ) are 0.2 $\text{ ps}$ (red filled circles), 0.3 $\text{ ps}$ (blue triangles), and 0.4 $\text{ ps}$ (magenta open circles). |
Threey[..].pdf [80 KiB] HiDef png [383 KiB] Thumbnail [334 KiB] *.C file |
|
|
Threey[..].pdf [80 KiB] HiDef png [382 KiB] Thumbnail [338 KiB] *.C file |
|
|
|
Animated gif made out of all figures. |
PAPER-2021-002.gif Thumbnail |

|
![HiDef png [26 KiB]](Directory_LHCb-PAPER-2021-002/hidef_Omgbc2LcPi_Feyn.png)
![HiDef png [23 KiB]](Directory_LHCb-PAPER-2021-002/hidef_Omgbc2XicPi_Feyn.png)
![HiDef png [23 KiB]](Directory_LHCb-PAPER-2021-002/hidef_Xibc2LcPi_Feyn.png)
![HiDef png [21 KiB]](Directory_LHCb-PAPER-2021-002/hidef_Xibc2XicPi_Feyn.png)
![HiDef png [166 KiB]](Directory_LHCb-PAPER-2021-002/hidef_Threeyears_Lcpi_unblind_mass.png)
![HiDef png [164 KiB]](Directory_LHCb-PAPER-2021-002/hidef_Threeyears_Xicpi_unblind_mass.png)
![HiDef png [237 KiB]](Directory_LHCb-PAPER-2021-002/hidef_massfit_Lcpi_run2.png)
![HiDef png [266 KiB]](Directory_LHCb-PAPER-2021-002/hidef_massfit_Xicpi_run2.png)
![HiDef png [383 KiB]](Directory_LHCb-PAPER-2021-002/hidef_Threeyears_Lcpi_cls_lifetime.png)
![HiDef png [382 KiB]](Directory_LHCb-PAPER-2021-002/hidef_Threeyears_Xicpi_cls_lifetime.png)
Tables and captions
|
Sources of systematic uncertainty obtained for an $ H_{ b c }^{0}$ mass of 6900 $\text{ Me V /}c^2$ and lifetime of 0.4 $\text{ ps}$ . The total is the quadratic sum of the individual systematic uncertainties. |
Table_1.pdf [70 KiB] HiDef png [61 KiB] Thumbnail [28 KiB] tex code |

|
![HiDef png [61 KiB]](Directory_LHCb-PAPER-2021-002/hidef_Table_1.png)
Created on 19 April 2024.