Precise determination of the $B_{\mathrm{s}}^0$–$\overline B_{\mathrm{s}}^0$ oscillation frequency
[to restricted-access page]Information
LHCb-PAPER-2021-005
CERN-EP-2021-047
arXiv:2104.04421 [PDF]
(Submitted on 09 Apr 2021)
Nature Physics 18, (2022) 1-5
Inspire 1857623
Tools
Abstract
Mesons comprising a beauty quark and a strange quark can oscillate between particle (B0s) and antiparticle (B0s) flavour eigenstates, with a frequency given by the mass difference between heavy and light mass eigenstates, deltams. Here we present ameasurement of deltams using B0s2DsPi decays produced in proton-proton collisions collected with the LHCb detector at the Large Hadron Collider. The oscillation frequency is found to be deltams = 17.7683 +- 0.0051 +- 0.0032 ps-1, where the first uncertainty is statistical and the second systematic. This measurement improves upon the current deltams precision by a factor of two. We combine this result with previous LHCb measurements to determine deltams = 17.7656 +- 0.0057 ps-1, which is the legacy measurement of the original LHCb detector.
Figures and captions
|
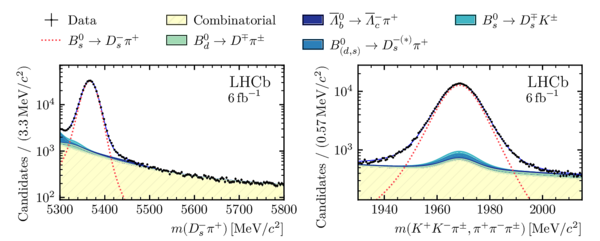
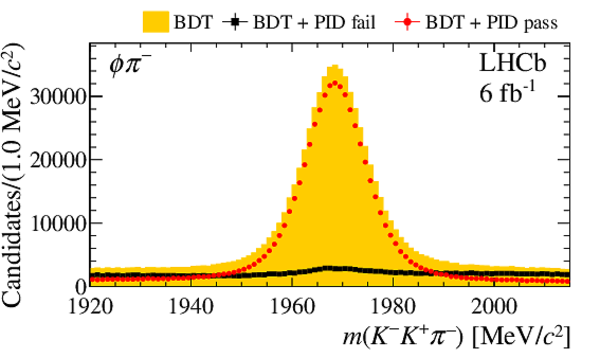
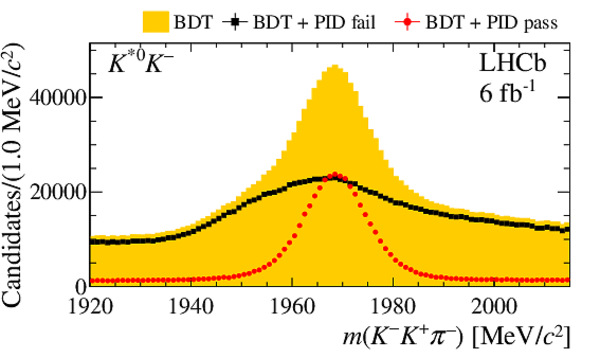
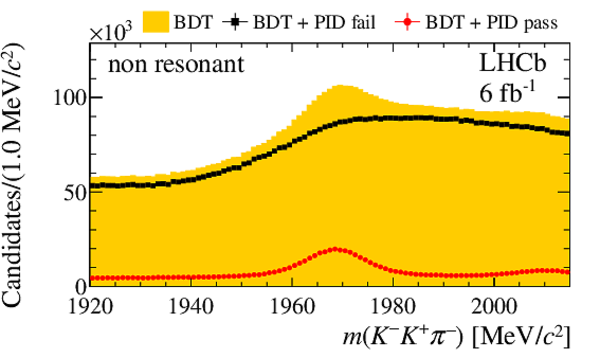
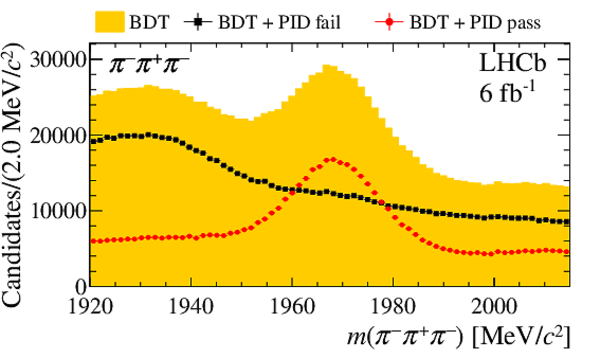
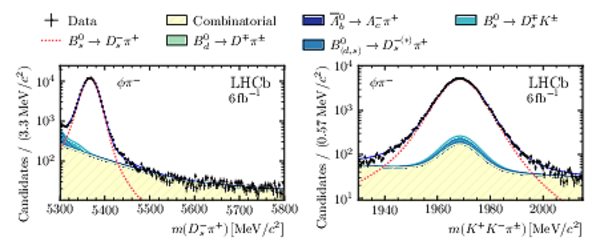
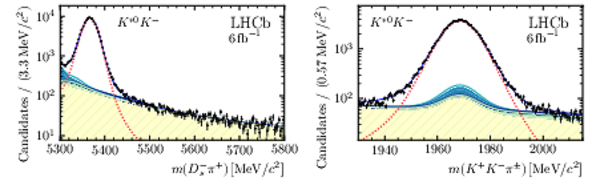
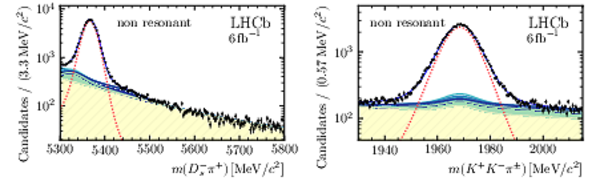
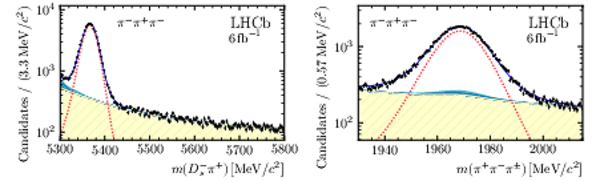
{\bf Invariant-mass distributions.} Distributions of the (left) $ D ^-_ s \pi ^+ $, and (right) $ K ^+ K ^- \pi ^\pm $ or $\pi ^+ \pi ^- \pi ^\pm $ invariant mass for the selected candidates, $m( D ^-_ s \pi ^+ )$ and $m( K ^+ K ^- \pi ^\pm ,\pi ^+ \pi ^- \pi ^\pm )$, respectively. The mass fit described in the text is overlaid. The different contributions are shown as coloured areas (for background) or by dashed lines (for signal). The vertical bars, typically visible only in regions with low numbers of candidates, correspond to the statistical uncertainty on the number of observed candidates in each bin. The horizontal bin width is indicated on the vertical axis legend. |
Fig1.pdf [176 KiB] HiDef png [318 KiB] Thumbnail [191 KiB] *.C file |
|
|
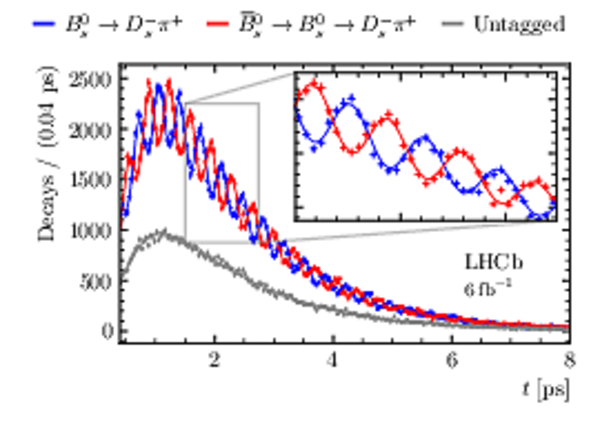
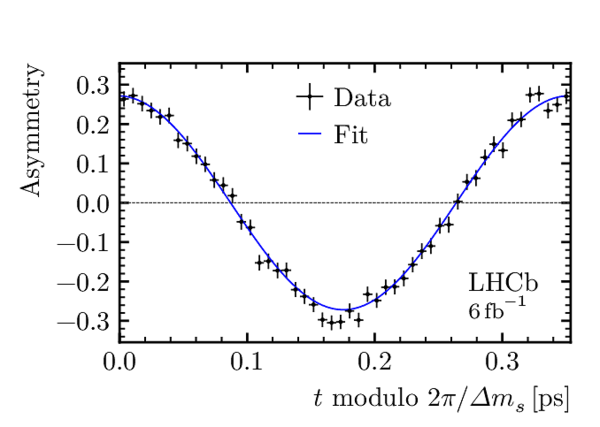
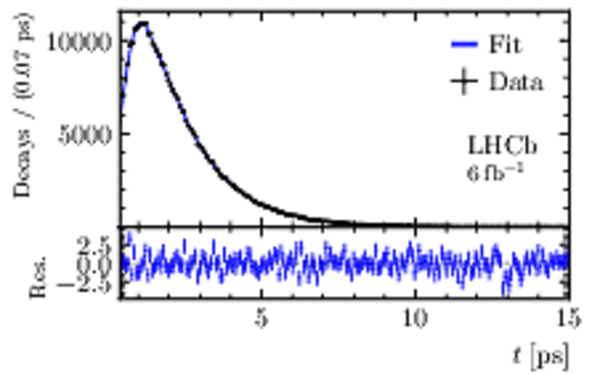
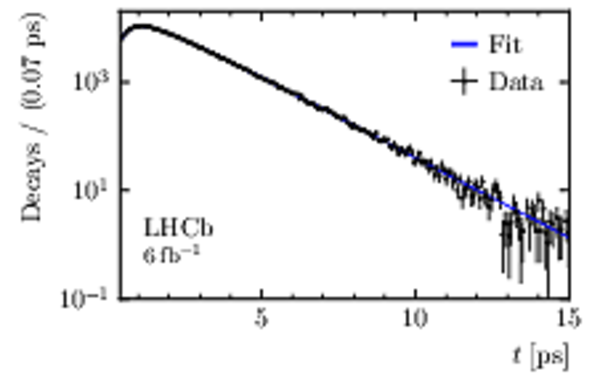
{\bf Decay-time distribution of the signal decays.} Distribution of the (left) decay time of the $ B^0_s \rightarrow D_s^- \pi^+$ signal decays and (right) decay-time asymmetry between mixed and unmixed signal decays. The vertical bars correspond to the statistical uncertainty on the number of observed candidates in each bin. The horizontal bars represent the bin width. In the left plot, the horizontal bin width is indicated on the vertical axis legend. The three components, unmixed, mixed and untagged, are shown in blue, red and gray, respectively. The insert corresponds to a zoom of the region delineated in grey. The fit described in the text is overlaid. |
Fig2a_[..].pdf [63 KiB] HiDef png [401 KiB] Thumbnail [342 KiB] *.C file |
|
|
Fig2b.pdf [14 KiB] HiDef png [166 KiB] Thumbnail [144 KiB] *.C file |
|
|
|
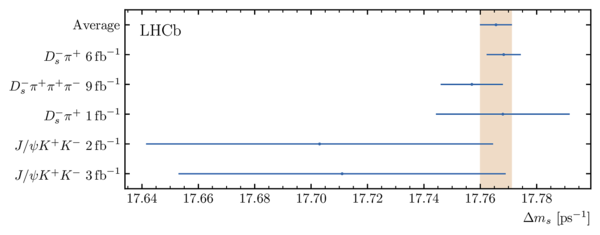
{\bf Summary of LHCb measurements.} Comparison of LHCb $\Delta m_{ s } $ measurements from Refs. [10,11,12,9], the result presented in this article and their average. The measurement described in this paper is labeled as $ D ^-_ s \pi^+$ 6 $\text{ fb} ^{-1}$ . The horizontal bars correspond to the total uncertainty reported for each measurement. The band indicates the size of the uncertainty on the average for comparison purposes. The combination procedure and inputs are described in the text. |
Fig3.pdf [185 KiB] HiDef png [74 KiB] Thumbnail [62 KiB] *.C file |
|
|
Animated gif made out of all figures. |
PAPER-2021-005.gif Thumbnail |

|
Tables and captions
|
{\bf Systematic uncertainties affecting the measurement of { $\Delta m_{ s }$ }.} Sources of systematic uncertainties are discussed in the text. Additional details are provided in the Methods section. The total systematic uncertainty is obtained by adding the contributions in quadrature. |
Table_1.pdf [70 KiB] HiDef png [90 KiB] Thumbnail [37 KiB] tex code |

|
Supplementary Material [file]


![HiDef png [318 KiB]](Directory_LHCb-PAPER-2021-005/hidef_Fig1.png)
![HiDef png [401 KiB]](Directory_LHCb-PAPER-2021-005/hidef_Fig2a_updated.png)
![HiDef png [166 KiB]](Directory_LHCb-PAPER-2021-005/hidef_Fig2b.png)
![HiDef png [74 KiB]](Directory_LHCb-PAPER-2021-005/hidef_Fig3.png)
![HiDef png [90 KiB]](Directory_LHCb-PAPER-2021-005/hidef_Table_1.png)
![HiDef png [270 KiB]](Directory_LHCb-PAPER-2021-005/supplementary/hidef_Fig10.png)
![HiDef png [349 KiB]](Directory_LHCb-PAPER-2021-005/supplementary/hidef_Fig11.png)
![HiDef png [111 KiB]](Directory_LHCb-PAPER-2021-005/supplementary/hidef_Fig12a.png)
![HiDef png [106 KiB]](Directory_LHCb-PAPER-2021-005/supplementary/hidef_Fig12b.png)
![HiDef png [275 KiB]](Directory_LHCb-PAPER-2021-005/supplementary/hidef_Fig13a.png)
![HiDef png [152 KiB]](Directory_LHCb-PAPER-2021-005/supplementary/hidef_Fig13b.png)
![HiDef png [193 KiB]](Directory_LHCb-PAPER-2021-005/supplementary/hidef_Fig4a.png)
![HiDef png [196 KiB]](Directory_LHCb-PAPER-2021-005/supplementary/hidef_Fig4b.png)
![HiDef png [195 KiB]](Directory_LHCb-PAPER-2021-005/supplementary/hidef_Fig4c.png)
![HiDef png [209 KiB]](Directory_LHCb-PAPER-2021-005/supplementary/hidef_Fig4d.png)
![HiDef png [363 KiB]](Directory_LHCb-PAPER-2021-005/supplementary/hidef_Fig5a.png)
![HiDef png [340 KiB]](Directory_LHCb-PAPER-2021-005/supplementary/hidef_Fig5b.png)
![HiDef png [347 KiB]](Directory_LHCb-PAPER-2021-005/supplementary/hidef_Fig5c.png)
![HiDef png [305 KiB]](Directory_LHCb-PAPER-2021-005/supplementary/hidef_Fig5d.png)
![HiDef png [112 KiB]](Directory_LHCb-PAPER-2021-005/supplementary/hidef_Fig6a.png)
![HiDef png [106 KiB]](Directory_LHCb-PAPER-2021-005/supplementary/hidef_Fig6b.png)
![HiDef png [374 KiB]](Directory_LHCb-PAPER-2021-005/supplementary/hidef_Fig7a.png)
![HiDef png [345 KiB]](Directory_LHCb-PAPER-2021-005/supplementary/hidef_Fig7b.png)
![HiDef png [356 KiB]](Directory_LHCb-PAPER-2021-005/supplementary/hidef_Fig7c.png)
![HiDef png [339 KiB]](Directory_LHCb-PAPER-2021-005/supplementary/hidef_Fig7d.png)
![HiDef png [358 KiB]](Directory_LHCb-PAPER-2021-005/supplementary/hidef_Fig7e.png)
![HiDef png [342 KiB]](Directory_LHCb-PAPER-2021-005/supplementary/hidef_Fig7f.png)
![HiDef png [384 KiB]](Directory_LHCb-PAPER-2021-005/supplementary/hidef_Fig8a.png)
![HiDef png [375 KiB]](Directory_LHCb-PAPER-2021-005/supplementary/hidef_Fig8b.png)
![HiDef png [380 KiB]](Directory_LHCb-PAPER-2021-005/supplementary/hidef_Fig8c.png)
![HiDef png [74 KiB]](Directory_LHCb-PAPER-2021-005/supplementary/hidef_Fig9a.png)
![HiDef png [68 KiB]](Directory_LHCb-PAPER-2021-005/supplementary/hidef_Fig9b.png)
Created on 26 April 2024.