Observation of the Mass Difference Between Neutral Charm-Meson Eigenstates
[to restricted-access page]Information
LHCb-PAPER-2021-009
CERN-EP-2021-099
arXiv:2106.03744 [PDF]
(Submitted on 07 Jun 2021)
Phys. Rev. Lett. 127, (2021) 111801
Inspire 1867376
Tools
Abstract
A measurement of mixing and $C P$ violation in neutral charm mesons is performed using data reconstructed in proton-proton collisions collected by the LHCb experiment from 2016 to 2018, corresponding to an integrated luminosity of 5.4$\textrm{fb}^{-1}$. A total of $30.6$ million $D^{0}\rightarrow K^{0}_{\mathrm{S}}\pi^{+}\pi^{-}$ decays are analyzed using a method optimized for the measurement of the mass difference between neutral charm-meson eigenstates. Allowing for $C P$ violation in mixing and in the interference between mixing and decay, the mass and decay-width differences are measured to be $x_{C P} = \left[3.97\pm0.46\textrm{(stat)}\pm 0.29\textrm{(syst)}\right]\times10^{-3}$ and $y_{C P} = \left[4.59\pm1.20\textrm{(stat)}\pm0.85\textrm{(syst)}\right]\times10^{-3}$, respectively. The $C P$-violating parameters are measured as $\Delta x = \left[-0.27\pm0.18\textrm{(stat)}\pm0.01\textrm{(syst)}\right]\times10^{-3}$ and $\Delta y = \left[0.20\pm0.36\textrm{(stat)}\pm0.13\textrm{(syst)}\right]\times10^{-3}$. This is the first observation of a nonzero mass difference in the $D^0$ meson system, with a significance exceeding seven standard deviations. The data are consistent with $C P$ symmetry, and improve existing constraints on the associated parameters.
Figures and captions
|
Depiction of the interference of mixing and decay if a $ D ^0 $ and a $\overline{ D } {}^0 $ meson decay to a common final state $f$. |
Fig1.pdf [3 KiB] HiDef png [27 KiB] Thumbnail [15 KiB] *.C file |

|
|
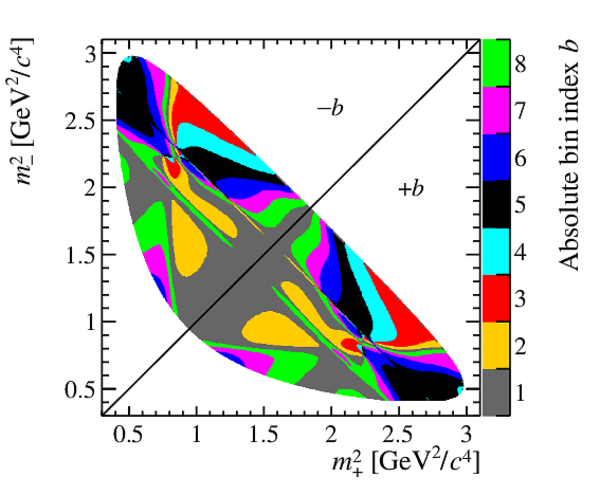
"Binning" of the $ D ^0 \rightarrow K ^0_{\mathrm{S}} \pi ^+ \pi ^- $ Dalitz plot. Colors indicate the absolute value of the bin index $b$. |
Fig2.pdf [405 KiB] HiDef png [379 KiB] Thumbnail [260 KiB] *.C file |
|
|
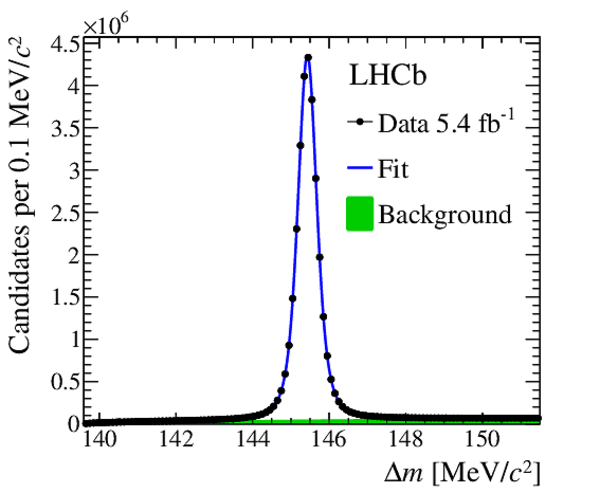
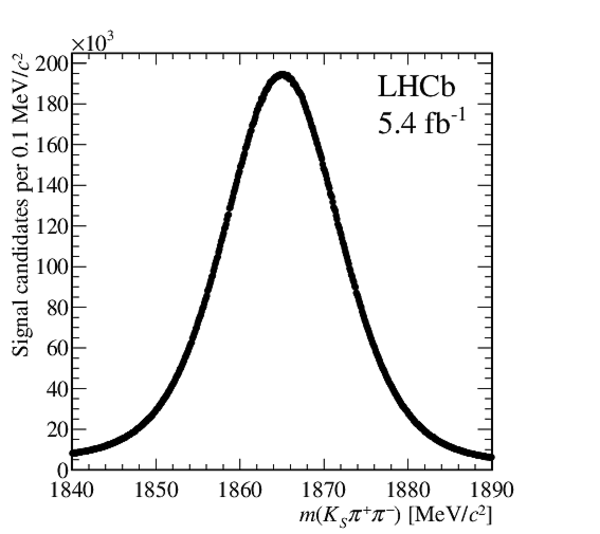
Distribution of $\Delta m $ for the selected $ D ^{*+} \rightarrow D ^0 (\rightarrow K ^0_{\mathrm{S}} \pi ^+ \pi ^- )\pi ^+ $ candidates. The projection of the fit result is superimposed. |
Fig3.pdf [41 KiB] HiDef png [184 KiB] Thumbnail [170 KiB] *.C file |
|
|
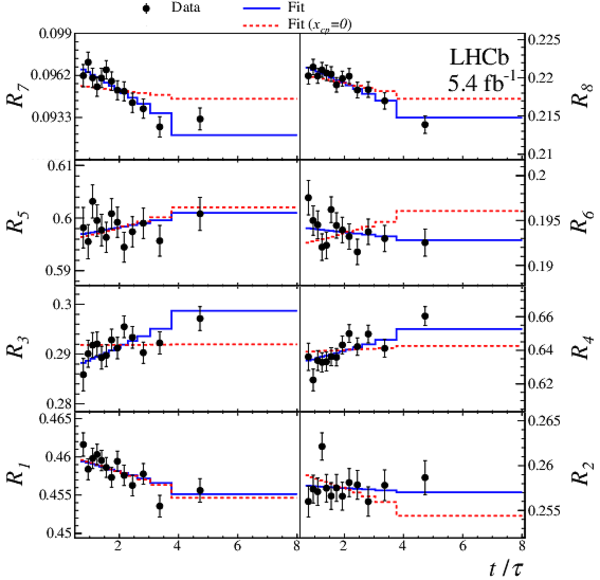
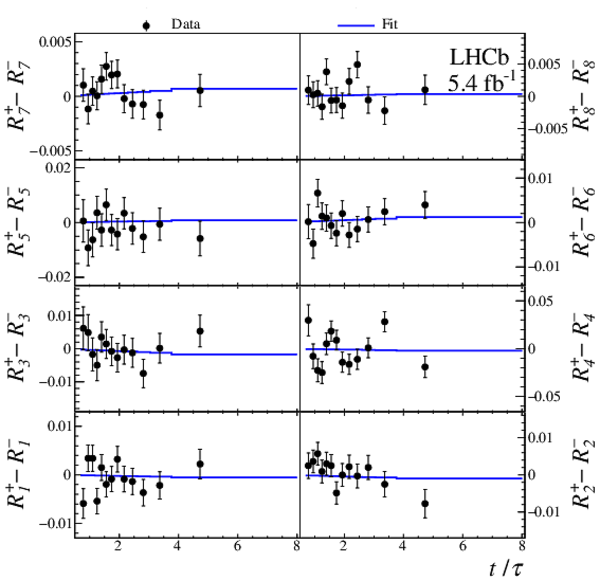
(Top) $ C P$ -averaged yield ratios and (bottom) differences of $ D ^0$ and $\overline{ D } {}^0$ yield ratios as a function of $t/\tau$, shown for each Dalitz-plot bin with fit projections overlaid. |
Fig4a.pdf [27 KiB] HiDef png [301 KiB] Thumbnail [281 KiB] *.C file |
|
|
Fig4b.pdf [25 KiB] HiDef png [252 KiB] Thumbnail [256 KiB] *.C file |
|
|
|
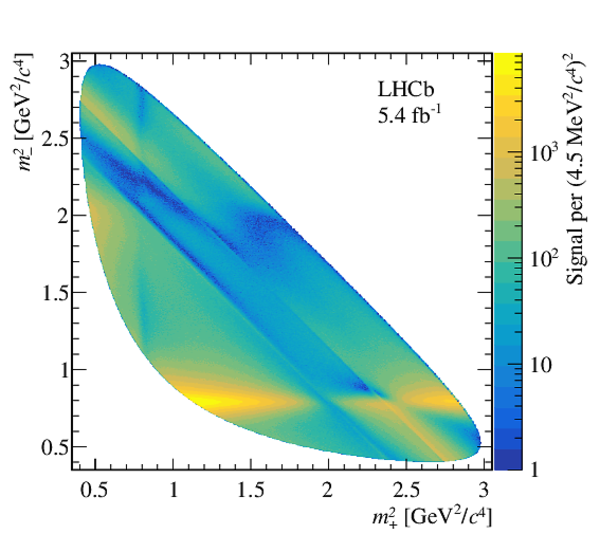
Dalitz plot of background-subtracted $ D ^0 \rightarrow K ^0_{\mathrm{S}} \pi ^+ \pi ^- $ candidates. |
Fig5.pdf [1 MiB] HiDef png [1 MiB] Thumbnail [539 KiB] *.C file |
|
|
Animated gif made out of all figures. |
PAPER-2021-009.gif Thumbnail |

|
Tables and captions
|
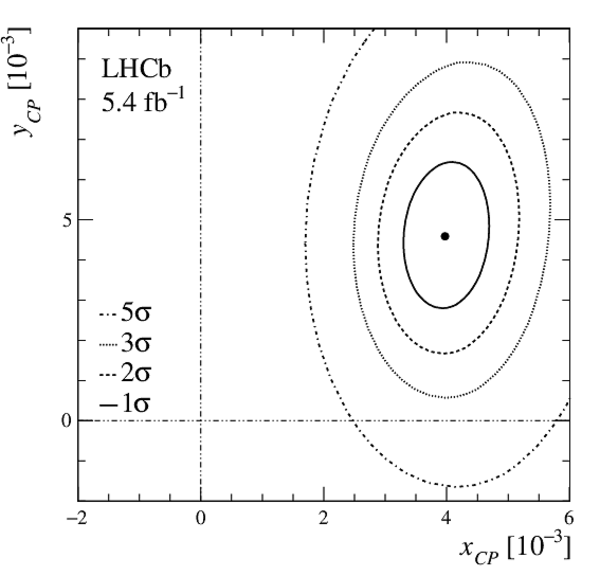
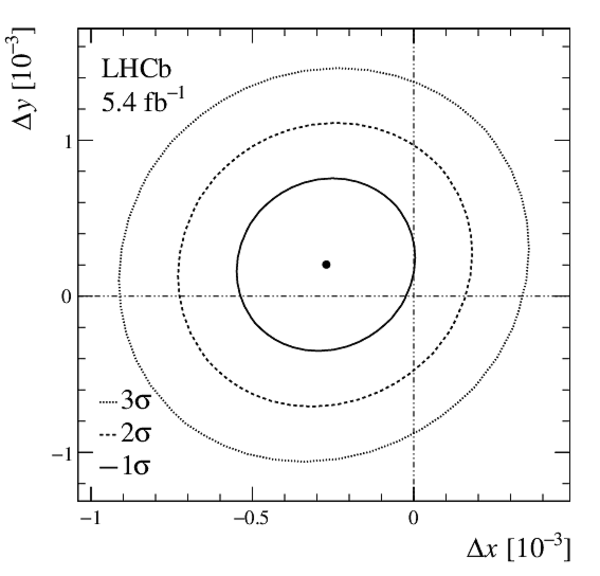
Fit results of $ x_{ C P }$ , $ y_{ C P }$ , $\Delta x$ , and $\Delta y$ . The first contribution to the uncertainty is statistical, the second systematic. |
Table_1.pdf [68 KiB] HiDef png [43 KiB] Thumbnail [19 KiB] tex code |

|
|
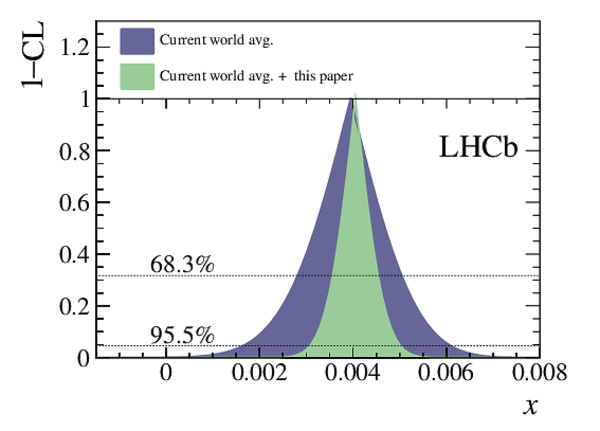
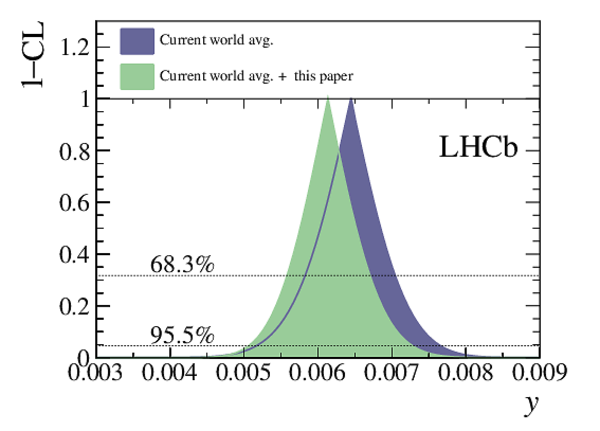
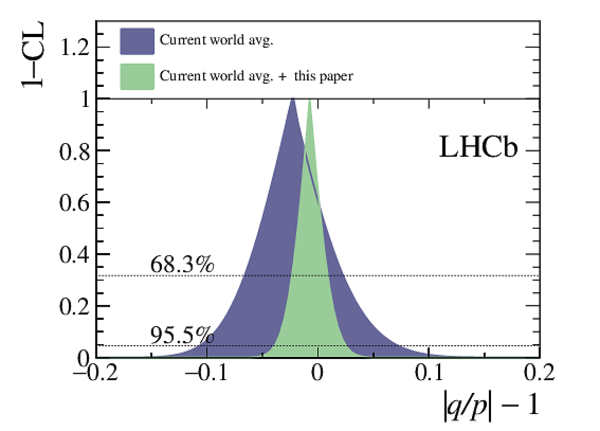
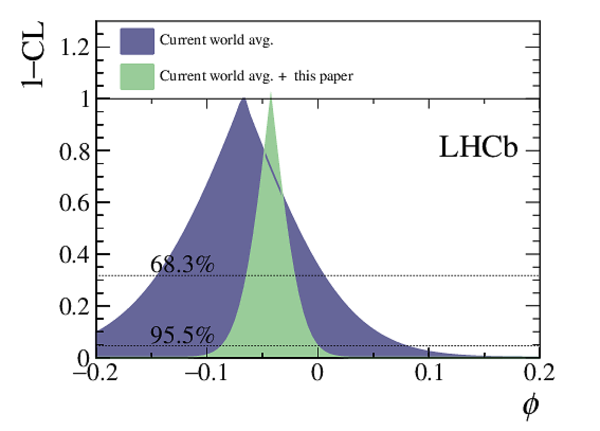
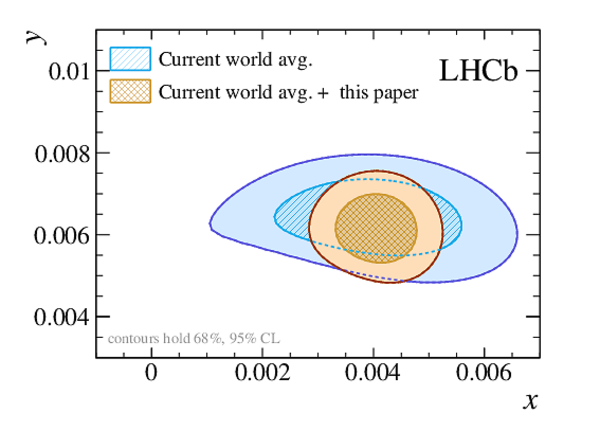
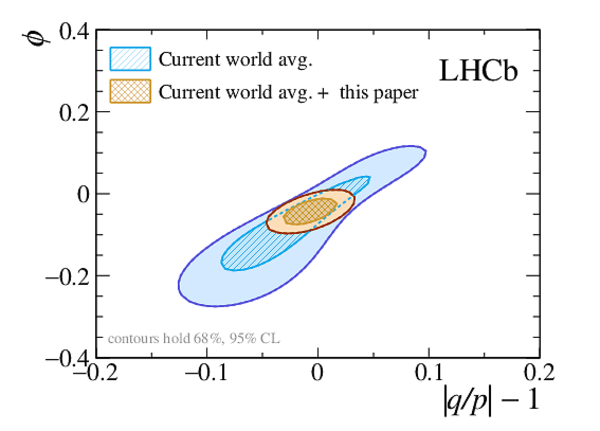
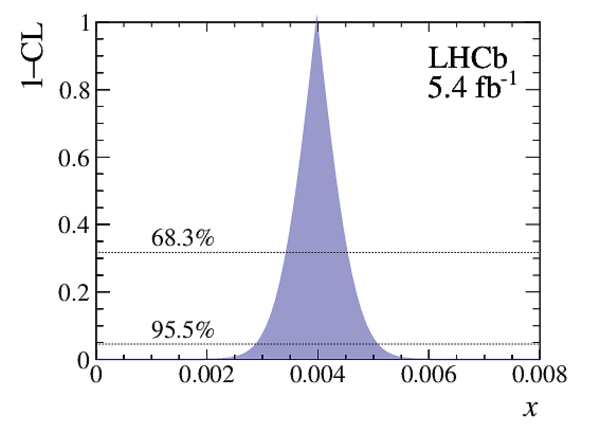
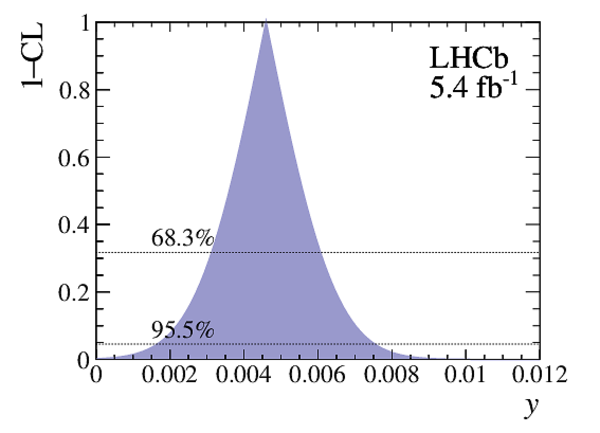
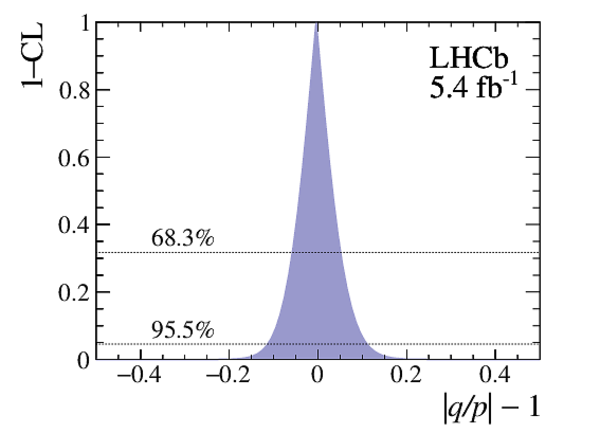
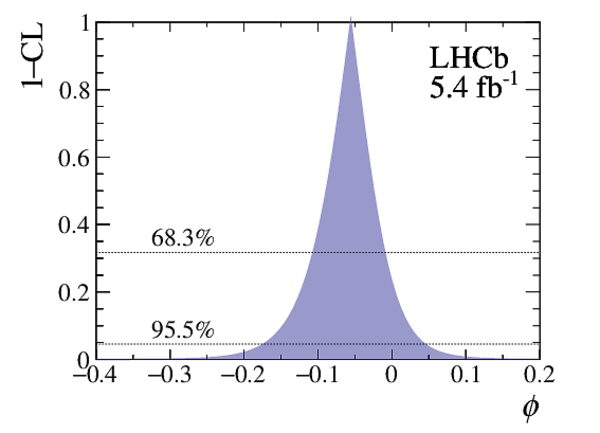
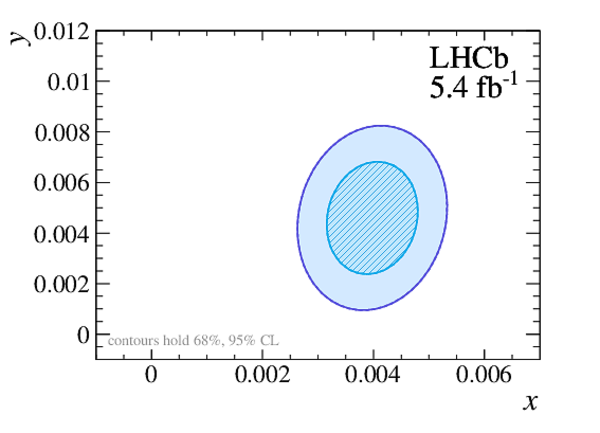
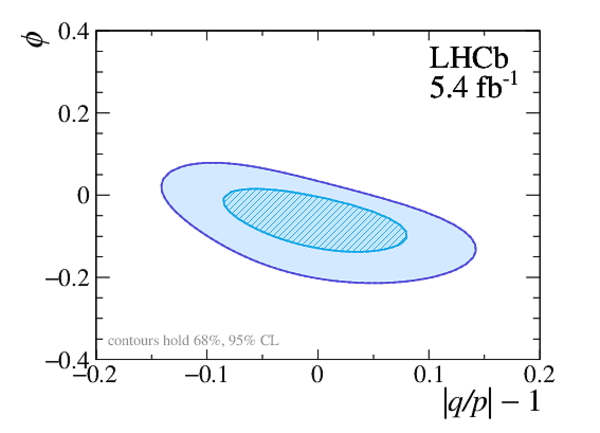
Point estimates and 95.5% confidence-level (CL) intervals for $x$, $y$, $|q/p|$ and $\phi$. The uncertainties include statistical and systematic contributions. |
Table_2.pdf [69 KiB] HiDef png [56 KiB] Thumbnail [27 KiB] tex code |

|
|
Uncertainties in units of $10^{-3}$. The total systematic uncertainty is the sum in quadrature of the individual components. The uncertainties due to the external inputs and detection asymmetry calibration samples are included in the statistical uncertainty. These are also reported separately, along with the contributions due to the limited sample size, to ease comparison with other sources. |
Table_3.pdf [49 KiB] HiDef png [125 KiB] Thumbnail [57 KiB] tex code |

|
Supplementary Material [file]
![HiDef png [27 KiB]](Directory_LHCb-PAPER-2021-009/hidef_Fig1.png)
![HiDef png [379 KiB]](Directory_LHCb-PAPER-2021-009/hidef_Fig2.png)
![HiDef png [184 KiB]](Directory_LHCb-PAPER-2021-009/hidef_Fig3.png)
![HiDef png [301 KiB]](Directory_LHCb-PAPER-2021-009/hidef_Fig4a.png)
![HiDef png [252 KiB]](Directory_LHCb-PAPER-2021-009/hidef_Fig4b.png)
![HiDef png [1 MiB]](Directory_LHCb-PAPER-2021-009/hidef_Fig5.png)
![HiDef png [43 KiB]](Directory_LHCb-PAPER-2021-009/hidef_Table_1.png)
![HiDef png [56 KiB]](Directory_LHCb-PAPER-2021-009/hidef_Table_2.png)
![HiDef png [125 KiB]](Directory_LHCb-PAPER-2021-009/hidef_Table_3.png)
![HiDef png [369 KiB]](Directory_LHCb-PAPER-2021-009/supplementary/hidef_Fig10.png)
![HiDef png [92 KiB]](Directory_LHCb-PAPER-2021-009/supplementary/hidef_Fig11.png)
![HiDef png [533 KiB]](Directory_LHCb-PAPER-2021-009/supplementary/hidef_Fig12.png)
![HiDef png [205 KiB]](Directory_LHCb-PAPER-2021-009/supplementary/hidef_Fig13a.png)
![HiDef png [226 KiB]](Directory_LHCb-PAPER-2021-009/supplementary/hidef_Fig13b.png)
![HiDef png [194 KiB]](Directory_LHCb-PAPER-2021-009/supplementary/hidef_Fig13c.png)
![HiDef png [215 KiB]](Directory_LHCb-PAPER-2021-009/supplementary/hidef_Fig13d.png)
![HiDef png [368 KiB]](Directory_LHCb-PAPER-2021-009/supplementary/hidef_Fig13e.png)
![HiDef png [268 KiB]](Directory_LHCb-PAPER-2021-009/supplementary/hidef_Fig13f.png)
![HiDef png [142 KiB]](Directory_LHCb-PAPER-2021-009/supplementary/hidef_Fig14a.png)
![HiDef png [150 KiB]](Directory_LHCb-PAPER-2021-009/supplementary/hidef_Fig14b.png)
![HiDef png [137 KiB]](Directory_LHCb-PAPER-2021-009/supplementary/hidef_Fig5.png)
![HiDef png [233 KiB]](Directory_LHCb-PAPER-2021-009/supplementary/hidef_Fig6.png)
![HiDef png [117 KiB]](Directory_LHCb-PAPER-2021-009/supplementary/hidef_Fig7a.png)
![HiDef png [121 KiB]](Directory_LHCb-PAPER-2021-009/supplementary/hidef_Fig7b.png)
![HiDef png [153 KiB]](Directory_LHCb-PAPER-2021-009/supplementary/hidef_Fig8a.png)
![HiDef png [177 KiB]](Directory_LHCb-PAPER-2021-009/supplementary/hidef_Fig8b.png)
![HiDef png [145 KiB]](Directory_LHCb-PAPER-2021-009/supplementary/hidef_Fig8c.png)
![HiDef png [151 KiB]](Directory_LHCb-PAPER-2021-009/supplementary/hidef_Fig8d.png)
![HiDef png [259 KiB]](Directory_LHCb-PAPER-2021-009/supplementary/hidef_Fig9a.png)
![HiDef png [244 KiB]](Directory_LHCb-PAPER-2021-009/supplementary/hidef_Fig9b.png)
![HiDef png [458 KiB]](Directory_LHCb-PAPER-2021-009/supplementary/hidef_LHCb-PAPER-2021-009-supplementary.png)
Created on 20 April 2024.