Observation of excited $\Omega_c^0$ baryons in $\Omega_b^- \to \Xi_c^+ K^-\pi^-$decays
[to restricted-access page]Information
LHCb-PAPER-2021-012
CERN-EP-2021-109
arXiv:2107.03419 [PDF]
(Submitted on 07 Jul 2021)
Phys. Rev. D 104 (2021) L091102
Inspire 1879440
Tools
Abstract
The first observation of the $\Omega_b^- \to \Xi_c^+ K^- \pi^-$ decay is reported using $pp$ collision data at centre-of-mass energies of 7, 8 and 13 $\mathrm{TeV}$ collected by the LHCb experiment, corresponding to an integrated luminosity of 9 $\mathrm{fb}^{-1}$. Four excited $\Omega_c^0$ baryons are observed in the $\Xi_c^+ K^-$ mass projection of the $\Omega_b^- \to \Xi_c^+ K^- \pi^-$ decays with the significance of each exceeding five standard deviations. They coincide with the states previously observed in prompt \proton\proton and $e^+e^-$ production. Relative production rates, masses and natural widths of the states are measured, and a test of spin hypotheses is performed. Moreover, the branching ratio of $\Omega_b^- \to \Xi_c^+ K^- \pi^-$ is measured relative to the $\Omega_b^- \to \Omega_c^0 \pi^-$ decay mode and a precise measurement of the $\Omega_b^-$ mass of $6044.3 \pm 1.2 \pm 1.1^{ +0.19}_{ -0.22} \mathrm{MeV}$ is obtained.
Figures and captions
|
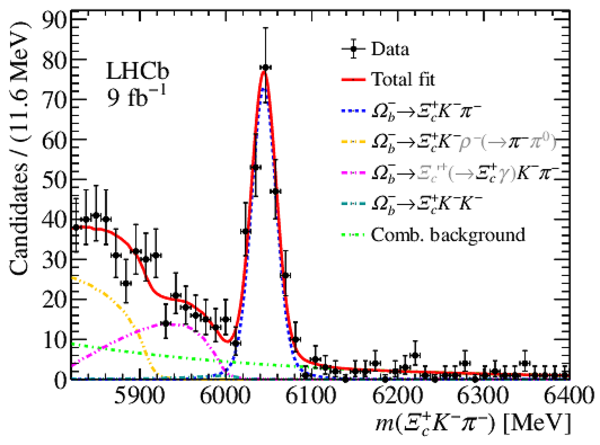
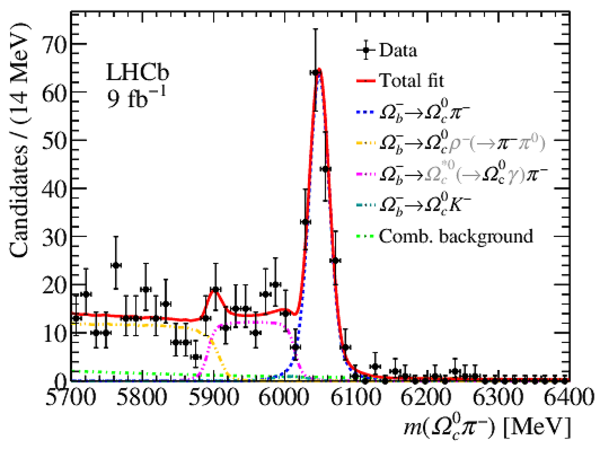
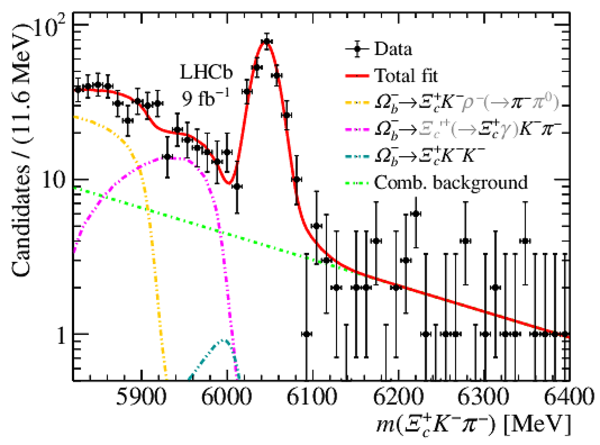
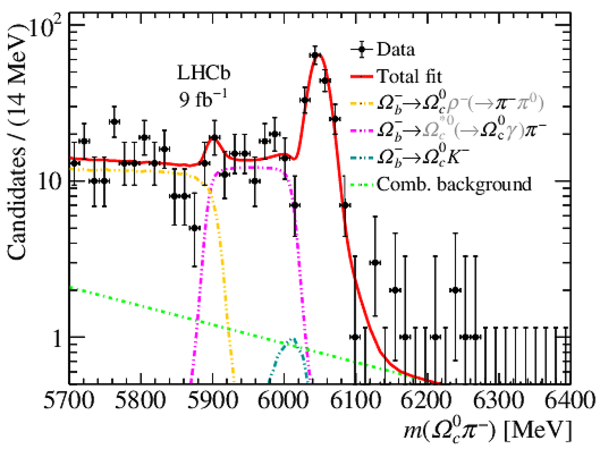
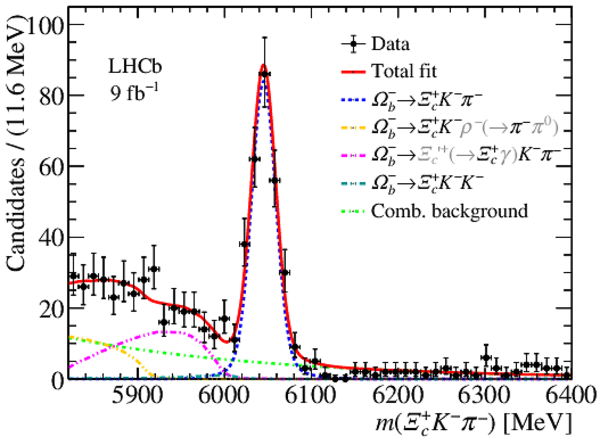
Distribution of the reconstructed invariant mass (left) $m(\Xi ^+_ c K ^- \pi ^- )$ with $\Xi ^+_ c \rightarrow p K ^- \pi ^+ $ and (right) $m(\Omega ^0_ c \pi ^- )$ with $\Omega ^0_ c \rightarrow p K ^- K ^- \pi ^+ $ for all candidates passing the selection requirements. The black symbols show the data. The result of a fit is overlaid (solid red line). The missing particles in partially reconstructed decays are indicated in grey in the legends. |
Fig1a.pdf [25 KiB] HiDef png [355 KiB] Thumbnail [294 KiB] *.C file |
|
|
Fig1b.pdf [29 KiB] HiDef png [337 KiB] Thumbnail [282 KiB] *.C file |
|
|
|
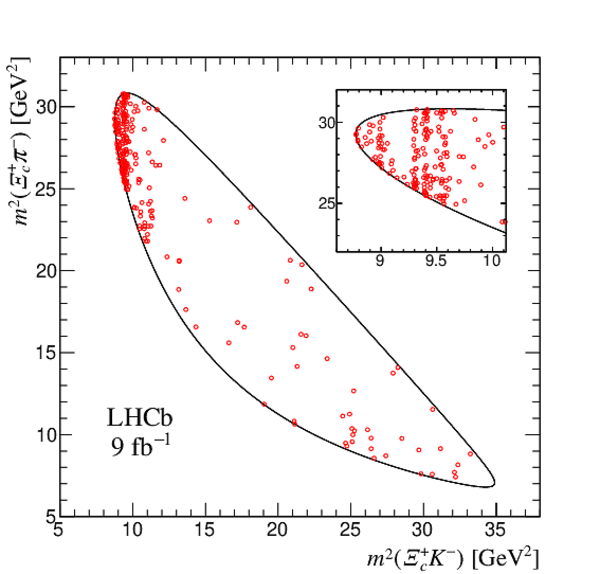
Dalitz plot distribution of $\Omega ^-_ b \rightarrow \Xi ^+_ c K ^- \pi ^- $ candidates in the signal region, including background contributions. The inset shows an expanded view of the upper left corner where the vertical bands correspond to excited $\Omega ^0_ c $ states. |
Fig2.pdf [104 KiB] HiDef png [283 KiB] Thumbnail [201 KiB] *.C file |
|
|
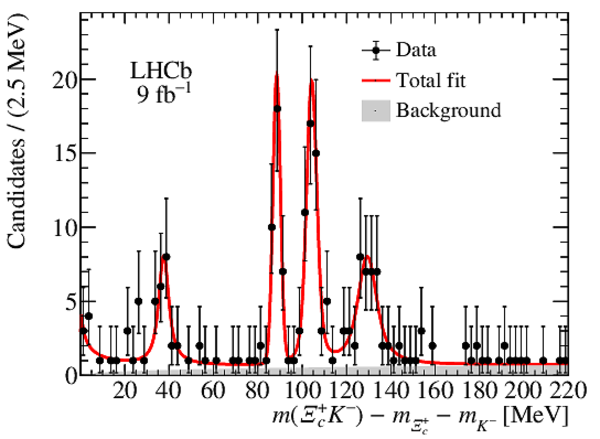
Distribution of the reconstructed mass difference between the $\Xi ^+_ c $ $ K ^-$ invariant mass and the $\Xi ^+_ c $ and $ K ^-$ masses. The four peaking structures are consistent with being the previously observed $\Omega_{ c }(3000)^{0}$ , $\Omega_{ c }(3050)^{0}$ , $\Omega_{ c }(3065)^{0}$ and $\Omega_{ c }(3090)^{0}$ baryons. The distribution shows an enhancement at the threshold, as seen in the previous analysis \cite{LHCb-PAPER-2017-002}. The total fit is overlaid in red. The background distribution (grey shaded area) is the combination of the combinatorial and nonresonant $\Xi ^+_ c $ $ K ^-$ backgrounds. |
Fig3.pdf [29 KiB] HiDef png [275 KiB] Thumbnail [224 KiB] *.C file |
|
|
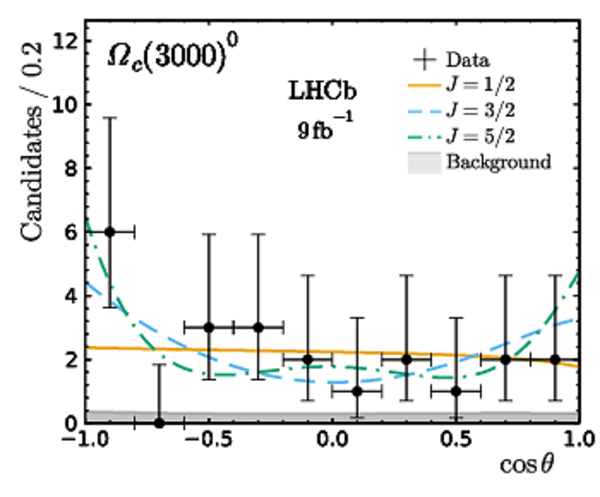
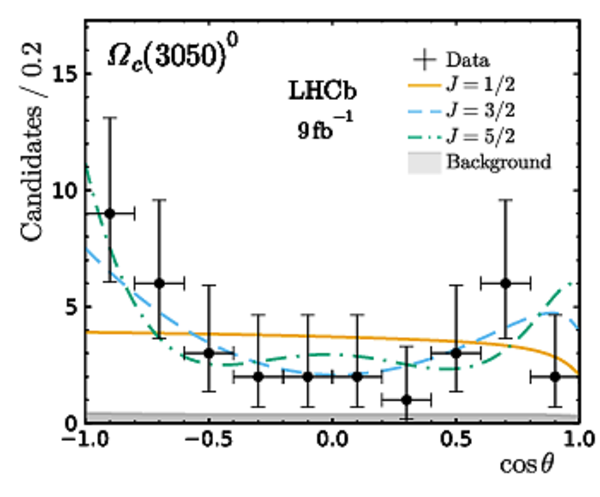
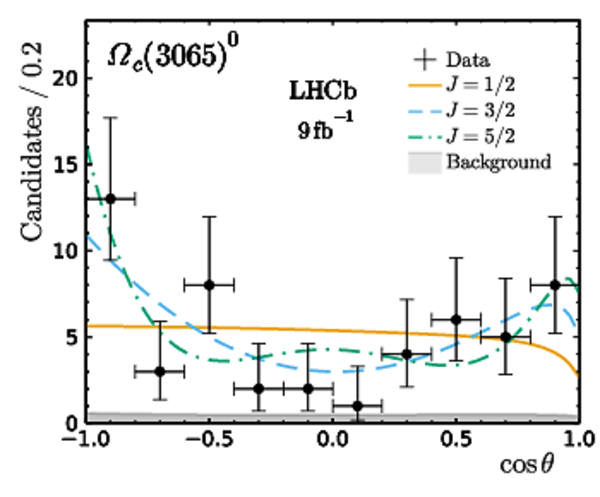
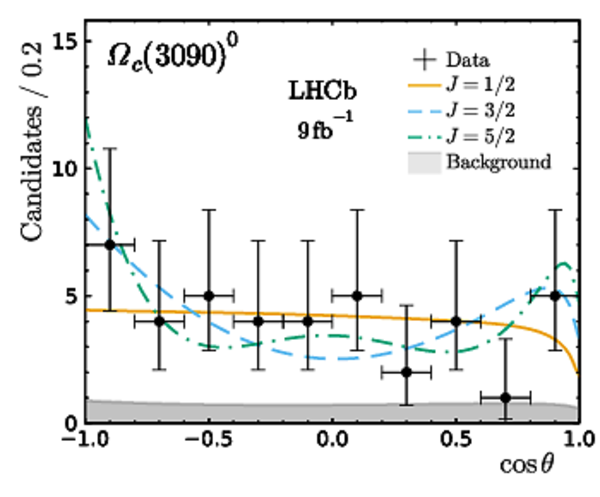
Distributions of the $\Omega_ c ^{**0}$ helicity angle ($\theta$) in the $\Omega ^-_ b $ decay. Solid, dashed and dot-dashed lines indicate the expectations under the spin hypotheses, $J=1/2$, $3/2$, and $5/2$, respectively. The grey shaded area shows the cumulative distribution of the combinatorial and nonresonant $\Xi ^+_ c $ $ K ^-$ backgrounds. |
Fig4a.pdf [29 KiB] HiDef png [234 KiB] Thumbnail [257 KiB] *.C file |
|
|
Fig4b.pdf [27 KiB] HiDef png [235 KiB] Thumbnail [245 KiB] *.C file |
|
|
|
Fig4c.pdf [28 KiB] HiDef png [241 KiB] Thumbnail [253 KiB] *.C file |
|
|
|
Fig4d.pdf [27 KiB] HiDef png [252 KiB] Thumbnail [254 KiB] *.C file |
|
|
|
Distribution of the reconstructed invariant mass (left) $m(\Xi ^+_ c K ^- \pi ^- )$ with $\Xi ^+_ c \rightarrow p K ^- \pi ^+ $ and (right) $m(\Omega ^0_ c \pi ^- )$ with $\Omega ^0_ c \rightarrow p K ^- K ^- \pi ^+ $ using a logarithmic scale for all candidates passing the selection requirements. The black symbols show the selected signal candidates. The result of a fit is overlaid (solid red line). The missing particles in partially reconstructed decays are indicated in grey in the legends. |
Fig5a.pdf [23 KiB] HiDef png [295 KiB] Thumbnail [255 KiB] *.C file |
|
|
Fig5b.pdf [23 KiB] HiDef png [293 KiB] Thumbnail [262 KiB] *.C file |
|
|
|
Distribution of the reconstructed invariant mass $m(\Xi ^+_ c K ^- \pi ^- )$ with $\Xi ^+_ c \rightarrow p K ^- \pi ^+ $, where the simulation used to train the BDT classifier has a requirement of $m(\Xi ^+_ c K ^- ) < 3.3\text{ Ge V} $. |
Fig6.pdf [24 KiB] HiDef png [334 KiB] Thumbnail [270 KiB] *.C file |
|
|
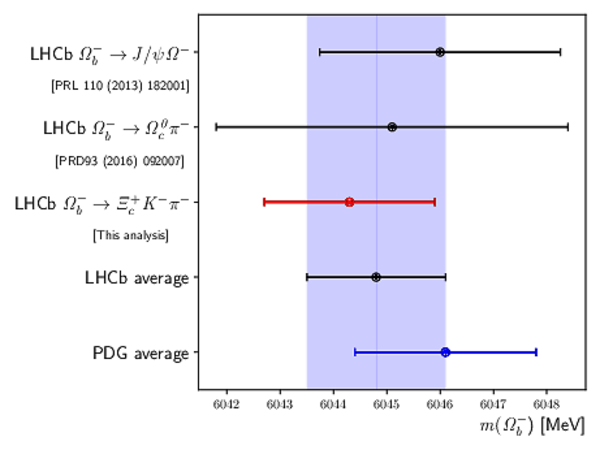
Measurements of the $\Omega ^-_ b $ mass from the LHCb experiment, the LHCb average and the PDG average, which includes the two previous LHCb measurements and one measurement from the CDF collaboration \cite{PDG2020}. |
Fig7.pdf [304 KiB] HiDef png [118 KiB] Thumbnail [112 KiB] *.C file |
|
|
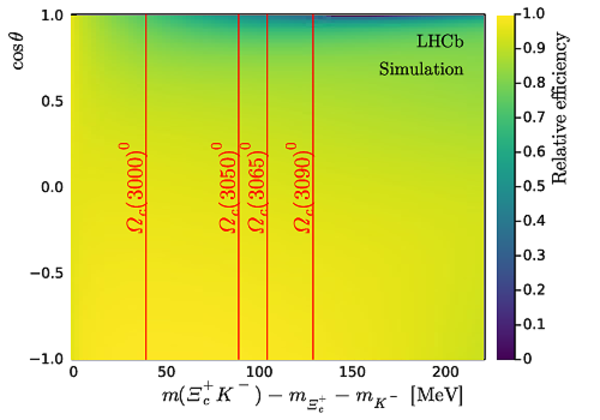
Efficiency map in the $[\Delta M, \cos\theta]$ plane. Positions of the four narrow $\Omega_ c ^{**0} $ states are shown by the red lines. |
Fig8.pdf [55 KiB] HiDef png [831 KiB] Thumbnail [435 KiB] *.C file |
|
|
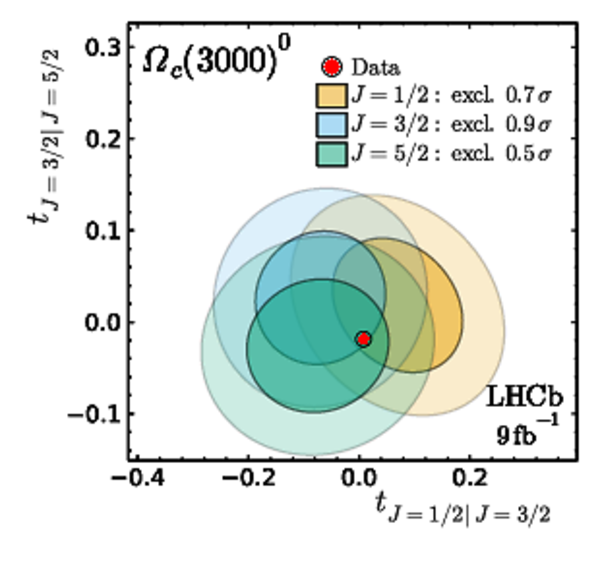
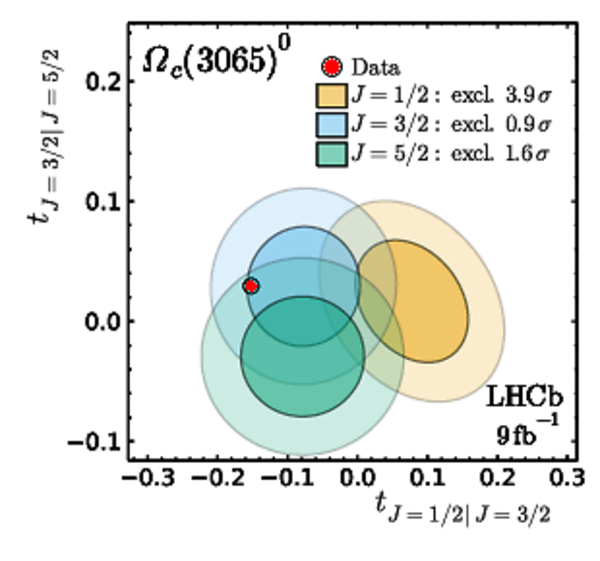
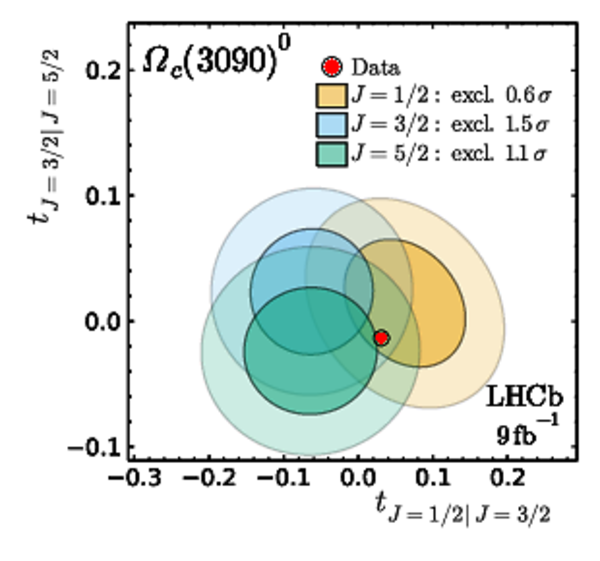
Values of the spin-hypothesis estimators $t_{J=1/2|J=3/2}$ and $t_{J=3/2|J=5/2}$. The red point shows the value measured in the default fit to the data. The colored ellipses give the $67 \%$ and $95 \%$ confidence intervals in the probability density for spin hypotheses with $J=1/2$, $3/2$, and $5/2$ as indicated in the legend. The rejection significance of every spin-$J$ hypothesis are shown in the legend for the default fit. The values with systematic studies included are summarised in the Table ??? of the main text. |
Fig9a.pdf [33 KiB] HiDef png [504 KiB] Thumbnail [388 KiB] *.C file |
|
|
Fig9b.pdf [34 KiB] HiDef png [495 KiB] Thumbnail [396 KiB] *.C file |

|
|
|
Fig9c.pdf [34 KiB] HiDef png [475 KiB] Thumbnail [389 KiB] *.C file |
|
|
|
Fig9d.pdf [33 KiB] HiDef png [489 KiB] Thumbnail [383 KiB] *.C file |
|
|
|
Animated gif made out of all figures. |
PAPER-2021-012.gif Thumbnail |

|
![HiDef png [355 KiB]](Directory_LHCb-PAPER-2021-012/hidef_Fig1a.png)
![HiDef png [337 KiB]](Directory_LHCb-PAPER-2021-012/hidef_Fig1b.png)
![HiDef png [283 KiB]](Directory_LHCb-PAPER-2021-012/hidef_Fig2.png)
![HiDef png [275 KiB]](Directory_LHCb-PAPER-2021-012/hidef_Fig3.png)
![HiDef png [234 KiB]](Directory_LHCb-PAPER-2021-012/hidef_Fig4a.png)
![HiDef png [235 KiB]](Directory_LHCb-PAPER-2021-012/hidef_Fig4b.png)
![HiDef png [241 KiB]](Directory_LHCb-PAPER-2021-012/hidef_Fig4c.png)
![HiDef png [252 KiB]](Directory_LHCb-PAPER-2021-012/hidef_Fig4d.png)
![HiDef png [295 KiB]](Directory_LHCb-PAPER-2021-012/hidef_Fig5a.png)
![HiDef png [293 KiB]](Directory_LHCb-PAPER-2021-012/hidef_Fig5b.png)
![HiDef png [334 KiB]](Directory_LHCb-PAPER-2021-012/hidef_Fig6.png)
![HiDef png [118 KiB]](Directory_LHCb-PAPER-2021-012/hidef_Fig7.png)
![HiDef png [831 KiB]](Directory_LHCb-PAPER-2021-012/hidef_Fig8.png)
![HiDef png [504 KiB]](Directory_LHCb-PAPER-2021-012/hidef_Fig9a.png)
![HiDef png [495 KiB]](Directory_LHCb-PAPER-2021-012/hidef_Fig9b.png)
![HiDef png [475 KiB]](Directory_LHCb-PAPER-2021-012/hidef_Fig9c.png)
![HiDef png [489 KiB]](Directory_LHCb-PAPER-2021-012/hidef_Fig9d.png)
Tables and captions
|
Results on the $\Omega ^-_ b $ mass, relative branching fraction of the $\Xi ^+_ c K ^- \pi ^- $ decay mode, measured mass differences ($\Delta M$), masses ($m$), natural widths ($\Gamma$) and production fraction ($\cal{P}$) of $\Omega_ c ^{**0}$ baryons where the first uncertainty is statistical and the second systematic. The third asymmetric uncertainty on the $\Omega ^-_ b $ and $\Omega_ c ^{**0}$ masses is due to the uncertainty in the $\Xi ^+_ c $ mass. Upper limits are given for the width of the $\Omega_{ c }(3050)^{0}$ state and the production rate of the $\Omega_{ c }(3120)^{0}$ baryon, which are measured to be consistent with zero. The results of the spin analysis are also listed ($J$ rejection). |
Table_1.pdf [73 KiB] HiDef png [178 KiB] Thumbnail [91 KiB] tex code |

|
|
Systematic uncertainties in the $\Omega ^-_ b $ mass, relative branching fraction $\mathcal{R}$ , and relative production rate $\mathcal{P}_{}$ of the $\Omega_ c ^{**0}$ states. |
Table_2.pdf [73 KiB] HiDef png [65 KiB] Thumbnail [31 KiB] tex code |

|
|
Systematic uncertainties in the resonance parameters of the $\Omega_ c ^{**0}$ states. For the width of the $\Omega_{ c }(3050)^{0}$ baryon, the systematic uncertainties are embedded in the upper limit. |
Table_3.pdf [66 KiB] HiDef png [60 KiB] Thumbnail [29 KiB] tex code |

|
![HiDef png [178 KiB]](Directory_LHCb-PAPER-2021-012/hidef_Table_1.png)
![HiDef png [65 KiB]](Directory_LHCb-PAPER-2021-012/hidef_Table_2.png)
![HiDef png [60 KiB]](Directory_LHCb-PAPER-2021-012/hidef_Table_3.png)
Created on 26 April 2024.