Information
LHCb-PAPER-2021-017
CERN-EP-2021-128
arXiv:2108.07678 [PDF]
(Submitted on 17 Aug 2021)
JHEP 01 (2022) 069
Inspire 1906173
Tools
Abstract
The first search for the rare radiative decay $\Xi_b^- \to \Xi^- \gamma$ is performed using data collected by the LHCb experiment in proton-proton collisions at a center-of-mass energy of 13 TeV, corresponding to an integrated luminosity of 5.4 fb$^{-1}$. The $\Xi_b- \to \Xi^- J/\psi$ channel is used as normalization. No $\Xi_b^- \to \Xi^- \gamma$ signal is found and an upper limit of $\mathcal{B}(\Xi_b^- \to \Xi^- \gamma) < 1.3 \times 10^{-4}$ at 95 confidence level is obtained.
Figures and captions
|
The $b \rightarrow s\gamma$ penguin diagram, mediated by SM particles (left) and BSM particles (right). |
[Failure to get the plot] | |
|
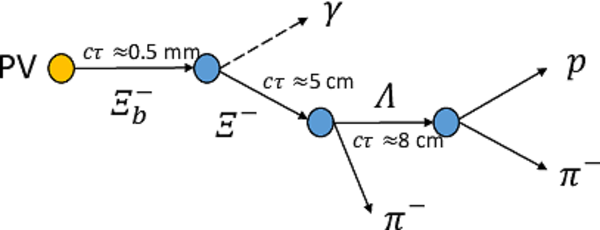
Topology of the $\Xi ^-_ b \rightarrow \Xi ^- \gamma $ decay, including three displaced vertices, with $c\tau$ of each particle given. |
Fig1.pdf [299 KiB] HiDef png [84 KiB] Thumbnail [84 KiB] *.C file |
|
|
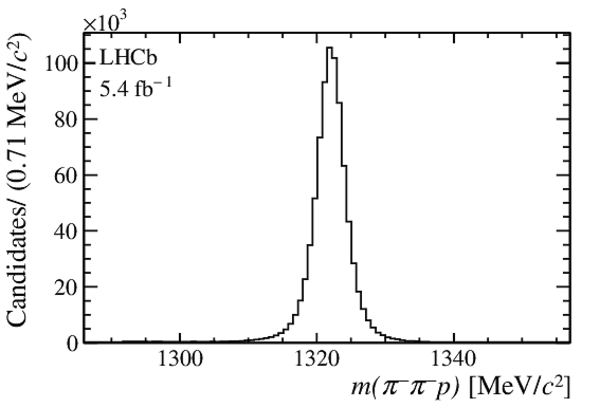
Mass distribution $m(\pi ^- \pi ^- p )$ showing the $\Xi ^- \rightarrow \Lambda \pi ^- $ signal for events satisfying the trigger and the offline requirements described in the text for $\Xi ^-_ b \rightarrow \Xi ^- \gamma $ decays. |
Fig2.eps [11 KiB] HiDef png [84 KiB] Thumbnail [47 KiB] *.C file |
|
|
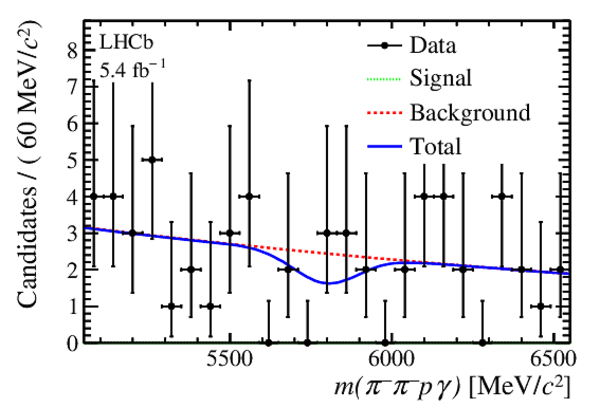
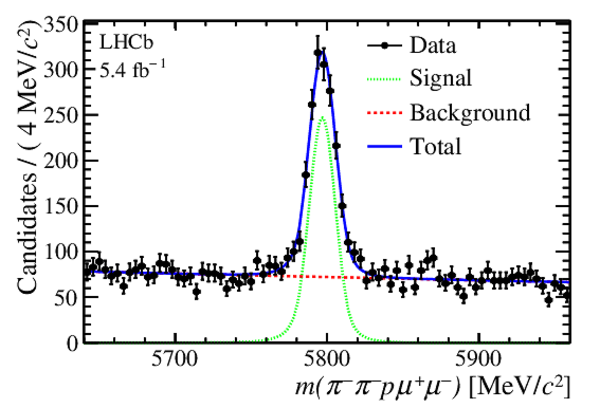
Distribution of (top) mass $m(\pi ^- \pi ^- p \gamma)$ for selected $\Xi ^-$ $\gamma $ ( $\Xi ^- \rightarrow \Lambda \pi ^- $ ) and (bottom) $m(\pi ^- \pi ^- p \mu ^+ \mu ^- )$ for selected $\Xi ^-$ $ { J \mskip -3mu/\mskip -2mu\psi }$ ( $ { J \mskip -3mu/\mskip -2mu\psi } \rightarrow \mu ^+ \mu ^- $ ) candidates. The projections of the simultaneous fit are overlaid. |
Fig3a.eps [23 KiB] HiDef png [218 KiB] Thumbnail [182 KiB] *.C file |
|
|
Fig3b.eps [40 KiB] HiDef png [254 KiB] Thumbnail [219 KiB] *.C file |
|
|
|
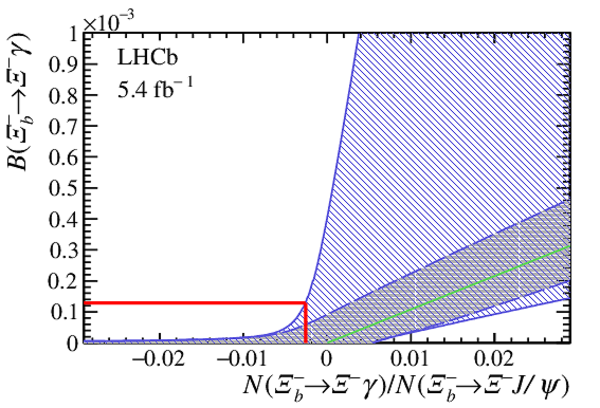
Confidence interval at 95% CL showing the upper limit for $\mathcal{B} (\Xi ^-_ b \rightarrow \Xi ^- \gamma )$ as a function of the $\frac{N(\Xi ^-_ b \rightarrow \Xi ^- \gamma )}{N(\Xi ^-_ b \rightarrow \Xi ^- { J \mskip -3mu/\mskip -2mu\psi } )}$ ratio. The green line represents the relation between the yield and the branching fractions. The interval considering only the statistical uncertainty is shown by the dashed blue lines, while the full blue lines also includes the systematic uncertainties. The measured ratio of the yields and the upper limit on the branching fraction are represented by the red line. |
Fig4.eps [28 KiB] HiDef png [896 KiB] Thumbnail [467 KiB] *.C file |
|
|
Animated gif made out of all figures. |
PAPER-2021-017.gif Thumbnail |

|
![HiDef png [84 KiB]](Directory_LHCb-PAPER-2021-017/hidef_Fig1.png)
![HiDef png [84 KiB]](Directory_LHCb-PAPER-2021-017/hidef_Fig2.png)
![HiDef png [218 KiB]](Directory_LHCb-PAPER-2021-017/hidef_Fig3a.png)
![HiDef png [254 KiB]](Directory_LHCb-PAPER-2021-017/hidef_Fig3b.png)
![HiDef png [896 KiB]](Directory_LHCb-PAPER-2021-017/hidef_Fig4.png)
Tables and captions
|
Input parameters used to compute the branching fraction $\mathcal{B} (\Xi ^-_ b \rightarrow \Xi ^- { J \mskip -3mu/\mskip -2mu\psi } )$. |
Table_1.pdf [82 KiB] HiDef png [43 KiB] Thumbnail [21 KiB] tex code |

|
|
Dominant systematic uncertainties on the measurement of the branching fraction $\mathcal{B}$ ( $\Xi ^-_ b \rightarrow \Xi ^- \gamma $ ). |
Table_2.pdf [63 KiB] HiDef png [85 KiB] Thumbnail [38 KiB] tex code |

|
![HiDef png [43 KiB]](Directory_LHCb-PAPER-2021-017/hidef_Table_1.png)
![HiDef png [85 KiB]](Directory_LHCb-PAPER-2021-017/hidef_Table_2.png)
Created on 27 April 2024.