Measurement of $J/\psi$ production cross-sections in $pp$ collisions at $\sqrt{s}=5$ TeV
[to restricted-access page]Information
LHCb-PAPER-2021-020
CERN-EP-2021-156
arXiv:2109.00220 [PDF]
(Submitted on 01 Sep 2021)
JHEP 11 (2021) 181
Inspire 1915030
Tools
Abstract
The production cross-sections of $J/\psi$ mesons in proton-proton collisions at a centre-of-mass energy of $\sqrt{s}=5$ TeV are measured using a data sample corresponding to an integrated luminosity of $9.13\pm0.18 \text{pb}^{-1}$, collected by the LHCb experiment. The cross-sections are measured differentially as a function of transverse momentum, $p_{\text{T}}$, and rapidity, $y$, and separately for $J/\psi$ mesons produced promptly and from beauty hadron decays (nonprompt). With the assumption of unpolarised $J/\psi$ mesons, the production cross-sections integrated over the kinematic range $0<p_{\text{T}}<20 \text{GeV}/c$ and $2.0<y<4.5$ are $8.154\pm0.010\pm0.283 \mu\text{b}$ for prompt $J/\psi$ mesons and $0.820\pm0.003\pm0.034 \mu\text{b}$ for nonprompt $J/\psi$ mesons, where the first uncertainties are statistical and the second systematic. These cross-sections are compared with those at $\sqrt{s}=8$ TeV and $13$ TeV, and are used to update the measurement of the nuclear modification factor in proton-lead collisions for $J/\psi$ mesons at a centre-of-mass energy per nucleon pair of $\sqrt{s_{\text{NN}}}=5$ TeV. The results are compared with theoretical predictions.
Figures and captions
|
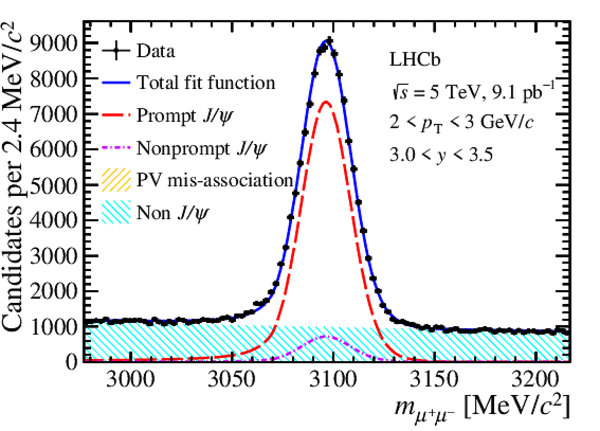
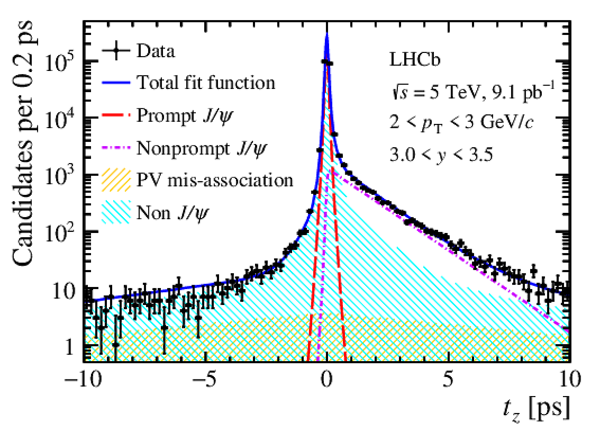
Distributions of (left) invariant mass and (right) pseudoproper time of the $ { J \mskip -3mu/\mskip -2mu\psi }$ candidate for an example interval corresponding to $2< p_{\mathrm{T}} <3\text{ Ge V /}c $ and $3.0<y<3.5$. Projections of the two-dimensional fit are also shown. |
Fig1a.pdf [34 KiB] HiDef png [386 KiB] Thumbnail [298 KiB] *.C file |
|
|
Fig1b.pdf [35 KiB] HiDef png [596 KiB] Thumbnail [370 KiB] *.C file |
|
|
|
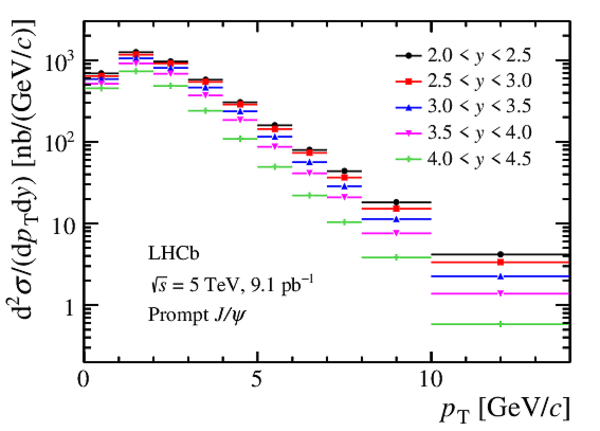
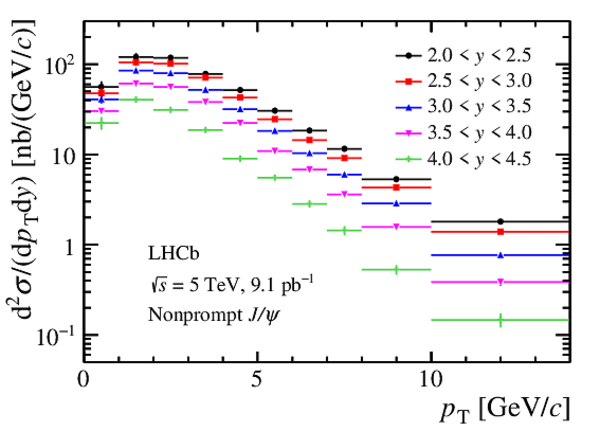
Differential cross-sections for (left) prompt and (right) nonprompt $ { J \mskip -3mu/\mskip -2mu\psi }$ mesons as a function of $ p_{\mathrm{T}}$ in intervals of $y$. The error bars represent the total uncertainties, which are partially correlated between intervals. |
Fig2a.pdf [13 KiB] HiDef png [158 KiB] Thumbnail [156 KiB] *.C file |
|
|
Fig2b.pdf [13 KiB] HiDef png [163 KiB] Thumbnail [161 KiB] *.C file |
|
|
|
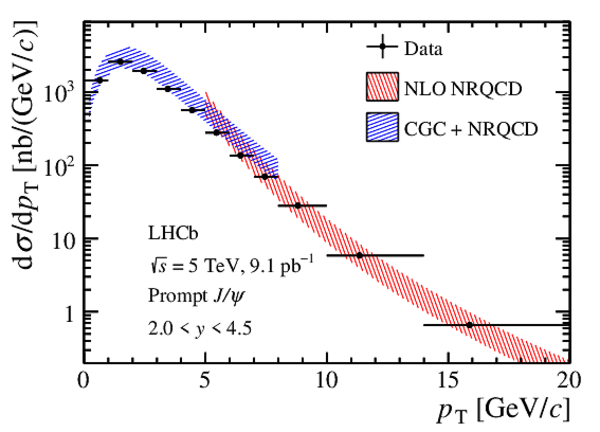
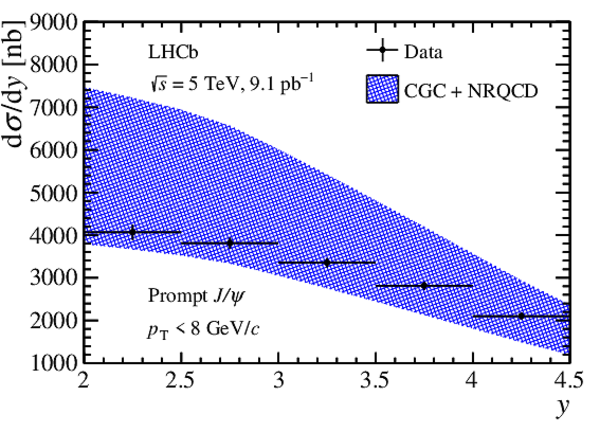
Differential cross-sections (left) $\mathrm{d}\sigma/\mathrm{d} p_{\mathrm{T}} $ and (right) $\mathrm{d}\sigma/\mathrm{d} y$ for prompt $ { J \mskip -3mu/\mskip -2mu\psi }$ mesons compared with NRQCD and CGC calculations [54,55]. Uncertainties due to LDMEs determination, renormalisation scales, and factorisation scales are included in the NRQCD and CGC predictions. |
Fig3a.pdf [14 KiB] HiDef png [295 KiB] Thumbnail [207 KiB] *.C file |
|
|
Fig3b.pdf [14 KiB] HiDef png [993 KiB] Thumbnail [416 KiB] *.C file |
|
|
|
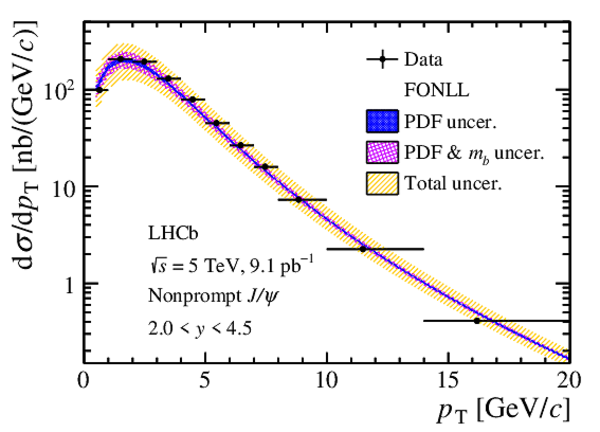
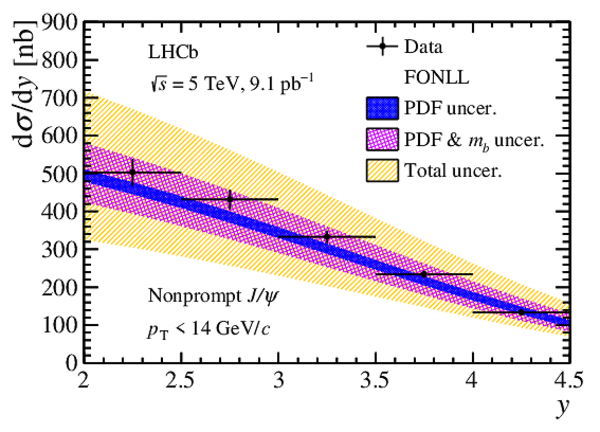
Differential cross-sections (left) $\mathrm{d}\sigma/\mathrm{d} p_{\mathrm{T}} $ and (right) $\mathrm{d}\sigma/\mathrm{d} y$ for nonprompt $ { J \mskip -3mu/\mskip -2mu\psi }$ mesons compared with FONLL calculations [58,59]. The orange band shows the total FONLL calculation uncertainty; the violet band shows the uncertainties of PDFs and that due to $ b $ -quark mass added in quadrature; the blue band shows only the uncertainties on PDFs. |
Fig4a.pdf [21 KiB] HiDef png [350 KiB] Thumbnail [221 KiB] *.C file |
|
|
Fig4b.pdf [21 KiB] HiDef png [867 KiB] Thumbnail [422 KiB] *.C file |
|
|
|
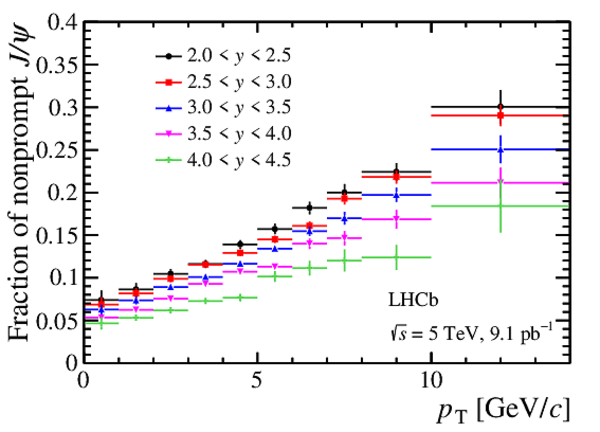
Fraction of nonprompt $ { J \mskip -3mu/\mskip -2mu\psi }$ mesons as a function of $ p_{\mathrm{T}}$ in intervals of $y$. The error bars represent the total uncertainties, which are partially correlated between intervals. |
Fig5.pdf [13 KiB] HiDef png [177 KiB] Thumbnail [175 KiB] *.C file |
|
|
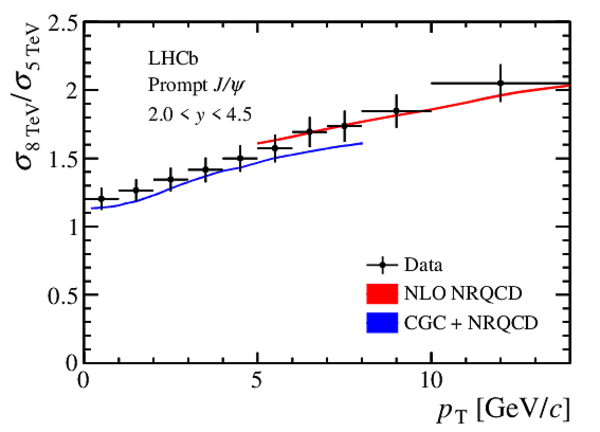
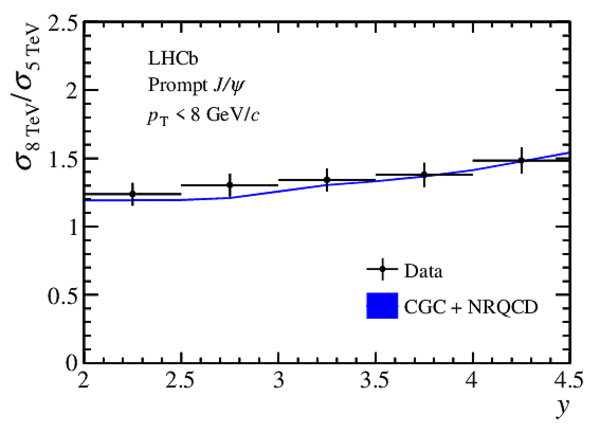
Ratios of differential cross-sections between 8 $\text{ Te V}$ and 5 $\text{ Te V}$ measurements as a function of (left) $ p_{\mathrm{T}}$ and (right) $y$ for prompt $ { J \mskip -3mu/\mskip -2mu\psi }$ mesons compared with NRQCD and CGC calculations [54,55]. Uncertainties due to the LDMEs determination, renormalisation scales, and factorisation scales are included in the NRQCD and CGC calculations. |
Fig6a.pdf [12 KiB] HiDef png [133 KiB] Thumbnail [122 KiB] *.C file |
|
|
Fig6b.pdf [11 KiB] HiDef png [113 KiB] Thumbnail [105 KiB] *.C file |
|
|
|
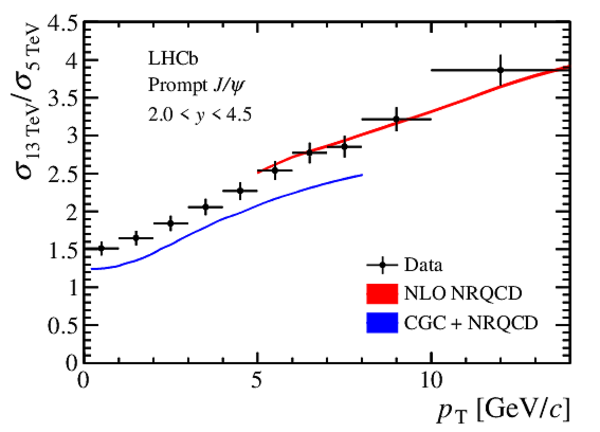
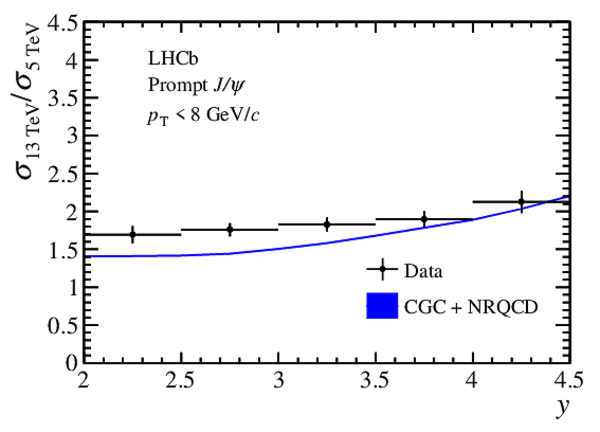
Ratios of differential cross-sections between 13 $\text{ Te V}$ and 5 $\text{ Te V}$ measurements as a function of (left) $ p_{\mathrm{T}}$ and (right) $y$ for prompt $ { J \mskip -3mu/\mskip -2mu\psi }$ mesons compared with NRQCD and CGC calculations [54,55]. Uncertainties due to the LDMEs determination, renormalisation scales, and factorisation scales are included in the NRQCD and CGC calculations. |
Fig7a.pdf [12 KiB] HiDef png [144 KiB] Thumbnail [141 KiB] *.C file |
|
|
Fig7b.pdf [11 KiB] HiDef png [123 KiB] Thumbnail [122 KiB] *.C file |
|
|
|
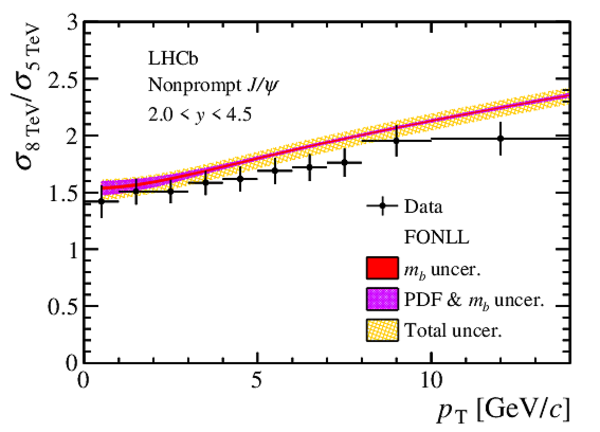
Ratios of differential cross-sections between 8 $\text{ Te V}$ and 5 $\text{ Te V}$ measurements as a function of (left) $ p_{\mathrm{T}}$ and (right) $y$ for nonprompt $ { J \mskip -3mu/\mskip -2mu\psi }$ mesons compared with FONLL calculations [58,59]. The orange band shows the total FONLL calculation uncertainty; the violet band shows the uncertainties on PDFs and that due to $ b $ -quark mass added in quadrature; the red band shows only the uncertainty due to the $ b $ -quark mass. |
Fig8a.pdf [18 KiB] HiDef png [302 KiB] Thumbnail [180 KiB] *.C file |
|
|
Fig8b.pdf [17 KiB] HiDef png [335 KiB] Thumbnail [186 KiB] *.C file |
|
|
|
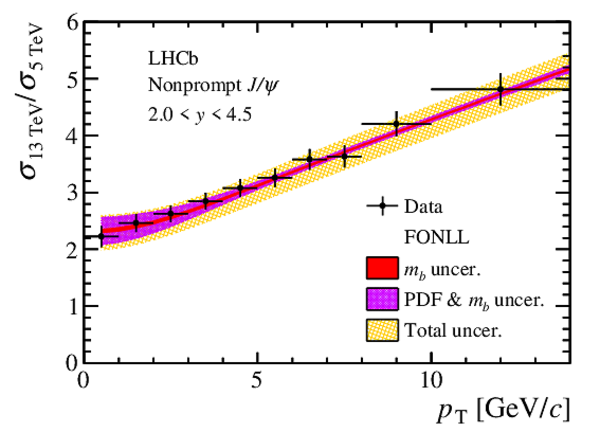
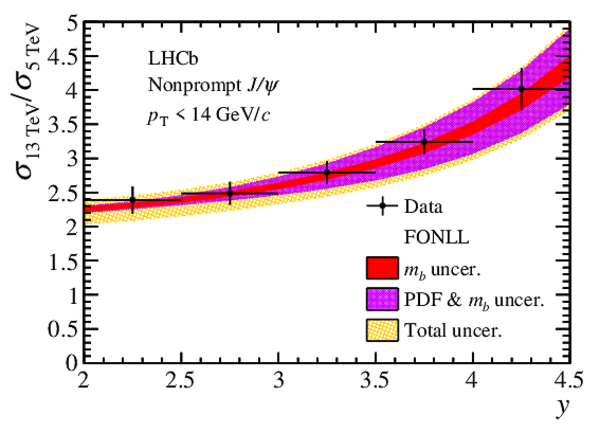
Ratios of differential cross-sections between 13 $\text{ Te V}$ and 5 $\text{ Te V}$ measurements as a function of (left) $ p_{\mathrm{T}}$ and (right) $y$ for nonprompt $ { J \mskip -3mu/\mskip -2mu\psi }$ mesons compared with FONLL calculations [58,59]. The orange band shows the total FONLL calculation uncertainty; the violet band shows the uncertainties on PDFs and that due to $ b $ -quark mass added in quadrature; the red band shows only the uncertainty due to $ b $ -quark mass. |
Fig9a.pdf [18 KiB] HiDef png [417 KiB] Thumbnail [210 KiB] *.C file |
|
|
Fig9b.pdf [18 KiB] HiDef png [529 KiB] Thumbnail [250 KiB] *.C file |
|
|
|
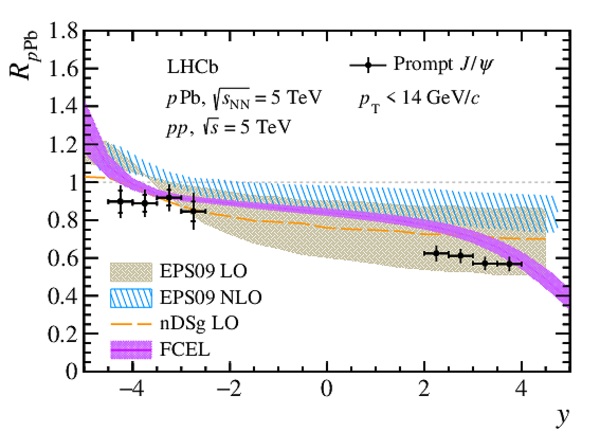
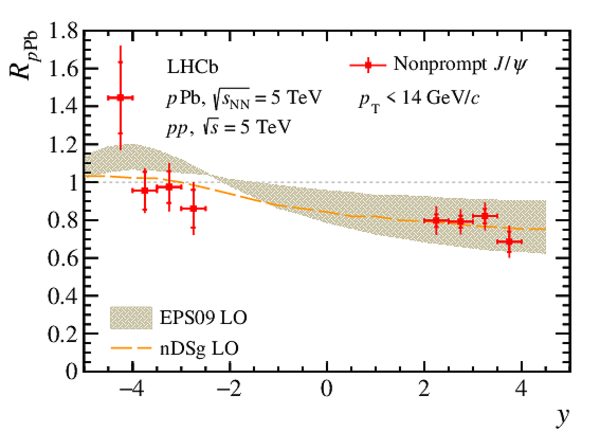
Nuclear modification factor $R_{p\text{Pb}}$ as a function of $y$ for (left) prompt and (right) nonprompt $ { J \mskip -3mu/\mskip -2mu\psi }$ mesons, together with the theoretical predictions from (yellow dashed line and brown band) Ref. [61], (blue band) Ref. [62], and (violet solid line with band) Ref. [63,64]. In the data points the full error bars represent the statistical and systematic uncertainties added in quadrature, while the smaller ones represent the statistical uncertainties. |
Fig10a.pdf [20 KiB] HiDef png [732 KiB] Thumbnail [330 KiB] *.C file |
|
|
Fig10b.pdf [13 KiB] HiDef png [440 KiB] Thumbnail [239 KiB] *.C file |
|
|
|
Animated gif made out of all figures. |
PAPER-2021-020.gif Thumbnail |

|
![HiDef png [386 KiB]](Directory_LHCb-PAPER-2021-020/hidef_Fig1a.png)
![HiDef png [596 KiB]](Directory_LHCb-PAPER-2021-020/hidef_Fig1b.png)
![HiDef png [158 KiB]](Directory_LHCb-PAPER-2021-020/hidef_Fig2a.png)
![HiDef png [163 KiB]](Directory_LHCb-PAPER-2021-020/hidef_Fig2b.png)
![HiDef png [295 KiB]](Directory_LHCb-PAPER-2021-020/hidef_Fig3a.png)
![HiDef png [993 KiB]](Directory_LHCb-PAPER-2021-020/hidef_Fig3b.png)
![HiDef png [350 KiB]](Directory_LHCb-PAPER-2021-020/hidef_Fig4a.png)
![HiDef png [867 KiB]](Directory_LHCb-PAPER-2021-020/hidef_Fig4b.png)
![HiDef png [177 KiB]](Directory_LHCb-PAPER-2021-020/hidef_Fig5.png)
![HiDef png [133 KiB]](Directory_LHCb-PAPER-2021-020/hidef_Fig6a.png)
![HiDef png [113 KiB]](Directory_LHCb-PAPER-2021-020/hidef_Fig6b.png)
![HiDef png [144 KiB]](Directory_LHCb-PAPER-2021-020/hidef_Fig7a.png)
![HiDef png [123 KiB]](Directory_LHCb-PAPER-2021-020/hidef_Fig7b.png)
![HiDef png [302 KiB]](Directory_LHCb-PAPER-2021-020/hidef_Fig8a.png)
![HiDef png [335 KiB]](Directory_LHCb-PAPER-2021-020/hidef_Fig8b.png)
![HiDef png [417 KiB]](Directory_LHCb-PAPER-2021-020/hidef_Fig9a.png)
![HiDef png [529 KiB]](Directory_LHCb-PAPER-2021-020/hidef_Fig9b.png)
![HiDef png [732 KiB]](Directory_LHCb-PAPER-2021-020/hidef_Fig10a.png)
![HiDef png [440 KiB]](Directory_LHCb-PAPER-2021-020/hidef_Fig10b.png)
Tables and captions
|
Relative systematic uncertainties on the measurement of the $ { J \mskip -3mu/\mskip -2mu\psi }$ production cross-section. The symbol $\oplus$ means addition in quadrature. The detailed uncertainties for each ( $ p_{\mathrm{T}}$ ,$y$) interval are in Appendix A. |
Table_1.pdf [74 KiB] HiDef png [136 KiB] Thumbnail [57 KiB] tex code |

|
|
Double-differential production cross-sections $\frac{\mathrm{d}^2\sigma}{\mathrm{d} p_{\mathrm{T}} \mathrm{d} y}$[nb/( $\text{Ge V /}c$ ) per unit rapidity] for prompt $ { J \mskip -3mu/\mskip -2mu\psi }$ mesons in ( $ p_{\mathrm{T}}$ ,$y$) intervals. The first uncertainties are statistical, the second are correlated systematic uncertainties shared between intervals, the third are uncorrelated systematic uncertainties, and the last are correlated between $ p_{\mathrm{T}}$ intervals and uncorrelated between $y$ intervals. |
Table_2.pdf [52 KiB] HiDef png [259 KiB] Thumbnail [127 KiB] tex code |

|
|
Double-differential production cross-sections $\frac{\mathrm{d}^2\sigma}{\mathrm{d} p_{\mathrm{T}} \mathrm{d} y}$[nb/( $\text{Ge V /}c$ ) per unit rapidity] for nonprompt $ { J \mskip -3mu/\mskip -2mu\psi }$ mesons in ( $ p_{\mathrm{T}}$ ,$y$) intervals. The first uncertainties are statistical, the second are correlated systematic uncertainties shared between intervals, the third are uncorrelated systematic uncertainties, and the last are correlated between $ p_{\mathrm{T}}$ intervals and uncorrelated between $y$ intervals |
Table_3.pdf [52 KiB] HiDef png [266 KiB] Thumbnail [133 KiB] tex code |

|
|
Single-differential production cross-sections $\frac{\mathrm{d}\sigma}{\mathrm{d} p_{\mathrm{T}} }$[nb/( $\text{Ge V /}c$ )] for prompt $ { J \mskip -3mu/\mskip -2mu\psi }$ mesons in the rapidity range $2-4.5$. The first uncertainties are statistical, the second are correlated systematic uncertainties shared between intervals, and the last are uncorrelated systematic uncertainties. |
Table_4.pdf [51 KiB] HiDef png [147 KiB] Thumbnail [75 KiB] tex code |

|
|
Single-differential production cross-sections $\frac{\mathrm{d}\sigma}{\mathrm{d} p_{\mathrm{T}} }$[nb/( $\text{Ge V /}c$ )] for nonprompt $ { J \mskip -3mu/\mskip -2mu\psi }$ mesons in the rapidity range $2-4.5$. The first uncertainties are statistical, the second are correlated systematic uncertainties shared between intervals, and the last are uncorrelated systematic uncertainties. |
Table_5.pdf [51 KiB] HiDef png [140 KiB] Thumbnail [72 KiB] tex code |

|
|
Single-differential production cross-sections $\frac{\mathrm{d}\sigma}{\mathrm{d} y}$[nb per unit rapidity] for prompt $ { J \mskip -3mu/\mskip -2mu\psi }$ mesons. The first uncertainties are statistical, the second are correlated systematic uncertainties shared between intervals, and the last are uncorrelated systematic uncertainties. |
Table_6.pdf [50 KiB] HiDef png [67 KiB] Thumbnail [36 KiB] tex code |

|
|
Single-differential production cross-sections $\frac{\mathrm{d}\sigma}{\mathrm{d} y}$[nb per unit rapidity] for nonprompt $ { J \mskip -3mu/\mskip -2mu\psi }$ mesons. The first uncertainties are statistical, the second are correlated systematic uncertainties shared between intervals, and the last are uncorrelated systematic uncertainties. |
Table_7.pdf [50 KiB] HiDef png [92 KiB] Thumbnail [48 KiB] tex code |

|
|
Fraction of nonprompt $ { J \mskip -3mu/\mskip -2mu\psi }$ mesons (in %) in ( $ p_{\mathrm{T}}$ ,$y$) intervals. The first uncertainty is statistical and the second is systematic. |
Table_8.pdf [51 KiB] HiDef png [163 KiB] Thumbnail [97 KiB] tex code |

|
|
Nuclear modification factor $R_{p\text{Pb}}$ as a function of $y$ with $ p_{\mathrm{T}} <14\text{ Ge V /}c $. The first uncertainty is statistical and the second is systematic. |
Table_9.pdf [45 KiB] HiDef png [119 KiB] Thumbnail [61 KiB] tex code |

|
|
Cross-section ratios between 8 $\text{ Te V}$ and 5 $\text{ Te V}$ measurements for prompt $ { J \mskip -3mu/\mskip -2mu\psi }$ mesons as a function of $ p_{\mathrm{T}}$ with $2.0<y<4.5$. The first uncertainty is statistical and the second is systematic. |
Table_10.pdf [50 KiB] HiDef png [137 KiB] Thumbnail [70 KiB] tex code |

|
|
Cross-section ratios between 8 $\text{ Te V}$ and 5 $\text{ Te V}$ measurements for prompt $ { J \mskip -3mu/\mskip -2mu\psi }$ mesons as a function of $y$ with $ p_{\mathrm{T}} <8\text{ Ge V /}c $. The first uncertainty is statistical and the second is systematic. |
Table_11.pdf [50 KiB] HiDef png [116 KiB] Thumbnail [53 KiB] tex code |

|
|
Cross-section ratios between 13 $\text{ Te V}$ and 5 $\text{ Te V}$ measurements for prompt $ { J \mskip -3mu/\mskip -2mu\psi }$ mesons as a function of $ p_{\mathrm{T}}$ with $2.0<y<4.5$. The first uncertainty is statistical and the second is systematic. |
Table_12.pdf [51 KiB] HiDef png [142 KiB] Thumbnail [72 KiB] tex code |

|
|
Cross-section ratios between 13 $\text{ Te V}$ and 5 $\text{ Te V}$ measurements for prompt $ { J \mskip -3mu/\mskip -2mu\psi }$ mesons as a function of $y$ with $ p_{\mathrm{T}} <8\text{ Ge V /}c $. The first uncertainty is statistical and the second is systematic. |
Table_13.pdf [50 KiB] HiDef png [113 KiB] Thumbnail [52 KiB] tex code |

|
|
Cross-section ratios between 8 $\text{ Te V}$ and 5 $\text{ Te V}$ measurements for nonprompt $ { J \mskip -3mu/\mskip -2mu\psi }$ mesons as a function of $ p_{\mathrm{T}}$ with $2.0<y<4.5$. The first uncertainty is statistical and the second is systematic. |
Table_14.pdf [50 KiB] HiDef png [136 KiB] Thumbnail [70 KiB] tex code |

|
|
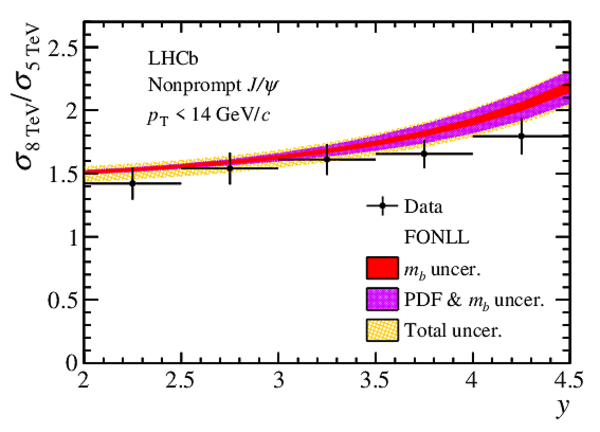
Cross-section ratios between 8 $\text{ Te V}$ and 5 $\text{ Te V}$ measurements for nonprompt $ { J \mskip -3mu/\mskip -2mu\psi }$ mesons as a function of $y$ with $ p_{\mathrm{T}} <14\text{ Ge V /}c $. The first uncertainty is statistical and the second is systematic. |
Table_15.pdf [50 KiB] HiDef png [106 KiB] Thumbnail [49 KiB] tex code |

|
|
Cross-section ratios between 13 $\text{ Te V}$ and 5 $\text{ Te V}$ measurements for nonprompt $ { J \mskip -3mu/\mskip -2mu\psi }$ mesons as a function of $ p_{\mathrm{T}}$ with $2.0<y<4.5$. The first uncertainty is statistical and the second is systematic. |
Table_16.pdf [51 KiB] HiDef png [145 KiB] Thumbnail [73 KiB] tex code |

|
|
Cross-section ratios between 13 $\text{ Te V}$ and 5 $\text{ Te V}$ measurements for nonprompt $ { J \mskip -3mu/\mskip -2mu\psi }$ mesons as a function of $y$ with $ p_{\mathrm{T}} <14\text{ Ge V /}c $. The first uncertainty is statistical and the second is systematic. |
Table_17.pdf [50 KiB] HiDef png [114 KiB] Thumbnail [51 KiB] tex code |

|
|
Relative changes of cross-sections (in %), for a polarisation of $\lambda_{\theta}=-0.2$ rather than zero, in ( $ p_{\mathrm{T}}$ ,$y$) intervals. |
Table_18.pdf [51 KiB] HiDef png [101 KiB] Thumbnail [48 KiB] tex code |

|
|
Relative change of cross-sections (in %), for a polarisation of $\lambda_{\theta}=-1$ rather than zero, in ( $ p_{\mathrm{T}}$ ,$y$) intervals. |
Table_19.pdf [51 KiB] HiDef png [88 KiB] Thumbnail [44 KiB] tex code |

|
|
Relative changes of cross-sections (in %), for a polarisation of $\lambda_{\theta}=+1$ rather than zero, in ( $ p_{\mathrm{T}}$ ,$y$) intervals. |
Table_20.pdf [51 KiB] HiDef png [83 KiB] Thumbnail [41 KiB] tex code |

|
![HiDef png [136 KiB]](Directory_LHCb-PAPER-2021-020/hidef_Table_1.png)
![HiDef png [259 KiB]](Directory_LHCb-PAPER-2021-020/hidef_Table_2.png)
![HiDef png [266 KiB]](Directory_LHCb-PAPER-2021-020/hidef_Table_3.png)
![HiDef png [147 KiB]](Directory_LHCb-PAPER-2021-020/hidef_Table_4.png)
![HiDef png [140 KiB]](Directory_LHCb-PAPER-2021-020/hidef_Table_5.png)
![HiDef png [67 KiB]](Directory_LHCb-PAPER-2021-020/hidef_Table_6.png)
![HiDef png [92 KiB]](Directory_LHCb-PAPER-2021-020/hidef_Table_7.png)
![HiDef png [163 KiB]](Directory_LHCb-PAPER-2021-020/hidef_Table_8.png)
![HiDef png [119 KiB]](Directory_LHCb-PAPER-2021-020/hidef_Table_9.png)
![HiDef png [137 KiB]](Directory_LHCb-PAPER-2021-020/hidef_Table_10.png)
![HiDef png [116 KiB]](Directory_LHCb-PAPER-2021-020/hidef_Table_11.png)
![HiDef png [142 KiB]](Directory_LHCb-PAPER-2021-020/hidef_Table_12.png)
![HiDef png [113 KiB]](Directory_LHCb-PAPER-2021-020/hidef_Table_13.png)
![HiDef png [136 KiB]](Directory_LHCb-PAPER-2021-020/hidef_Table_14.png)
![HiDef png [106 KiB]](Directory_LHCb-PAPER-2021-020/hidef_Table_15.png)
![HiDef png [145 KiB]](Directory_LHCb-PAPER-2021-020/hidef_Table_16.png)
![HiDef png [114 KiB]](Directory_LHCb-PAPER-2021-020/hidef_Table_17.png)
![HiDef png [101 KiB]](Directory_LHCb-PAPER-2021-020/hidef_Table_18.png)
![HiDef png [88 KiB]](Directory_LHCb-PAPER-2021-020/hidef_Table_19.png)
![HiDef png [83 KiB]](Directory_LHCb-PAPER-2021-020/hidef_Table_20.png)
Supplementary Material [file]
| Supplementary material full pdf |
supple[..].pdf [145 KiB] |
|
|
This ZIP file contains supplementary material for the publication LHCb-PAPER-2021-020. The files are: An overview of the extra figures: supplementary.pdf Figures in various formats: Fig1-S.pdf, Fig1-S.png, Fig1-S.eps, Fig1-S.C Fig2a-S.pdf, Fig2a-S.png, Fig2a-S.eps, Fig2a-S.C Fig2b-S.pdf, Fig2b-S.png, Fig2b-S.eps, Fig2b-S.C The LaTeX source: supplementary-app.tex |
Fig1-S.pdf [11 KiB] HiDef png [107 KiB] Thumbnail [114 KiB] *C file |
|
|
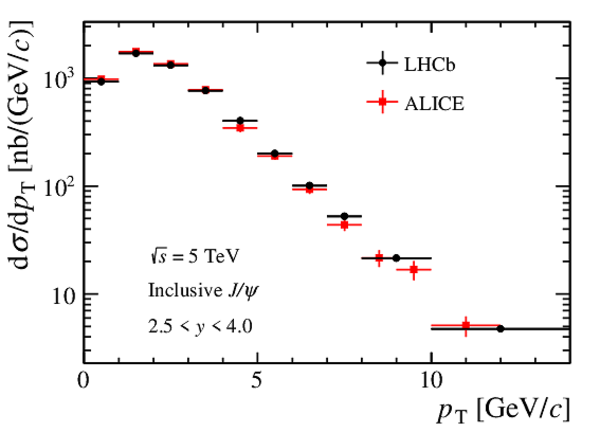
Fig2a-S.pdf [13 KiB] HiDef png [129 KiB] Thumbnail [141 KiB] *C file |
|
|
|
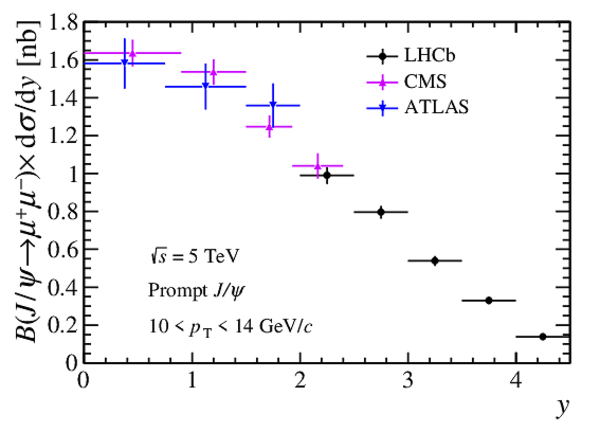
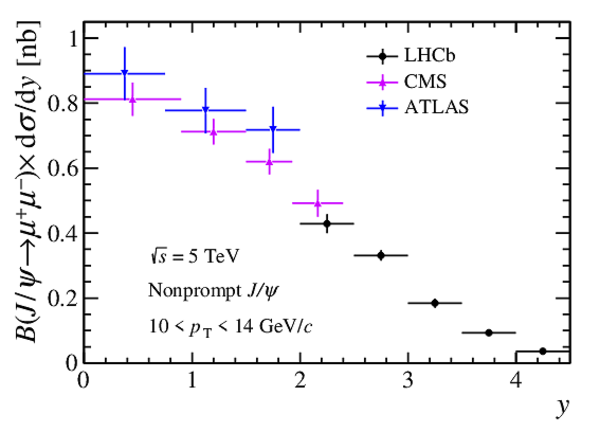
Fig2b-S.pdf [12 KiB] HiDef png [121 KiB] Thumbnail [124 KiB] *C file |
|
![HiDef png [107 KiB]](Directory_LHCb-PAPER-2021-020/supplementary/hidef_Fig1-S.png)
![HiDef png [129 KiB]](Directory_LHCb-PAPER-2021-020/supplementary/hidef_Fig2a-S.png)
![HiDef png [121 KiB]](Directory_LHCb-PAPER-2021-020/supplementary/hidef_Fig2b-S.png)
Created on 19 April 2024.