Measurement of $\chi_{c1}(3872)$ production in proton-proton collisions at $\sqrt{s}=8$ and 13 TeV
[to restricted-access page]Information
LHCb-PAPER-2021-026
CERN-EP-2021-182
arXiv:2109.07360 [PDF]
(Submitted on 15 Sep 2021)
JHEP 01 (2022) 131
Inspire 1922217
Tools
Abstract
The production cross-section of the $\chi_{c1}(3872)$ state relative to the $\psi(2S)$ meson is measured using proton-proton collision data collected with the LHCb experiment at centre-of-mass energies of $\sqrt{s}=8$ and 13 TeV, corresponding to integrated luminosities of 2.0 and 5.4 fb$^{-1}$, respectively. The two mesons are reconstructed in the $J/\psi\pi^{+}\pi^{-}$ final state. The ratios of the prompt and nonprompt $\chi_{c1}(3872)$ to $\psi(2S)$ production cross-sections are measured as a function of transverse momentum, $p_{\rm T}$, and rapidity, $y$, in the kinematic range $4 < p_{\rm T} < 20$ GeV/$c$ and $2.0 < y < 4.5$. The prompt ratio is found to increase with $p_{\rm T}$ independently of $y$. The double-differential cross-section ratio of $\chi_{c1}(3872)$ relative to $\psi(2S)$ mesons between 13 and 8 TeV is also measured for the prompt component and observed to be consistent with unity, independent of $p_{\rm T}$ and centre-of-mass energy.
Figures and captions
|
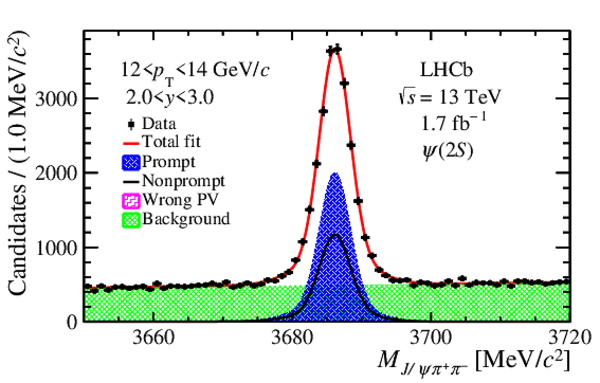
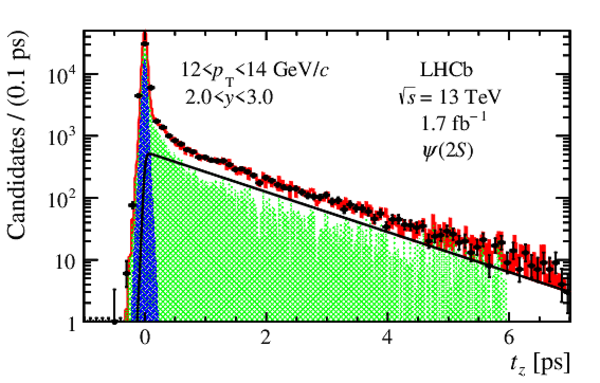
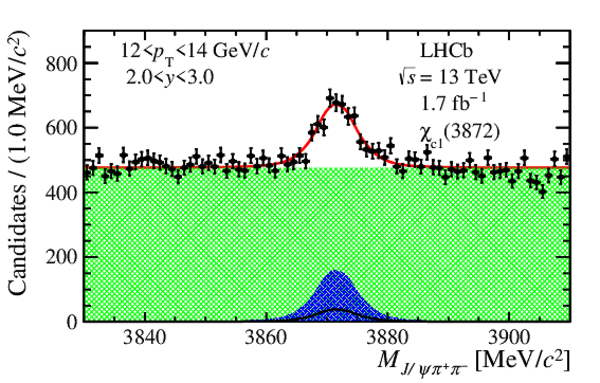
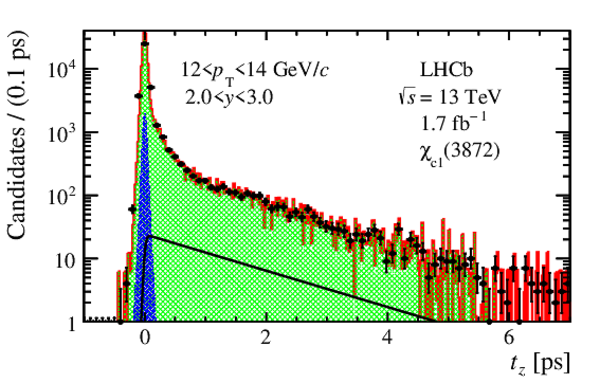
Distributions of (left) invariant mass and (right) pseudo-decay-time for (top) $\psi {(2S)}$ and (bottom) $\chi _{c1}(3872)$ candidates in the kinematic interval $12< p_{\mathrm{T}} <14\text{ Ge V /}c $ and $2.0<y<3.0$ for the 2016 data sample. Fit projections are overlaid. The solid red curve represents the total fit projection and the shaded green area corresponds to the background component. The prompt contribution of $\chi _{c1}(3872)$ and $\psi {(2S)}$ mesons is shown as the cross-hatched blue area, whereas the corresponding nonprompt component from $ b $ -hadron decays is illustrated as a solid black line. The wrong PV contribution is consistent with zero. |
Fig1to[..].pdf [33 KiB] HiDef png [442 KiB] Thumbnail [251 KiB] *.C file |
|
|
Fig1to[..].pdf [57 KiB] HiDef png [586 KiB] Thumbnail [284 KiB] *.C file |
|
|
|
Fig1bo[..].pdf [34 KiB] HiDef png [841 KiB] Thumbnail [364 KiB] *.C file |
|
|
|
Fig1bo[..].pdf [55 KiB] HiDef png [621 KiB] Thumbnail [302 KiB] *.C file |
|
|
|
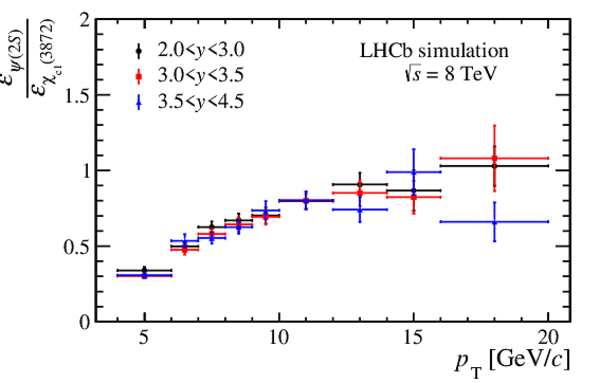
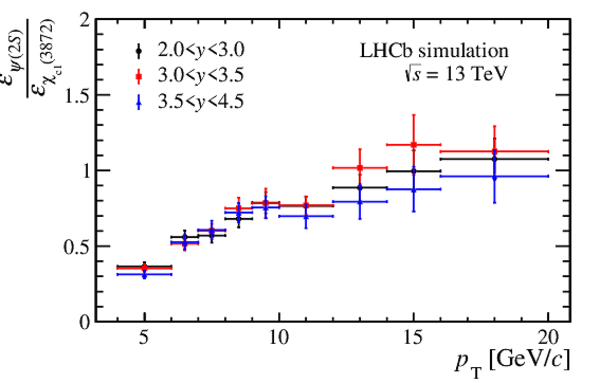
Efficiency ratio of $\psi {(2S)}$ to $\chi _{c1}(3872)$ mesons as a function of $ p_{\mathrm{T}}$ in three rapidity intervals. |
Fig2left.pdf [16 KiB] HiDef png [124 KiB] Thumbnail [113 KiB] *.C file |
|
|
Fig2right.pdf [16 KiB] HiDef png [126 KiB] Thumbnail [113 KiB] *.C file |
|
|
|
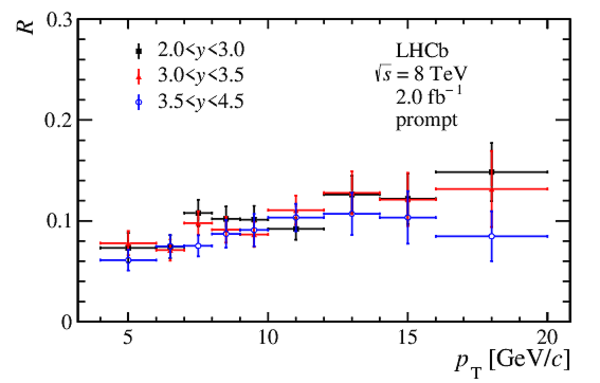
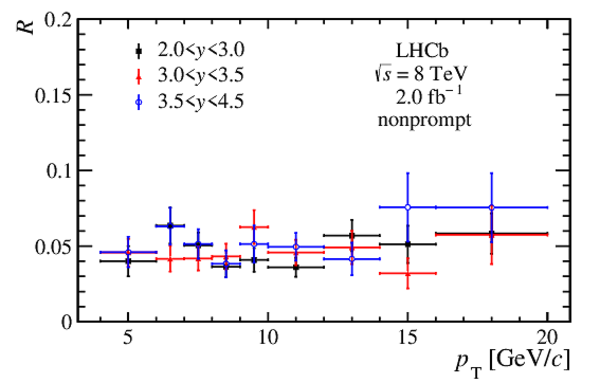
Ratios of differential cross-section times the branching ratio to the $ { J \mskip -3mu/\mskip -2mu\psi } \pi ^+ \pi ^- $ final state between $\chi _{c1}(3872)$ and $\psi {(2S)}$ mesons from (left) prompt production and (right) nonprompt from $ b $ -hadron decays, for the $\sqrt{s} = 8 \text{ Te V} $ sample as a function of $ p_{\mathrm{T}}$ in intervals of rapidity. In all panels, the error bars represent the sum in quadrature of the statistical and systematic uncertainties. |
Fig3left.pdf [15 KiB] HiDef png [122 KiB] Thumbnail [107 KiB] *.C file |
|
|
Fig3right.pdf [15 KiB] HiDef png [130 KiB] Thumbnail [117 KiB] *.C file |
|
|
|
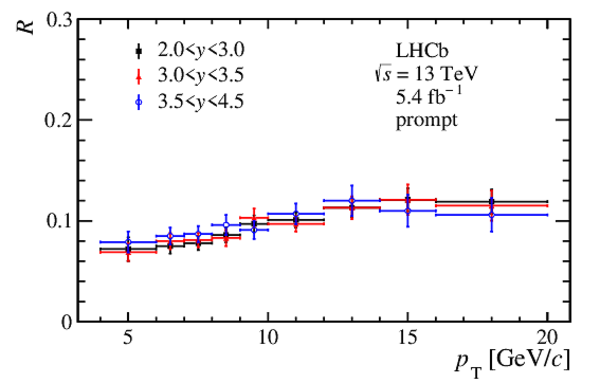
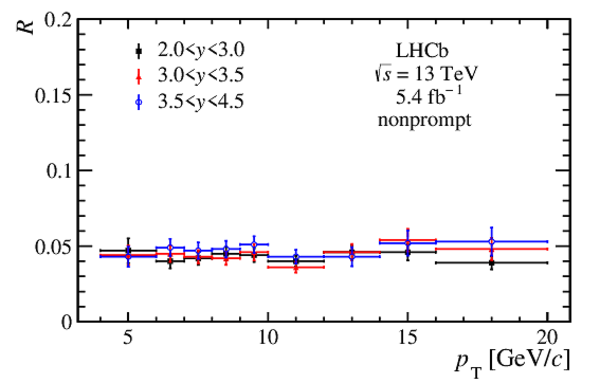
Ratios of differential cross-section times the branching ratio to the $ { J \mskip -3mu/\mskip -2mu\psi } \pi ^+ \pi ^- $ final state between $\chi _{c1}(3872)$ and $\psi {(2S)}$ mesons from (left) prompt production and (right) nonprompt from $ b $ -hadron decays, for the $\sqrt{s} = 13 \text{ Te V} $ sample as a function of $ p_{\mathrm{T}}$ in intervals of rapidity. In all panels, the error bars represent the sum in quadrature of the statistical and systematic uncertainties. |
Fig4left.pdf [15 KiB] HiDef png [119 KiB] Thumbnail [103 KiB] *.C file |
|
|
Fig4right.pdf [15 KiB] HiDef png [124 KiB] Thumbnail [112 KiB] *.C file |
|
|
|
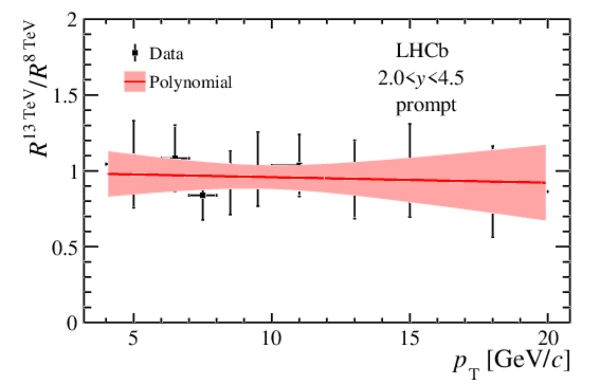
Double ratio of the prompt $\chi _{c1}(3872)$ production cross-section relative to that of $\psi {(2S)}$ mesons between 13 and 8 $\text{ Te V}$ as a function of $ p_{\mathrm{T}}$ integrated over $2.0<y<4.5$. The red line with the solid band represent the fit result to a first-order polynomial and its uncertainty. |
Fig5.pdf [17 KiB] HiDef png [157 KiB] Thumbnail [113 KiB] *.C file |
|
|
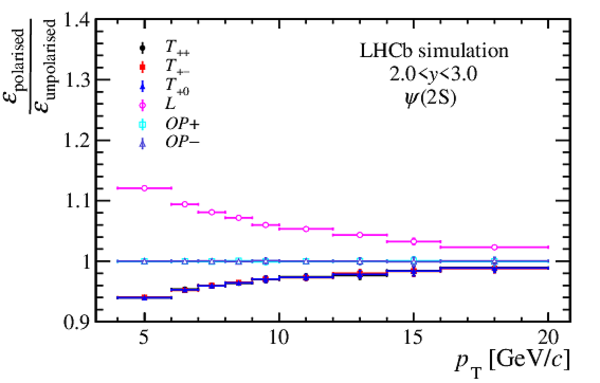
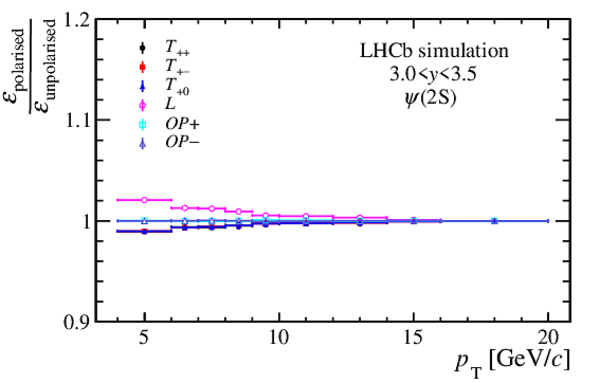
Ratio of acceptance efficiencies for $\psi {(2S)}$ mesons for various polarisation hypotheses with respect to the unpolarised case. |
Fig6to[..].pdf [17 KiB] HiDef png [136 KiB] Thumbnail [118 KiB] *.C file |
|
|
Fig6to[..].pdf [16 KiB] HiDef png [121 KiB] Thumbnail [102 KiB] *.C file |
|
|
|
Fig6bottom.pdf [17 KiB] HiDef png [126 KiB] Thumbnail [110 KiB] *.C file |

|
|
|
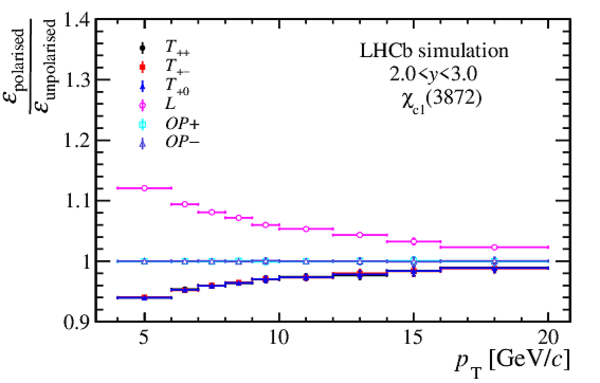
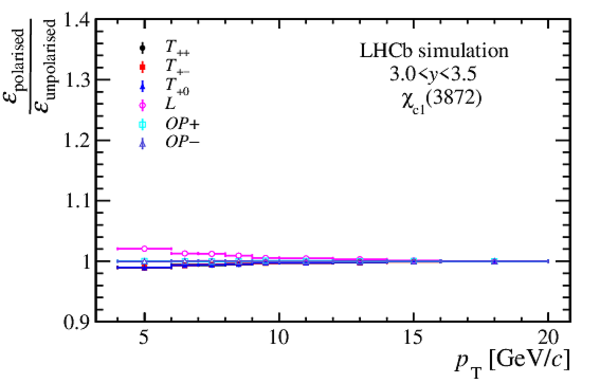
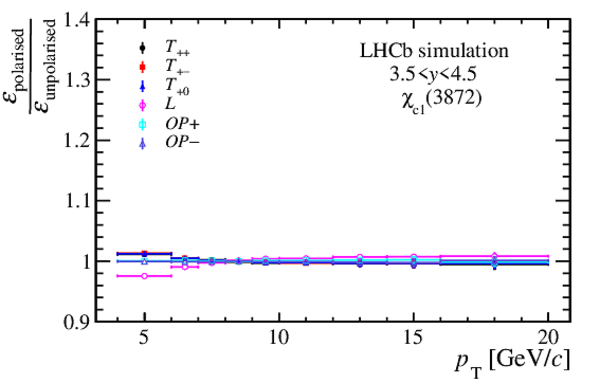
Ratio of acceptance efficiencies for $\chi _{c1}(3872)$ mesons for various polarisation hypotheses with respect to the unpolarised case. |
Fig7to[..].pdf [17 KiB] HiDef png [138 KiB] Thumbnail [120 KiB] *.C file |
|
|
Fig7to[..].pdf [16 KiB] HiDef png [125 KiB] Thumbnail [111 KiB] *.C file |
|
|
|
Fig7bottom.pdf [17 KiB] HiDef png [128 KiB] Thumbnail [112 KiB] *.C file |
|
|
|
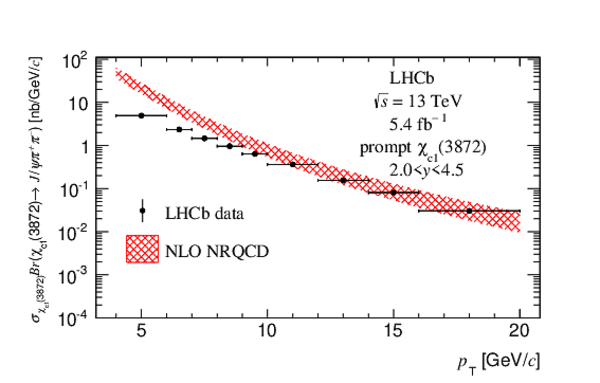
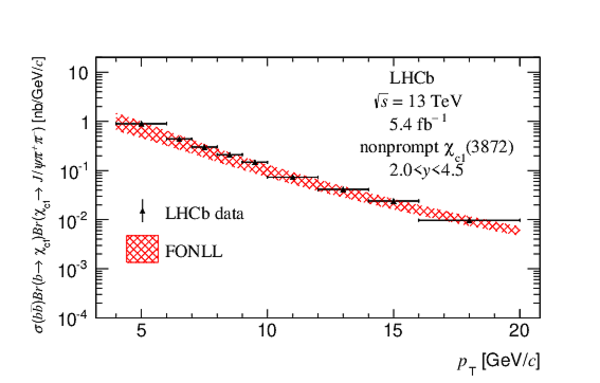
Measured production cross-section times branching fractions as a function of $ p_{\mathrm{T}}$ for (left) prompt $\chi _{c1}(3872)$ mesons compared to NLO NRQCD predictions [16] and (right) from $ b $ decays compared to FONLL predictions [54,55]. |
Fig8left.pdf [16 KiB] HiDef png [215 KiB] Thumbnail [157 KiB] *.C file |
|
|
Fig8right.pdf [16 KiB] HiDef png [195 KiB] Thumbnail [145 KiB] *.C file |
|
|
|
Animated gif made out of all figures. |
PAPER-2021-026.gif Thumbnail |

|
![HiDef png [442 KiB]](Directory_LHCb-PAPER-2021-026/hidef_Fig1topleft.png)
![HiDef png [586 KiB]](Directory_LHCb-PAPER-2021-026/hidef_Fig1topright.png)
![HiDef png [841 KiB]](Directory_LHCb-PAPER-2021-026/hidef_Fig1bottomleft.png)
![HiDef png [621 KiB]](Directory_LHCb-PAPER-2021-026/hidef_Fig1bottomright.png)
![HiDef png [124 KiB]](Directory_LHCb-PAPER-2021-026/hidef_Fig2left.png)
![HiDef png [126 KiB]](Directory_LHCb-PAPER-2021-026/hidef_Fig2right.png)
![HiDef png [122 KiB]](Directory_LHCb-PAPER-2021-026/hidef_Fig3left.png)
![HiDef png [130 KiB]](Directory_LHCb-PAPER-2021-026/hidef_Fig3right.png)
![HiDef png [119 KiB]](Directory_LHCb-PAPER-2021-026/hidef_Fig4left.png)
![HiDef png [124 KiB]](Directory_LHCb-PAPER-2021-026/hidef_Fig4right.png)
![HiDef png [157 KiB]](Directory_LHCb-PAPER-2021-026/hidef_Fig5.png)
![HiDef png [136 KiB]](Directory_LHCb-PAPER-2021-026/hidef_Fig6topleft.png)
![HiDef png [121 KiB]](Directory_LHCb-PAPER-2021-026/hidef_Fig6topright.png)
![HiDef png [126 KiB]](Directory_LHCb-PAPER-2021-026/hidef_Fig6bottom.png)
![HiDef png [138 KiB]](Directory_LHCb-PAPER-2021-026/hidef_Fig7topleft.png)
![HiDef png [125 KiB]](Directory_LHCb-PAPER-2021-026/hidef_Fig7topright.png)
![HiDef png [128 KiB]](Directory_LHCb-PAPER-2021-026/hidef_Fig7bottom.png)
![HiDef png [215 KiB]](Directory_LHCb-PAPER-2021-026/hidef_Fig8left.png)
![HiDef png [195 KiB]](Directory_LHCb-PAPER-2021-026/hidef_Fig8right.png)
Tables and captions
|
Systematic uncertainties of the production cross-section of $\chi _{c1}(3872)$ relative to $\psi {(2S)}$ mesons in the kinematic region $4 < p_{\mathrm{T}} < 20$ $\text{ Ge V /}c$ and $2.0 < y < 4.5$. Ranges are due to the variation across the $( p_{\mathrm{T}} , y)$ intervals. When only a range is given for the 13 TeV data it is shared between different data-taking years. The large ranges in some cases are due to statistical fluctuations of the signal or control samples used to evaluate the uncertainties. The systematic uncertainties due to the $M_{ { J \mskip -3mu/\mskip -2mu\psi } \pi ^+ \pi ^- }$ and $t_z$ fit are considered to be $100 \%$ correlated, and the statistical and systematic uncertainties due to PID and tracking are considered to be uncorrelated. |
Table_1.pdf [82 KiB] HiDef png [178 KiB] Thumbnail [81 KiB] tex code |

|
|
Ratio of acceptance efficiencies for $\psi {(2S)}$ mesons for various polarisation hypotheses with respect to the unpolarised case, in the interval $2.0<y<3.0$. |
Table_2.pdf [57 KiB] HiDef png [106 KiB] Thumbnail [42 KiB] tex code |

|
|
Ratio of acceptance efficiencies for $\psi {(2S)}$ mesons for various polarisation hypotheses with respect to the unpolarised case, in the interval $3.0<y<3.5$. |
Table_3.pdf [57 KiB] HiDef png [102 KiB] Thumbnail [38 KiB] tex code |

|
|
Ratio of acceptance efficiencies for $\psi {(2S)}$ mesons for various polarisation hypotheses with respect to the unpolarised case, in the interval $3.5<y<4.5$. |
Table_4.pdf [57 KiB] HiDef png [102 KiB] Thumbnail [41 KiB] tex code |

|
|
Ratio of acceptance efficiencies for $\chi _{c1}(3872)$ mesons for various polarisation hypotheses with respect to the unpolarised case, in the interval $2.0<y<3.0$. |
Table_5.pdf [57 KiB] HiDef png [108 KiB] Thumbnail [42 KiB] tex code |

|
|
Ratio of acceptance efficiencies for $\chi _{c1}(3872)$ mesons for various polarisation hypotheses with respect to the unpolarised case, in the interval $3.0<y<3.5$. |
Table_6.pdf [57 KiB] HiDef png [107 KiB] Thumbnail [40 KiB] tex code |

|
|
Ratio of acceptance efficiencies for $\chi _{c1}(3872)$ mesons for various polarisation hypotheses with respect to the unpolarised case, in the interval $3.5<y<4.5$. |
Table_7.pdf [57 KiB] HiDef png [104 KiB] Thumbnail [40 KiB] tex code |

|
![HiDef png [178 KiB]](Directory_LHCb-PAPER-2021-026/hidef_Table_1.png)
![HiDef png [106 KiB]](Directory_LHCb-PAPER-2021-026/hidef_Table_2.png)
![HiDef png [102 KiB]](Directory_LHCb-PAPER-2021-026/hidef_Table_3.png)
![HiDef png [102 KiB]](Directory_LHCb-PAPER-2021-026/hidef_Table_4.png)
![HiDef png [108 KiB]](Directory_LHCb-PAPER-2021-026/hidef_Table_5.png)
![HiDef png [107 KiB]](Directory_LHCb-PAPER-2021-026/hidef_Table_6.png)
![HiDef png [104 KiB]](Directory_LHCb-PAPER-2021-026/hidef_Table_7.png)
Created on 19 April 2024.