Search for massive long-lived particles decaying semileptonically at $\sqrt{s}=13$ TeV
[to restricted-access page]Information
LHCb-PAPER-2021-028
CERN-EP-2021-186
arXiv:2110.07293 [PDF]
(Submitted on 14 Oct 2021)
Eur. Phys. J. C82 (2022) 373
Inspire 1945087
Tools
Abstract
A search is performed for massive long-lived particles (LLP) decaying semileptonically into a muon and two quarks. Two kinds of LLP production processes were considered. In the first, a Higgs-like boson with mass from 30 to 200 GeV is produced by gluon fusion and decays into two LLPs. The analysis covers LLP mass values from 10 GeV up to about one half the Higgs-like boson mass. The second LLP production mode is directly from quark interactions, with LLP masses from 10 to 90 GeV. The LLP lifetimes considered range from 5 to 200 ps. This study uses LHCb data collected from proton-proton collisions at sqrt(s)=13 TeV, corresponding to an integrated luminosity of 5.4 1/fb. No evidence of these long-lived states has been observed, and upper limits on the production cross-section times branching ratio have been set for each model considered.
Figures and captions
|
LLP production processes considered in this paper, where the $\tilde{\chi}^{0}_{1}$ represents the LLP: (a) di-LLP production via a scalar particle $h^0$; (b) non-resonant, direct LLP production from quark interactions, where $X$ is a stable particle, with mass identical to the LLP. The LLP decays into a muon and two quarks: $\tilde{\chi}^{0}_{1} \rightarrow \mu^{+} q_{i} q_{j}( \mu^{-} \bar{q_{i}} \bar{q_{j}})$. |
fig1.pdf [46 KiB] HiDef png [29 KiB] Thumbnail [14 KiB] *.C file |

|
|
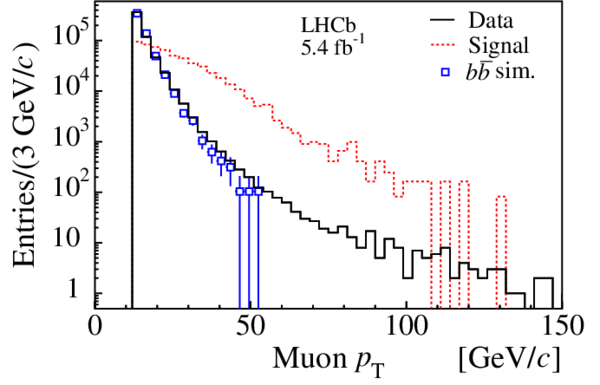
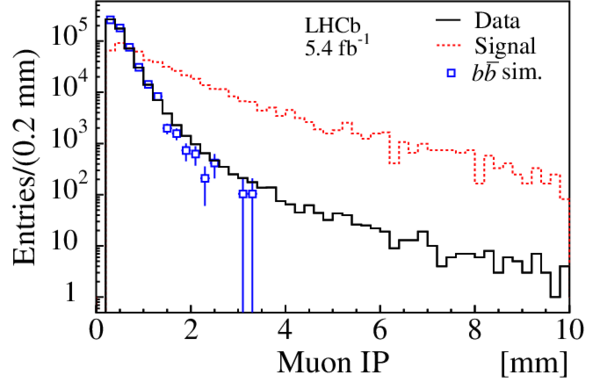
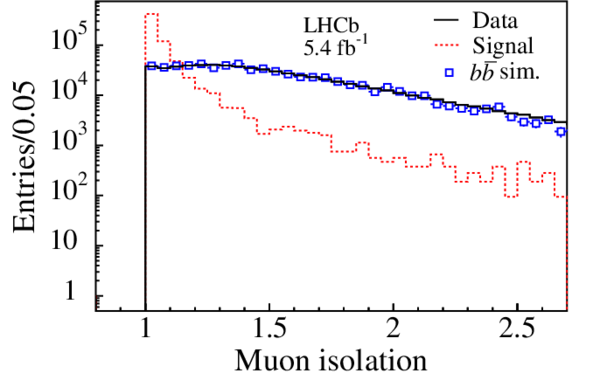
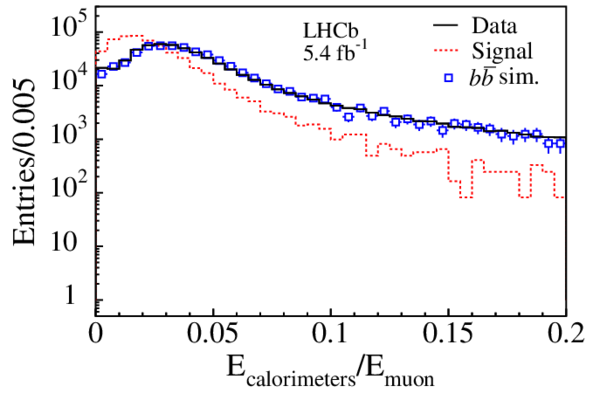
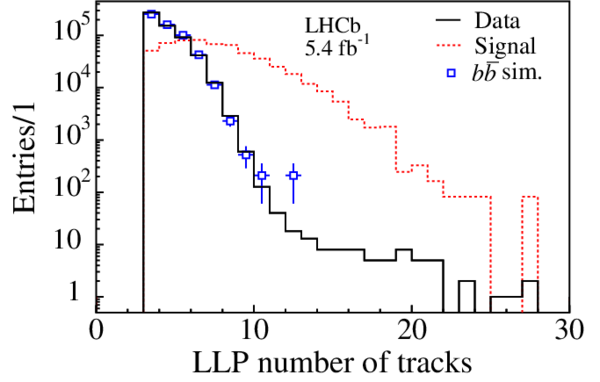
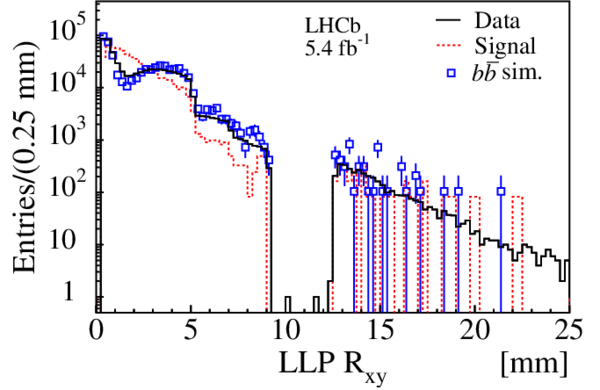
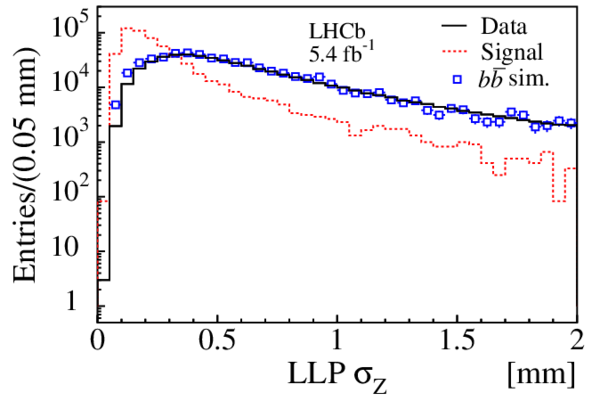
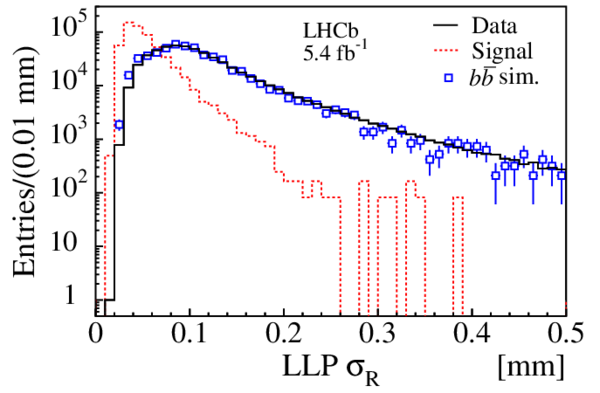
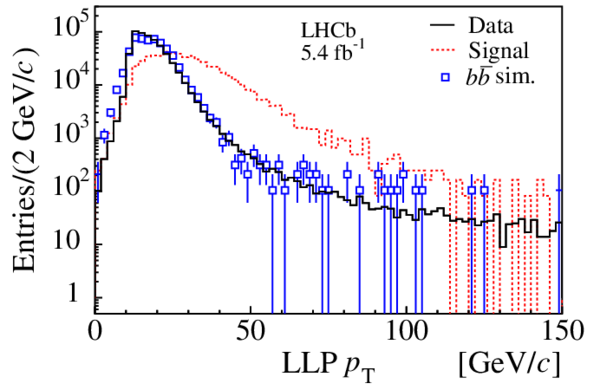
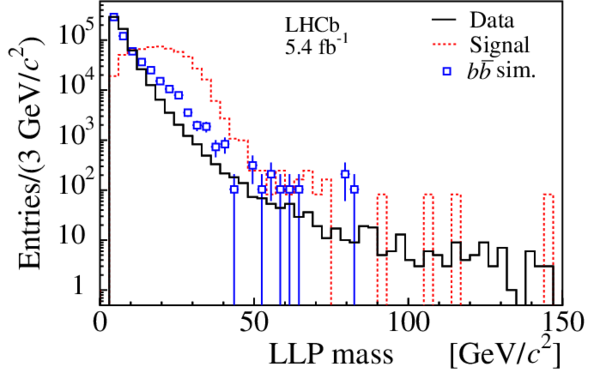
Distributions from data compared to simulated $ b \overline b $ events (blue) and the simulated signal h125-chi40-10p (red), after preselection. From (a) to (j): muon transverse momentum; muon impact parameter; muon isolation; the calorimetric energy, $\rm E_{calorimeters}$, associated with the muon normalised by the muon energy, $\rm E_{muon}$; the number of tracks used to reconstruct the LLP vertex including the muon; the radial distance to the beam line of the reconstructed vertex; longitudinal and radial vertex fit errors, $\sigma_Z$ and $\sigma_R$; reconstructed transverse momentum and mass of the LLP candidate. The distributions from simulated events are normalised to the data. |
fig2-a.pdf [10 KiB] HiDef png [156 KiB] Thumbnail [93 KiB] *.C file |
|
|
fig2-b.pdf [10 KiB] HiDef png [136 KiB] Thumbnail [81 KiB] *.C file |
|
|
|
fig2-c.pdf [10 KiB] HiDef png [135 KiB] Thumbnail [84 KiB] *.C file |
|
|
|
fig2-d.pdf [10 KiB] HiDef png [144 KiB] Thumbnail [88 KiB] *.C file |
|
|
|
fig2-e.pdf [9 KiB] HiDef png [127 KiB] Thumbnail [75 KiB] *.C file |
|
|
|
fig2-f.pdf [11 KiB] HiDef png [208 KiB] Thumbnail [128 KiB] *.C file |
|
|
|
fig2-g.pdf [11 KiB] HiDef png [139 KiB] Thumbnail [85 KiB] *.C file |
|
|
|
fig2-h.pdf [12 KiB] HiDef png [168 KiB] Thumbnail [103 KiB] *.C file |
|
|
|
fig2-i.pdf [11 KiB] HiDef png [192 KiB] Thumbnail [119 KiB] *.C file |
|
|
|
fig2-j.pdf [10 KiB] HiDef png [163 KiB] Thumbnail [98 KiB] *.C file |
|
|
|
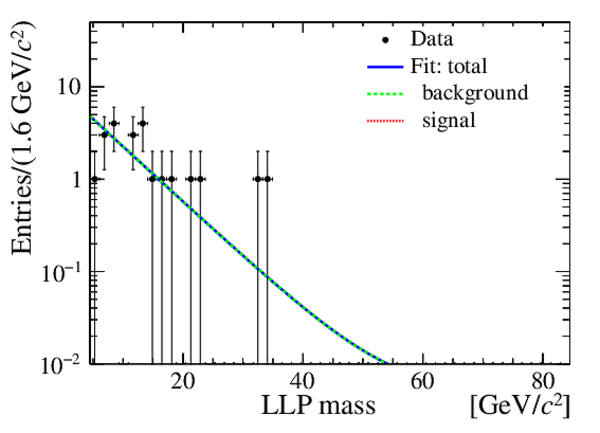
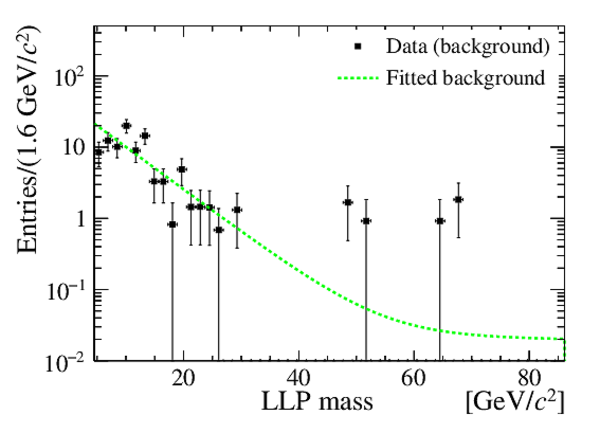
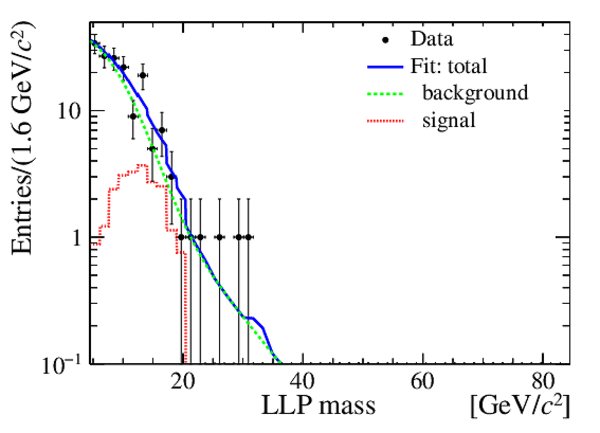
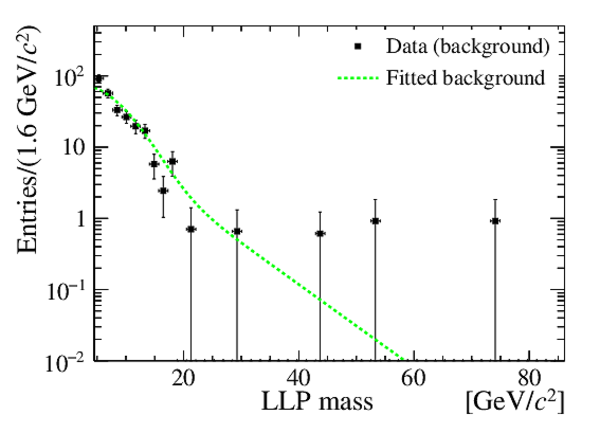
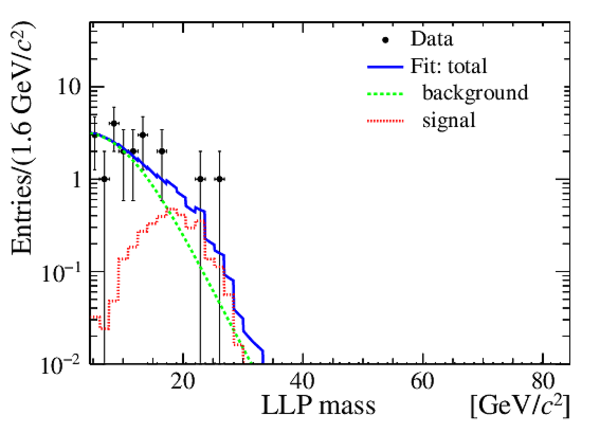
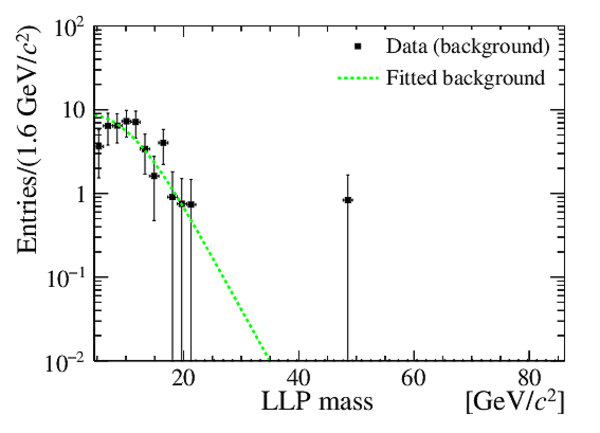
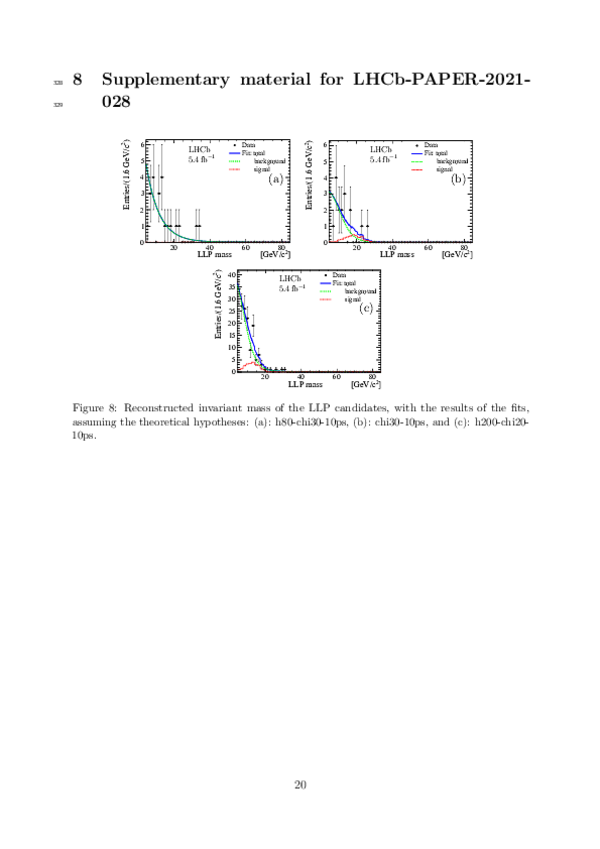
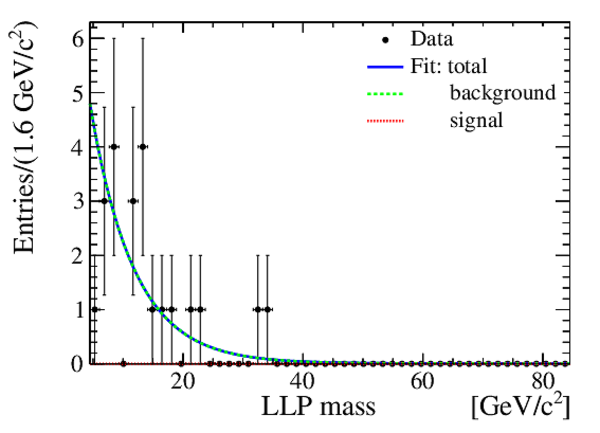
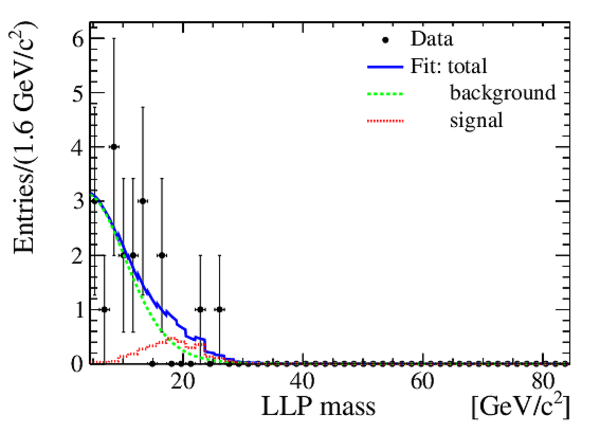
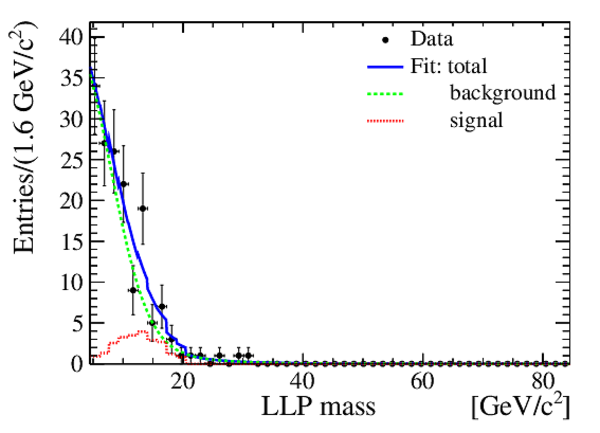
Reconstructed invariant mass of the LLP candidates. Subfigures (a), (c), and (e) correspond to the signal selections which assume the models h80-chi30-10ps, h200-chi20-10ps, and the non-resonant model chi30-10ps, respectively. Subfigures (b), (d), and (f) are the corresponding distributions for candidates selected in the background region. The results of the fits are superimposed. |
fig3-a.pdf [15 KiB] HiDef png [155 KiB] Thumbnail [132 KiB] *.C file |
|
|
fig3-b.pdf [16 KiB] HiDef png [153 KiB] Thumbnail [138 KiB] *.C file |
|
|
|
fig3-c.pdf [16 KiB] HiDef png [171 KiB] Thumbnail [138 KiB] *.C file |
|
|
|
fig3-d.pdf [16 KiB] HiDef png [145 KiB] Thumbnail [130 KiB] *.C file |
|
|
|
fig3-e.pdf [16 KiB] HiDef png [168 KiB] Thumbnail [139 KiB] *.C file |
|
|
|
fig3-f.pdf [15 KiB] HiDef png [139 KiB] Thumbnail [127 KiB] *.C file |
|
|
|
Expected (open dots and 1$\sigma$ and 2$\sigma$ bands) and observed (full dots) cross-section times branching fraction upper limits (95% CL) as a function of m$_{\tilde{\chi}^{0}_{1} }$ for the resonant production processes with $ m_{h^0} =125\text{ Ge V /}c^2 $, and, from (a) to (g), $\tau_{\tilde{\chi}^{0}_{1} }$ of 5, 10, 20, 30, 50, 100, and 200 $\text{ ps}$ . |
[Failure to get the plot] | [Failure to get the plot] | [Failure to get the plot] | [Failure to get the plot] | [Failure to get the plot] | [Failure to get the plot] | [Failure to get the plot] |
|
Expected (open dots and 1$\sigma$ and 2$\sigma$ bands) and observed (full dots) cross-section times branching fraction upper limits (95% CL) as a function of $\tau_{\tilde{\chi}^{0}_{1} }$ for the resonant production with $ m_{h^0} =125\text{ Ge V /}c^2 $, and, from (a) to (e), $m_{\tilde{\chi}^{0}_{1} }$ of 20, 30, 40, 50, and 60 $\text{ Ge V /}c^2$ . |
[Failure to get the plot] | [Failure to get the plot] | [Failure to get the plot] | [Failure to get the plot] | [Failure to get the plot] |
|
Expected (open dots and 1$\sigma$ and 2$\sigma$ bands) and observed (full dots) cross-section times branching fraction upper limits (95% CL) as a function of $ m_{h^0}$ and, from from (a) to (f), $m_{\tilde{\chi}^{0}_{1} }$ of 10, 20, 30, 40, 50, and 60 $\text{ Ge V /}c^2$ . |
[Failure to get the plot] | [Failure to get the plot] | [Failure to get the plot] | [Failure to get the plot] | [Failure to get the plot] | [Failure to get the plot] |
|
Expected (open dots and 1$\sigma$ and 2$\sigma$ bands) and observed (full dots) cross-section times branching fraction upper limits (95% CL), (a): as a function of $\tau_{\tilde{\chi}^{0}_{1} }$ with $m_{\tilde{\chi}^{0}_{1} }=30\text{ Ge V /}c^2 $, (b): as a function of $m_{\tilde{\chi}^{0}_{1} }$ with $\tau_{\tilde{\chi}^{0}_{1} }=10\text{ ps} $. The processes are from direct, non-resonant, LLP production. |
[Failure to get the plot] | [Failure to get the plot] |
|
Animated gif made out of all figures. |
PAPER-2021-028.gif Thumbnail |

|
Tables and captions
|
Signal detection efficiency, in percent, after preselection, $\varepsilon _{presel}$, including the geometrical acceptance, and after MVA selection, $\varepsilon $, and numbers of fitted signal and background events in the signal region, $N_{\rm s}$ and $N_{\rm b}$, for the different signal hypotheses for the LLP non-resonant production models (masses units are $\text{ Ge V /}c^2$ , lifetimes in $\text{ ps}$ ). The last column gives the value of $\chi^2$ per degree of freedom, ndf, from the fit. |
Table_1.pdf [64 KiB] HiDef png [84 KiB] Thumbnail [39 KiB] tex code |

|
|
Contributions to the relative systematic uncertainties. The indicated ranges cover the theoretical models considered. The contributions from the signal and background models used in the LLP mass fit are treated separately. |
Table_2.pdf [55 KiB] HiDef png [84 KiB] Thumbnail [37 KiB] tex code |

|
|
Upper limits at 95% CL on the production cross-section times branching ratio for signal models with a non-resonant production. Masses are given in $\text{ Ge V /}c^2$ , lifetimes in $\text{ ps}$ , cross-sections in $\text{ pb}$ . |
Table_3.pdf [62 KiB] HiDef png [101 KiB] Thumbnail [45 KiB] tex code |

|
Supplementary Material [file]
![HiDef png [29 KiB]](Directory_LHCb-PAPER-2021-028/hidef_fig1.png)
![HiDef png [156 KiB]](Directory_LHCb-PAPER-2021-028/hidef_fig2-a.png)
![HiDef png [136 KiB]](Directory_LHCb-PAPER-2021-028/hidef_fig2-b.png)
![HiDef png [135 KiB]](Directory_LHCb-PAPER-2021-028/hidef_fig2-c.png)
![HiDef png [144 KiB]](Directory_LHCb-PAPER-2021-028/hidef_fig2-d.png)
![HiDef png [127 KiB]](Directory_LHCb-PAPER-2021-028/hidef_fig2-e.png)
![HiDef png [208 KiB]](Directory_LHCb-PAPER-2021-028/hidef_fig2-f.png)
![HiDef png [139 KiB]](Directory_LHCb-PAPER-2021-028/hidef_fig2-g.png)
![HiDef png [168 KiB]](Directory_LHCb-PAPER-2021-028/hidef_fig2-h.png)
![HiDef png [192 KiB]](Directory_LHCb-PAPER-2021-028/hidef_fig2-i.png)
![HiDef png [163 KiB]](Directory_LHCb-PAPER-2021-028/hidef_fig2-j.png)
![HiDef png [155 KiB]](Directory_LHCb-PAPER-2021-028/hidef_fig3-a.png)
![HiDef png [153 KiB]](Directory_LHCb-PAPER-2021-028/hidef_fig3-b.png)
![HiDef png [171 KiB]](Directory_LHCb-PAPER-2021-028/hidef_fig3-c.png)
![HiDef png [145 KiB]](Directory_LHCb-PAPER-2021-028/hidef_fig3-d.png)
![HiDef png [168 KiB]](Directory_LHCb-PAPER-2021-028/hidef_fig3-e.png)
![HiDef png [139 KiB]](Directory_LHCb-PAPER-2021-028/hidef_fig3-f.png)
![HiDef png [84 KiB]](Directory_LHCb-PAPER-2021-028/hidef_Table_1.png)
![HiDef png [84 KiB]](Directory_LHCb-PAPER-2021-028/hidef_Table_2.png)
![HiDef png [101 KiB]](Directory_LHCb-PAPER-2021-028/hidef_Table_3.png)
![HiDef png [191 KiB]](Directory_LHCb-PAPER-2021-028/supplementary/hidef_fig8-a.png)
![HiDef png [189 KiB]](Directory_LHCb-PAPER-2021-028/supplementary/hidef_fig8-b.png)
![HiDef png [207 KiB]](Directory_LHCb-PAPER-2021-028/supplementary/hidef_fig8-c.png)
Created on 20 April 2024.