Simultaneous determination of CKM angle $\gamma$ and charm mixing parameters
[to restricted-access page]Information
LHCb-PAPER-2021-033
CERN-EP-2021-183
arXiv:2110.02350 [PDF]
(Submitted on 05 Oct 2021)
JHEP 12 (2021) 141
Inspire 1939295
Tools
Abstract
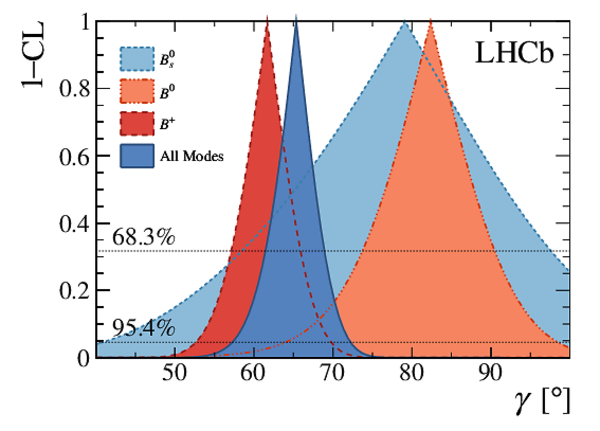
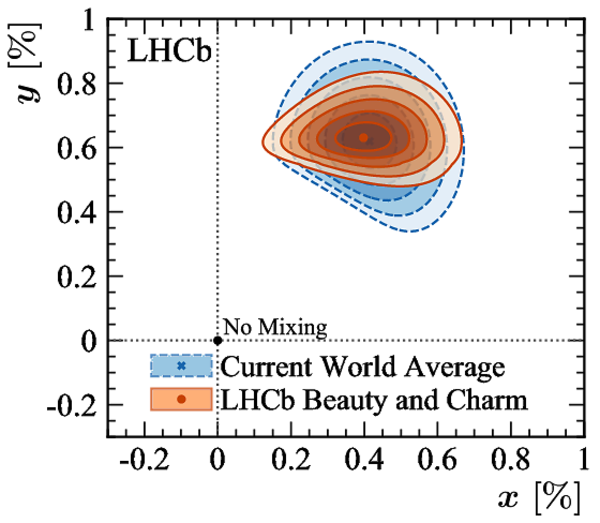
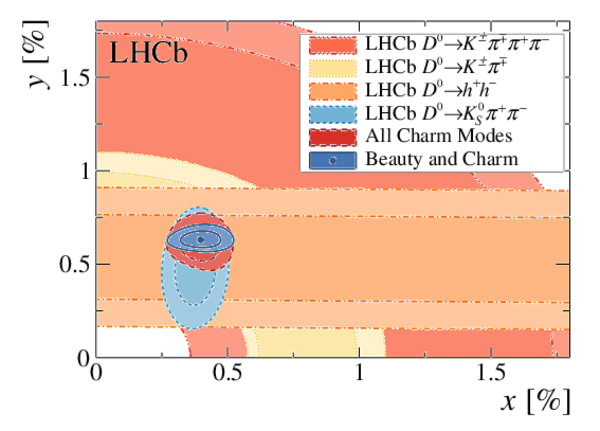
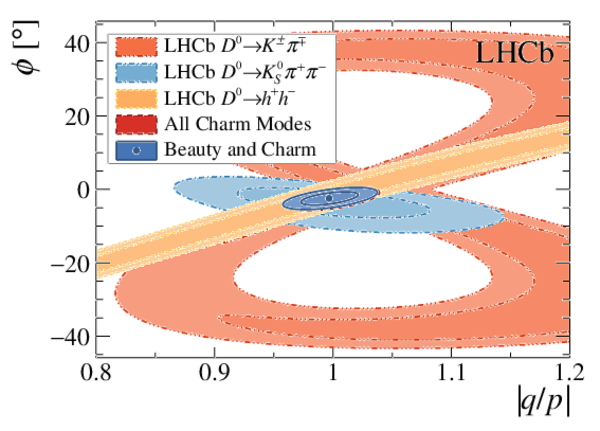
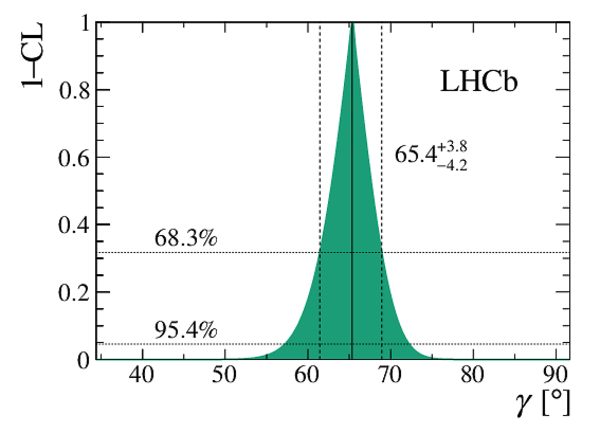
A combination of measurements sensitive to the $CP$ violation angle $\gamma$ of the Cabibbo-Kobayashi-Maskawa unitarity triangle and to the charm mixing parameters that describe oscillations between $D^0$ and $\bar{D}^0$ mesons is performed. Results from the charm and beauty sectors, based on data collected with the LHCb detector at CERN's Large Hadron Collider, are combined for the first time. This method provides an improvement on the precision of the charm mixing parameter $y$ by a factor of two with respect to the current world average. The charm mixing parameters are determined to be $x = (0.400^{ +0.052}_{ -0.053})\%$ and $y = (0.630^{ +0.033}_{ -0.030})\%$. The angle $\gamma$ is found to be $\gamma = (65.4^{ +3.8}_{ -4.2})^\circ$ and is the most precise determination from a single experiment.
Figures and captions
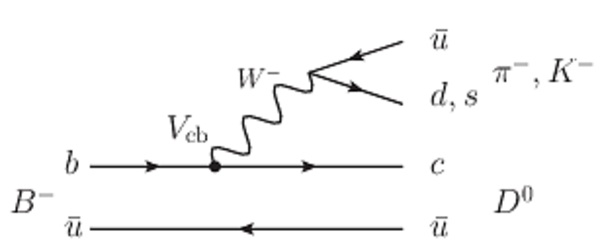

![HiDef png [123 KiB]](Directory_LHCb-PAPER-2021-033/hidef_feynman_b2c.png)
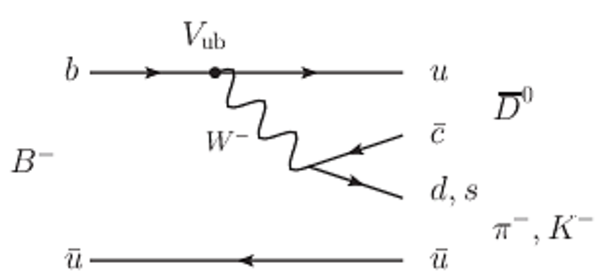
![HiDef png [124 KiB]](Directory_LHCb-PAPER-2021-033/hidef_feynman_b2u.png)
![HiDef png [431 KiB]](Directory_LHCb-PAPER-2021-033/hidef_gammacharm_lhcb_comp_flavour.png)
![HiDef png [505 KiB]](Directory_LHCb-PAPER-2021-033/hidef_gammacharm_lhcb_xD_yD.png)
![HiDef png [716 KiB]](Directory_LHCb-PAPER-2021-033/hidef_gammacharm_lhcb_qopD_phiD.png)
![HiDef png [427 KiB]](Directory_LHCb-PAPER-2021-033/hidef_gammacharm_lhcb_dhch_g_r_dk.png)
![HiDef png [422 KiB]](Directory_LHCb-PAPER-2021-033/hidef_gammacharm_lhcb_dhch_g_d_dk.png)
![HiDef png [566 KiB]](Directory_LHCb-PAPER-2021-033/hidef_gammacharm_lhcb_dhch_g_r_dpi.png)
![HiDef png [462 KiB]](Directory_LHCb-PAPER-2021-033/hidef_gammacharm_lhcb_dhch_g_d_dpi.png)
![HiDef png [542 KiB]](Directory_LHCb-PAPER-2021-033/hidef_gammacharm_lhcb_dhch_g_r_dkstz.png)
![HiDef png [590 KiB]](Directory_LHCb-PAPER-2021-033/hidef_gammacharm_lhcb_dhch_g_d_dkstz.png)
![HiDef png [497 KiB]](Directory_LHCb-PAPER-2021-033/hidef_gammacharm_lhcb_comp_rD_dD.png)
![HiDef png [488 KiB]](Directory_LHCb-PAPER-2021-033/hidef_gammacharm_lhcb_comp_xD_yD.png)
![HiDef png [761 KiB]](Directory_LHCb-PAPER-2021-033/hidef_gammacharm_lhcb_comp_qopD_phiD.png)
![HiDef png [133 KiB]](Directory_LHCb-PAPER-2021-033/hidef_pulls_glwads-dh-hh-dmixUID0.png)
![HiDef png [159 KiB]](Directory_LHCb-PAPER-2021-033/hidef_pulls_glwads-dh-h3pi-dmixUID1.png)
![HiDef png [154 KiB]](Directory_LHCb-PAPER-2021-033/hidef_pulls_glwads-dkdpi-kskpi-dmixUID4.png)
![HiDef png [228 KiB]](Directory_LHCb-PAPER-2021-033/hidef_pulls_glwads-dh-hhpi0-dmixUID2.png)
![HiDef png [215 KiB]](Directory_LHCb-PAPER-2021-033/hidef_pulls_glwads-dkst-hh-h3pi-dmix-newvarsUID6.png)
![HiDef png [220 KiB]](Directory_LHCb-PAPER-2021-033/hidef_pulls_glwads-dkstz-hh-h3pi-dmixUID7.png)
![HiDef png [263 KiB]](Directory_LHCb-PAPER-2021-033/hidef_pulls_glwads-dsth-hh-dmixUID5.png)
![HiDef png [186 KiB]](Directory_LHCb-PAPER-2021-033/hidef_pulls_glwads-dhpipi-hh-dmixUID9.png)
![HiDef png [99 KiB]](Directory_LHCb-PAPER-2021-033/hidef_pulls_ggsz-dhUID3.png)
![HiDef png [83 KiB]](Directory_LHCb-PAPER-2021-033/hidef_pulls_ggsz_dkstz_lhcb_mdUID8.png)
![HiDef png [39 KiB]](Directory_LHCb-PAPER-2021-033/hidef_pulls_dmpiUID12.png)
![HiDef png [78 KiB]](Directory_LHCb-PAPER-2021-033/hidef_pulls_dskUID10.png)
![HiDef png [83 KiB]](Directory_LHCb-PAPER-2021-033/hidef_pulls_dskpipiUID11.png)
![HiDef png [62 KiB]](Directory_LHCb-PAPER-2021-033/hidef_pulls_charm-kspipi-nocpvUID13.png)
![HiDef png [85 KiB]](Directory_LHCb-PAPER-2021-033/hidef_pulls_charm-kspipiUID14.png)
![HiDef png [85 KiB]](Directory_LHCb-PAPER-2021-033/hidef_pulls_charm-kspipiUID15.png)
![HiDef png [51 KiB]](Directory_LHCb-PAPER-2021-033/hidef_pulls_Charm_ycp_minus_ycp_rs_lhcb-r1UID28.png)
![HiDef png [50 KiB]](Directory_LHCb-PAPER-2021-033/hidef_pulls_charm-dy-rsUID29.png)
![HiDef png [55 KiB]](Directory_LHCb-PAPER-2021-033/hidef_pulls_charm-k3piUID18.png)
![HiDef png [93 KiB]](Directory_LHCb-PAPER-2021-033/hidef_pulls_charm-kpiUID16.png)
![HiDef png [92 KiB]](Directory_LHCb-PAPER-2021-033/hidef_pulls_charm-kpiUID30.png)
![HiDef png [49 KiB]](Directory_LHCb-PAPER-2021-033/hidef_pulls_charm-deltaacp-diffUID17.png)
![HiDef png [169 KiB]](Directory_LHCb-PAPER-2021-033/hidef_gammacharm_lhcb_g.png)
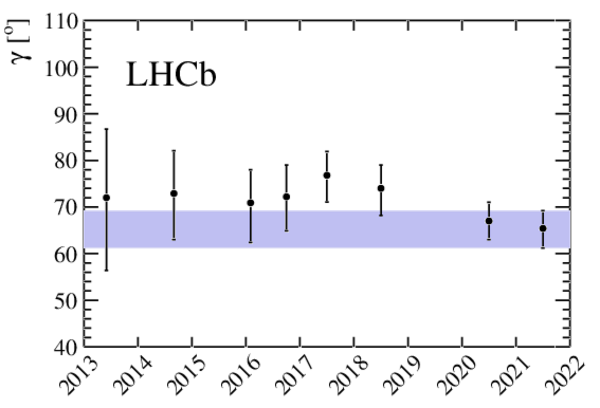
![HiDef png [148 KiB]](Directory_LHCb-PAPER-2021-033/hidef_gamma_evolution.png)
Tables and captions
|
Measurements used in the combination. Inputs from the charm system appear in the lower part of the table. Those that are new, or that have changed, since the previous combination [17] are highlighted in bold. Measurements denoted by (*) include only a fraction of the Run 2 sample, corresponding to data taken in 2015 and 2016. Where multiple references are cited, measured values are taken from the most recent results, which include information from the others. |
Table_1.pdf [84 KiB] HiDef png [182 KiB] Thumbnail [84 KiB] tex code |

|
|
Auxiliary inputs used in the combination. Those highlighted in bold have changed since the previous combination [17]. |
Table_2.pdf [99 KiB] HiDef png [78 KiB] Thumbnail [34 KiB] tex code |

|
|
Confidence intervals and central values for each of the parameters of interest. Entries marked with an asterisk show where the scan has hit a physical boundary at the lower limit. |
Table_3.pdf [99 KiB] HiDef png [270 KiB] Thumbnail [123 KiB] tex code |

|
|
Confidence intervals and best-fit values for $\gamma $ when splitting the combination inputs by initial $B$ meson species. |
Table_4.pdf [63 KiB] HiDef png [42 KiB] Thumbnail [20 KiB] tex code |

|
|
Confidence intervals and best-fit values for $\gamma $ when splitting the combination inputs by time-dependent and time-integrated methods. |
Table_5.pdf [63 KiB] HiDef png [31 KiB] Thumbnail [15 KiB] tex code |

|
|
Reduced correlation matrix for the parameters of greater interest. Values smaller than $0.001$ are replaced with a - symbol. |
Table_6.pdf [52 KiB] HiDef png [54 KiB] Thumbnail [24 KiB] tex code |

|
|
Correlation matrix of the fit result, part 1 of 3. Values smaller than $0.001$ are replaced with a - symbol. |
Table_7.pdf [73 KiB] HiDef png [73 KiB] Thumbnail [29 KiB] tex code |

|
|
Correlation matrix of the fit result, part 2 of 3. Values smaller than $0.001$ are replaced with a - symbol. |
Table_8.pdf [75 KiB] HiDef png [91 KiB] Thumbnail [37 KiB] tex code |

|
|
Correlation matrix of the fit result, part 3 of 3. Values smaller than $0.001$ are replaced with a - symbol. |
Table_9.pdf [74 KiB] HiDef png [50 KiB] Thumbnail [21 KiB] tex code |

|
|
Contributions to the total $\chi^2$ and the number of observables of each input measurement. |
Table_10.pdf [84 KiB] HiDef png [222 KiB] Thumbnail [116 KiB] tex code |

|
![HiDef png [182 KiB]](Directory_LHCb-PAPER-2021-033/hidef_Table_1.png)
![HiDef png [78 KiB]](Directory_LHCb-PAPER-2021-033/hidef_Table_2.png)
![HiDef png [270 KiB]](Directory_LHCb-PAPER-2021-033/hidef_Table_3.png)
![HiDef png [42 KiB]](Directory_LHCb-PAPER-2021-033/hidef_Table_4.png)
![HiDef png [31 KiB]](Directory_LHCb-PAPER-2021-033/hidef_Table_5.png)
![HiDef png [54 KiB]](Directory_LHCb-PAPER-2021-033/hidef_Table_6.png)
![HiDef png [73 KiB]](Directory_LHCb-PAPER-2021-033/hidef_Table_7.png)
![HiDef png [91 KiB]](Directory_LHCb-PAPER-2021-033/hidef_Table_8.png)
![HiDef png [50 KiB]](Directory_LHCb-PAPER-2021-033/hidef_Table_9.png)
![HiDef png [222 KiB]](Directory_LHCb-PAPER-2021-033/hidef_Table_10.png)
Created on 19 April 2024.