Angular Analysis of $D^0 \to \pi^+\pi^-\mu^+\mu^-$ and $D^0 \to K^+K^-\mu^+\mu^-$ Decays and Search for $CP$ Violation
[to restricted-access page]Information
LHCb-PAPER-2021-035
CERN-EP-2021-212
arXiv:2111.03327 [PDF]
(Submitted on 05 Nov 2021)
Phys. Rev. Lett. 128 (2022) 221801
Inspire 1961265
Tools
Abstract
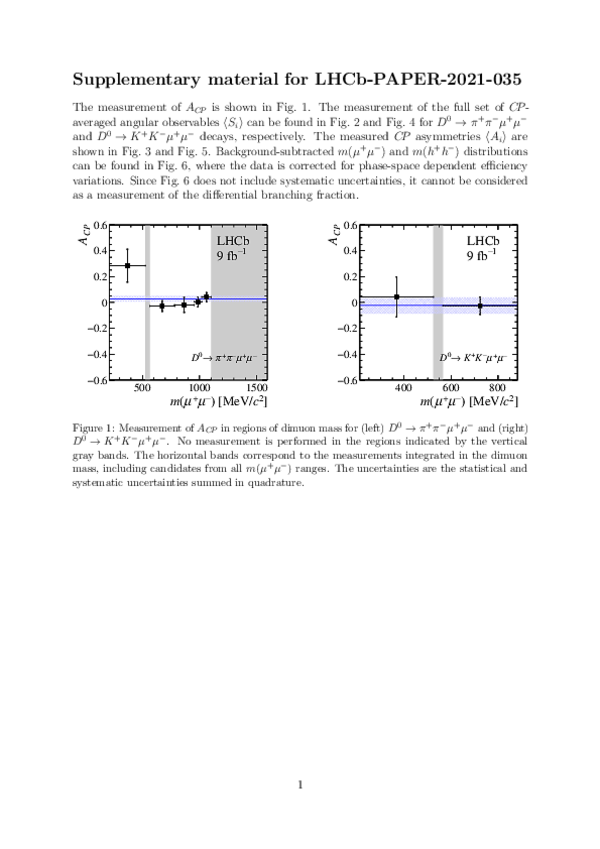
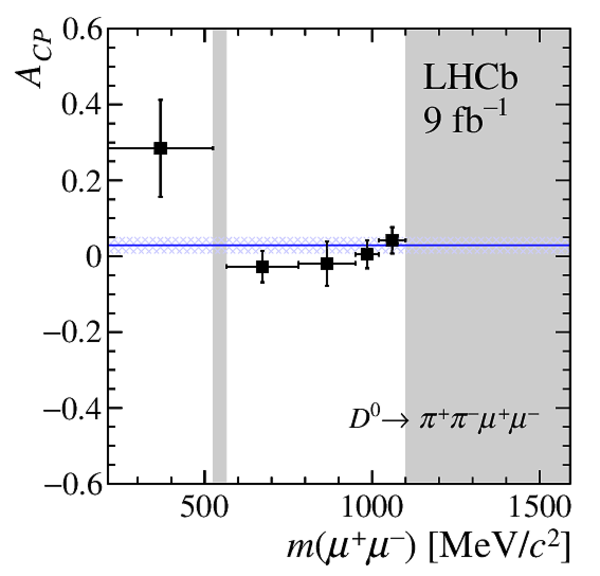
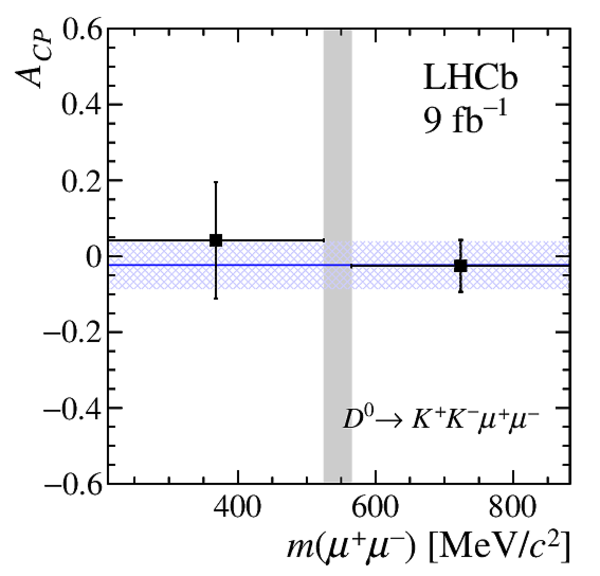
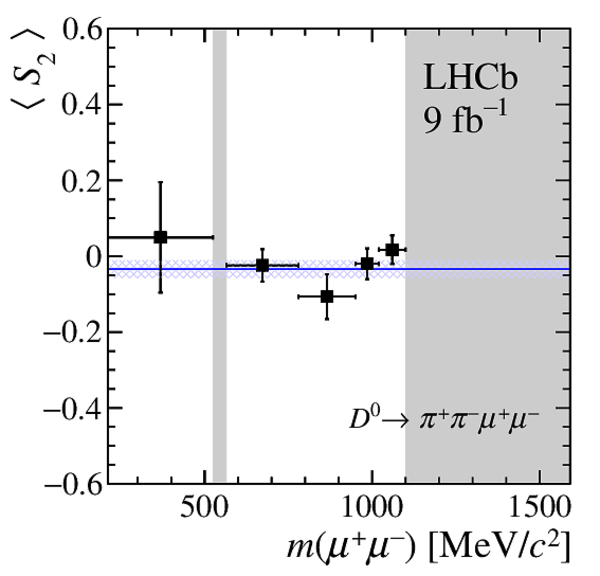
The first full angular analysis and an updated measurement of the decay-rate $CP$ asymmetry of the $D^0 \to \pi^+\pi^-\mu^+\mu^-$ and $D^0 \to K^+K^-\mu^+\mu^-$ decays are reported. The analysis uses proton-proton collision data collected with the LHCb detector at centre-of-mass energies of 7, 8 and 13 TeV. The data set corresponds to an integrated luminosity of 9 fb$^{-1}$. The full set of $CP$-averaged angular observables and their $CP$ asymmetries are measured as a function of the dimuon invariant mass. The results are consistent with expectations from the standard model and with $CP$ symmetry.
Figures and captions
|
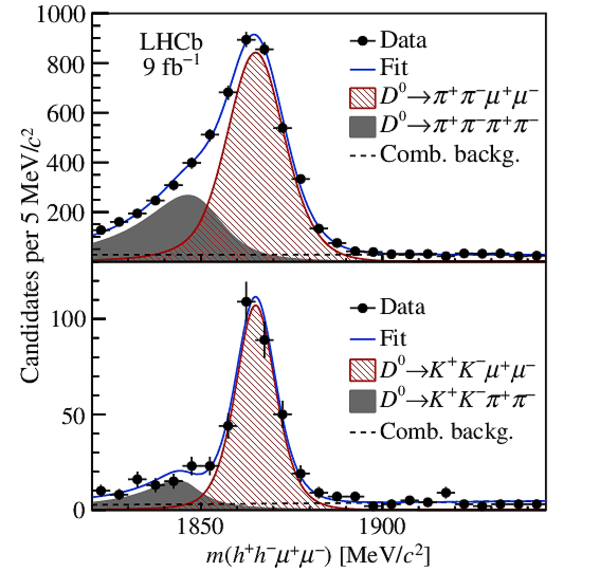
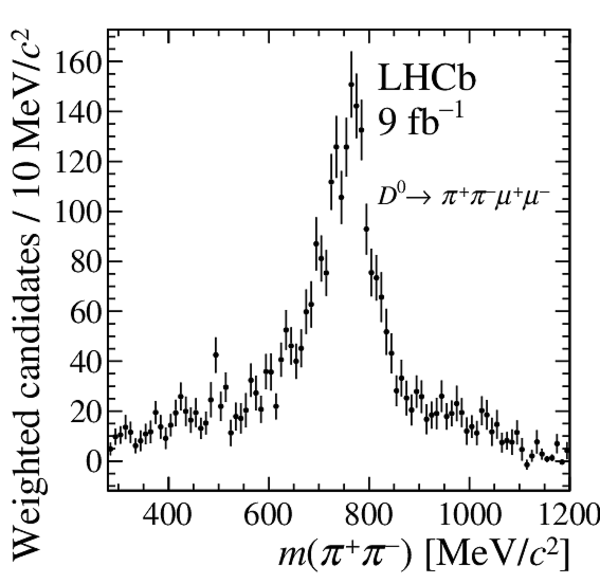
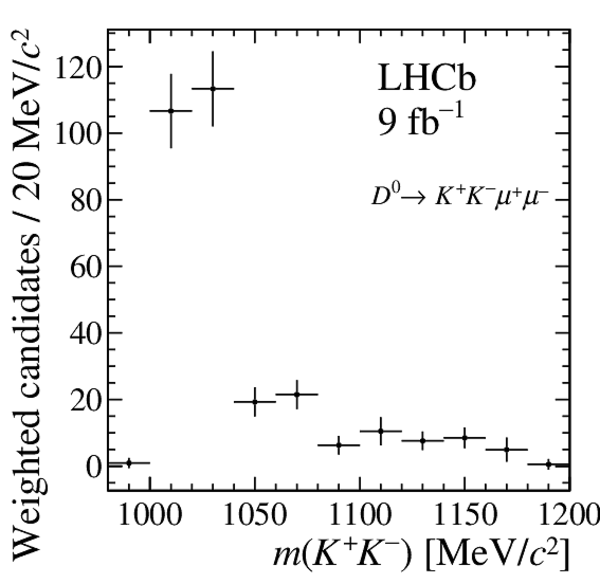
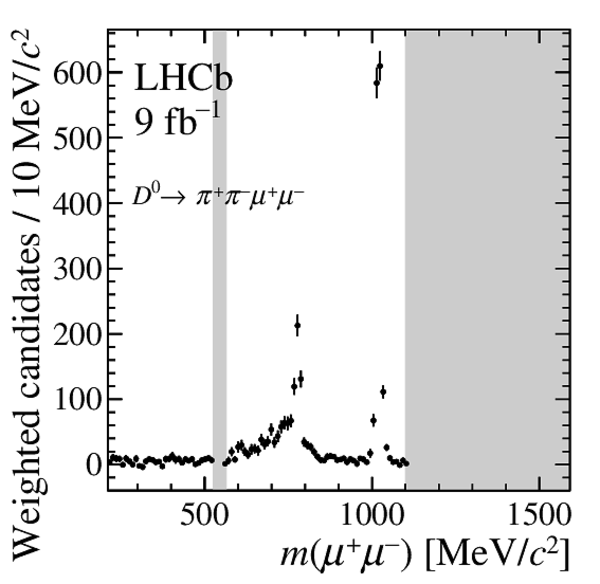
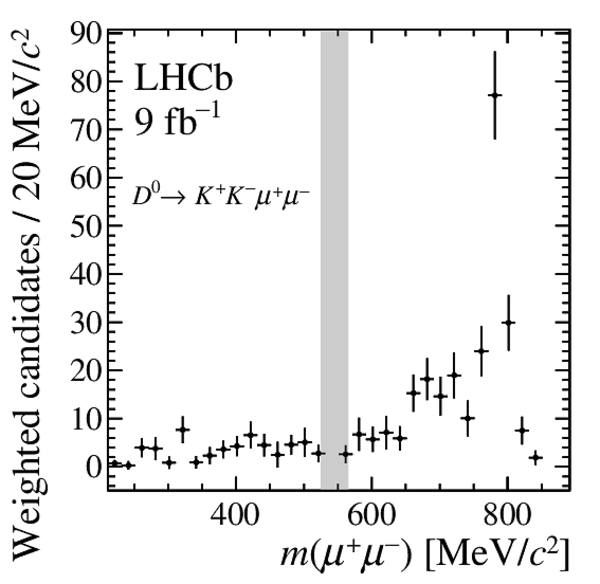
Mass distribution of (top) $ D ^0 \rightarrow \pi ^+ \pi ^- \mu^+\mu^-$ and (bottom) $ D ^0 \rightarrow K ^+ K ^- \mu^+\mu^-$ candidates with fit projections overlaid. |
fig1.pdf [23 KiB] HiDef png [590 KiB] Thumbnail [414 KiB] *.C file |
|
|
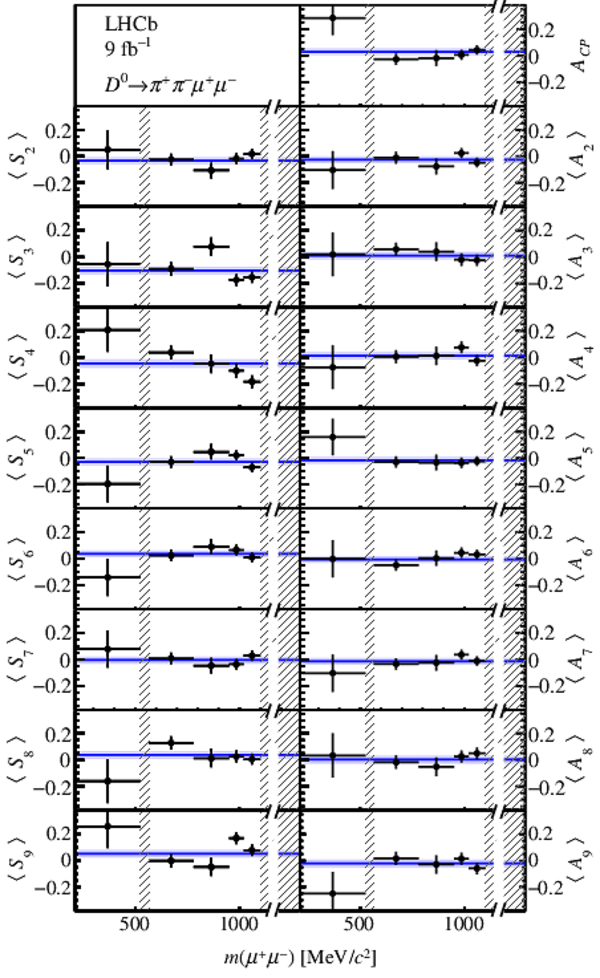
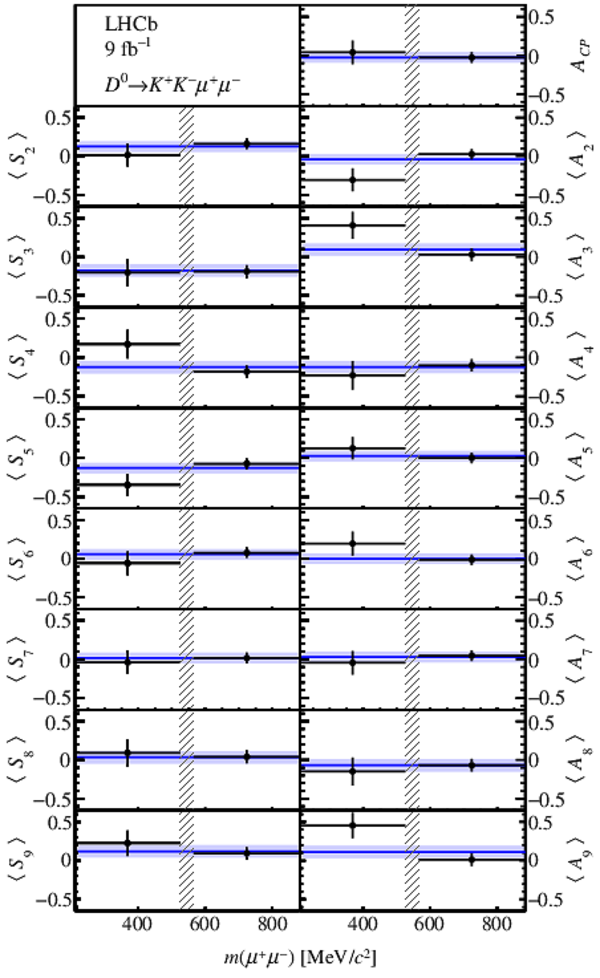
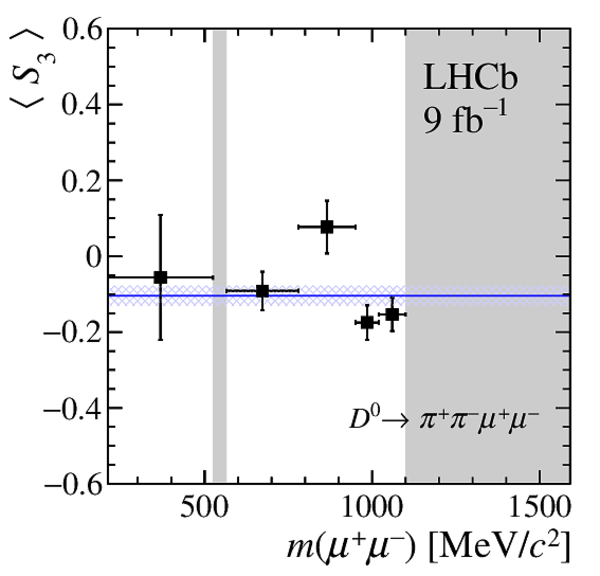
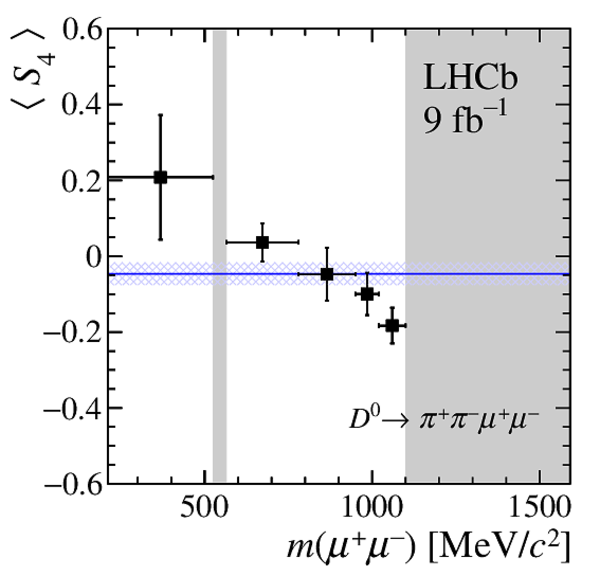
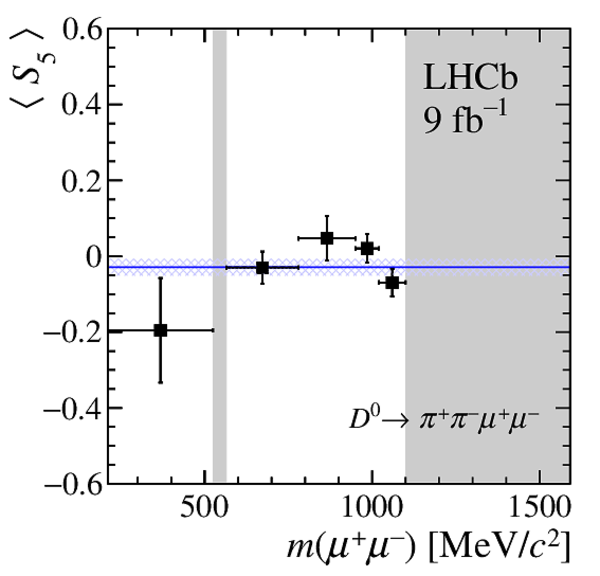
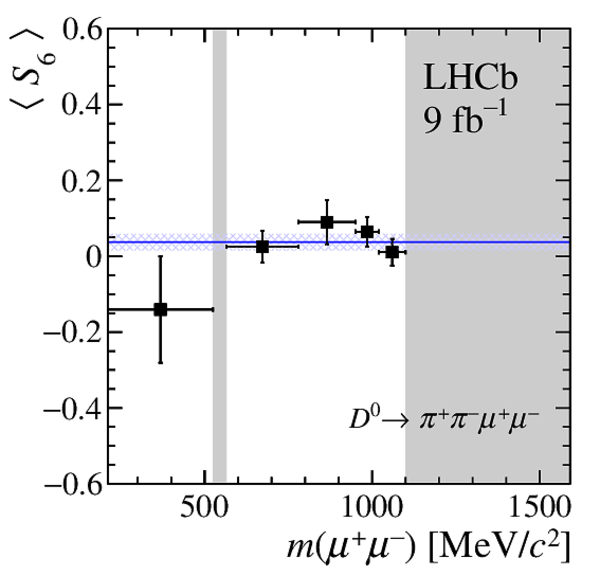
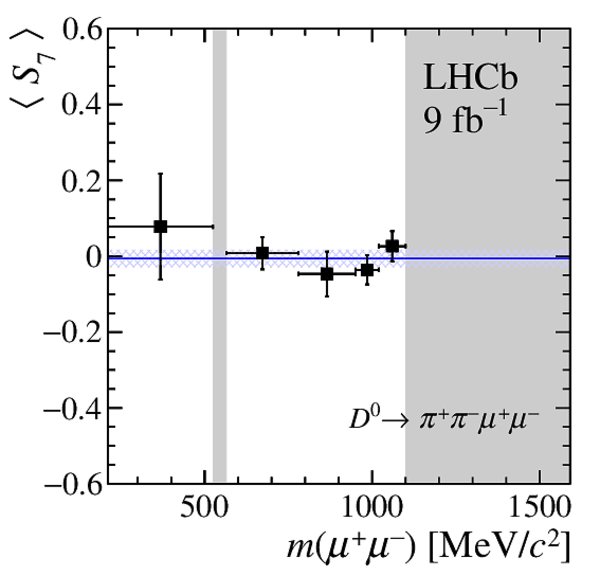
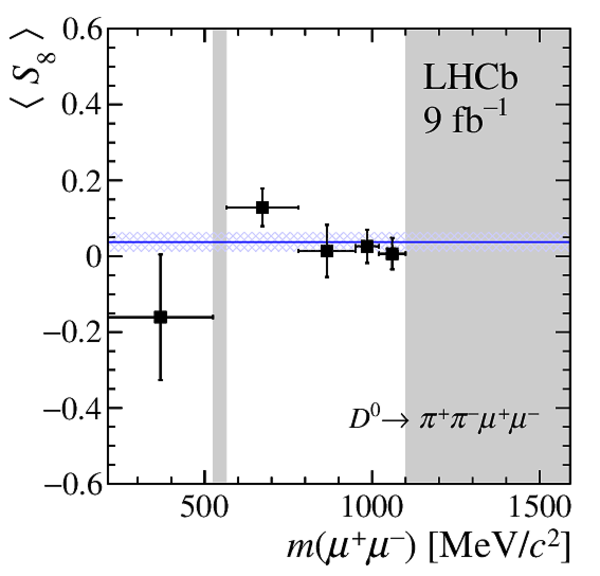
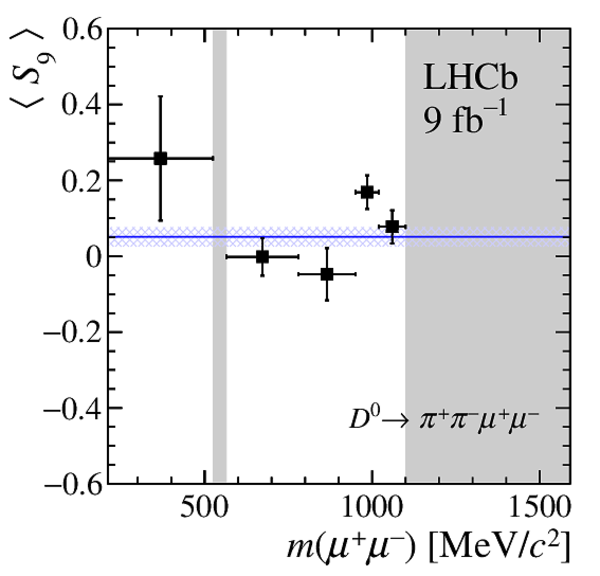
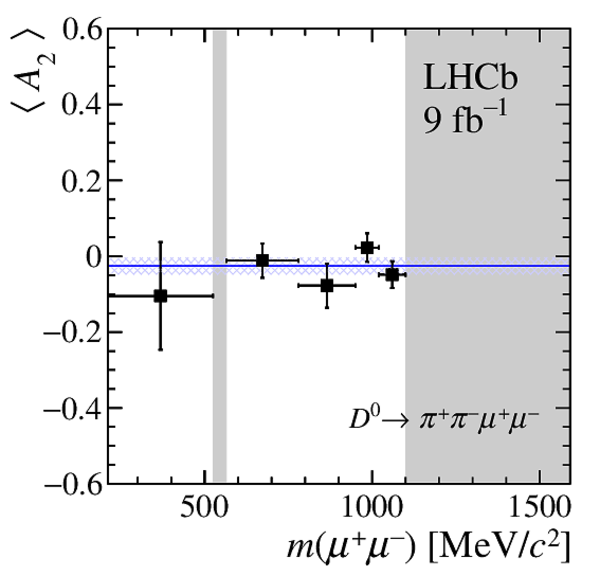
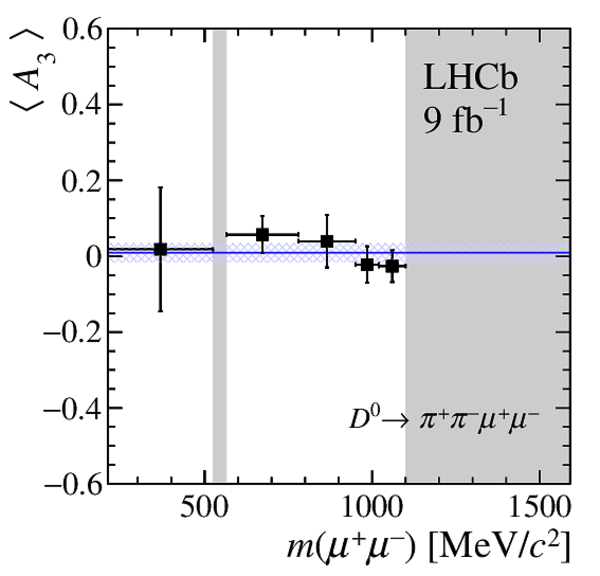
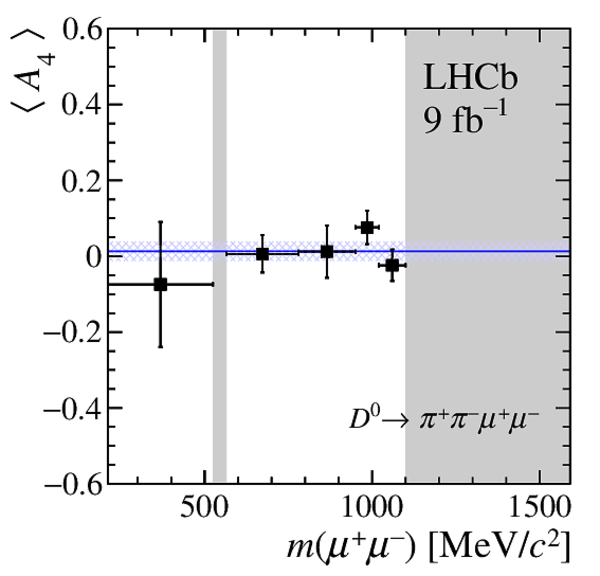
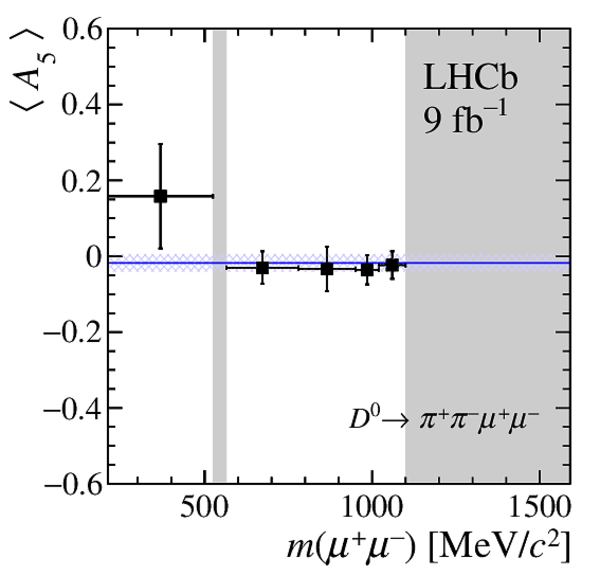
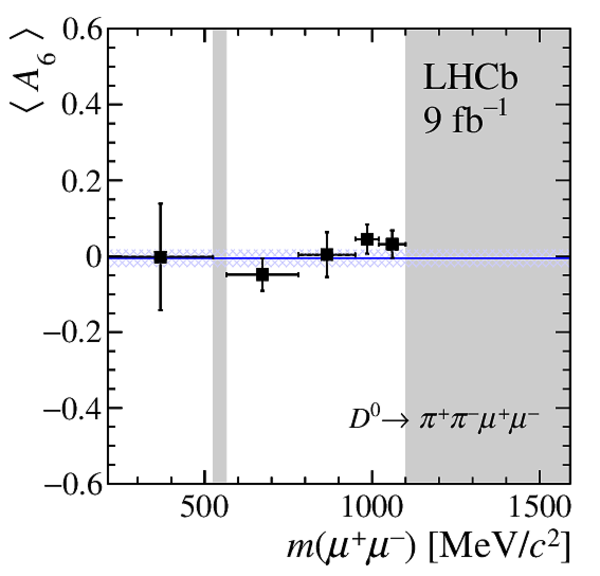
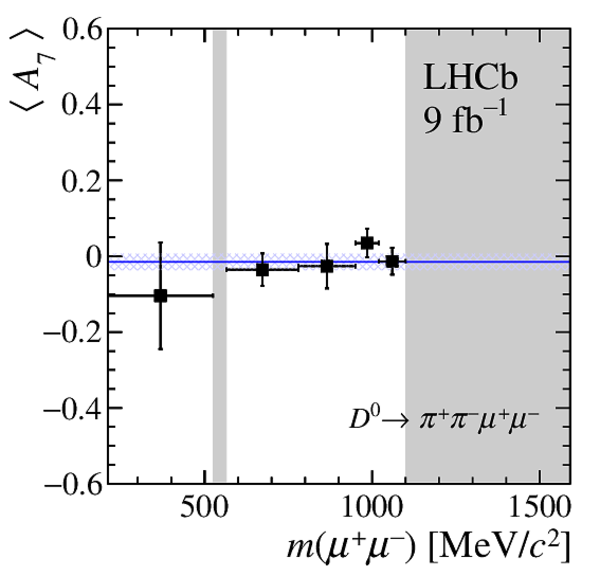
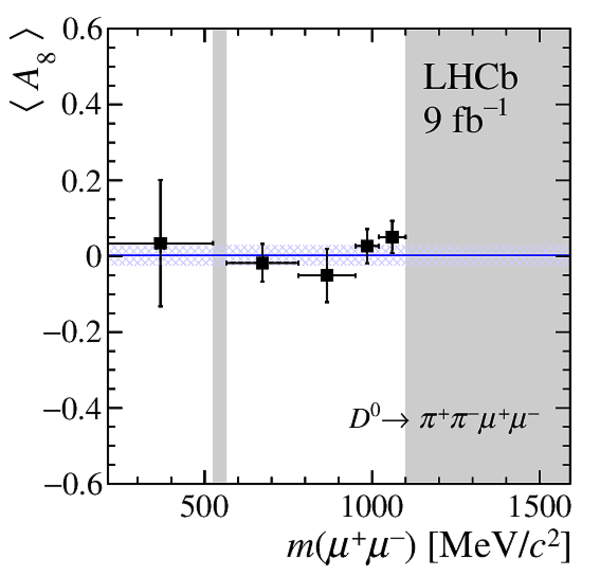
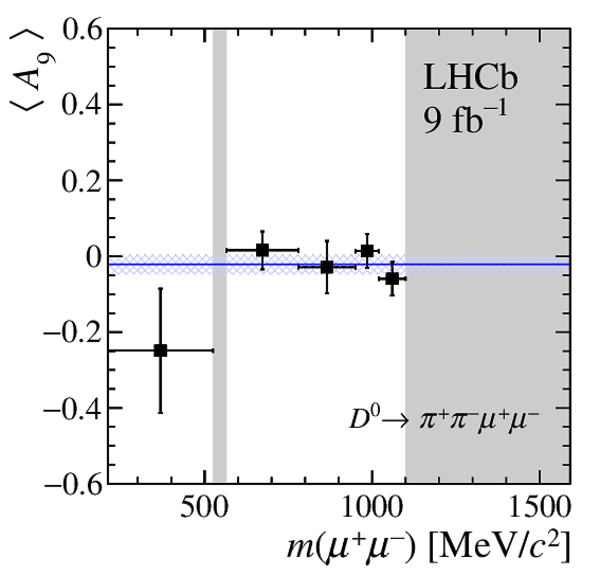
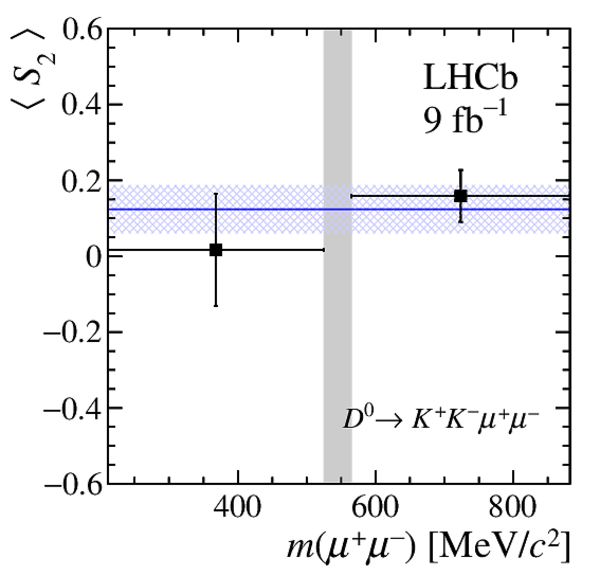
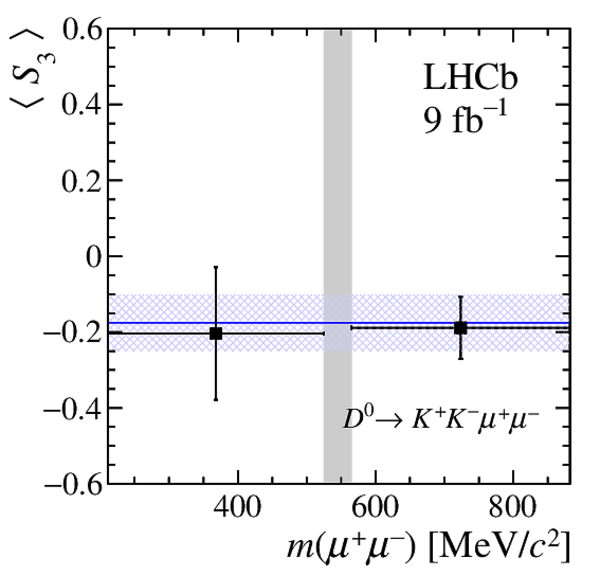
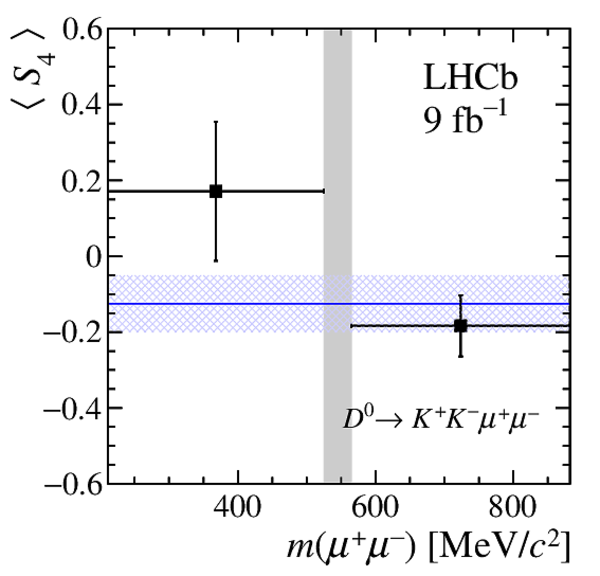
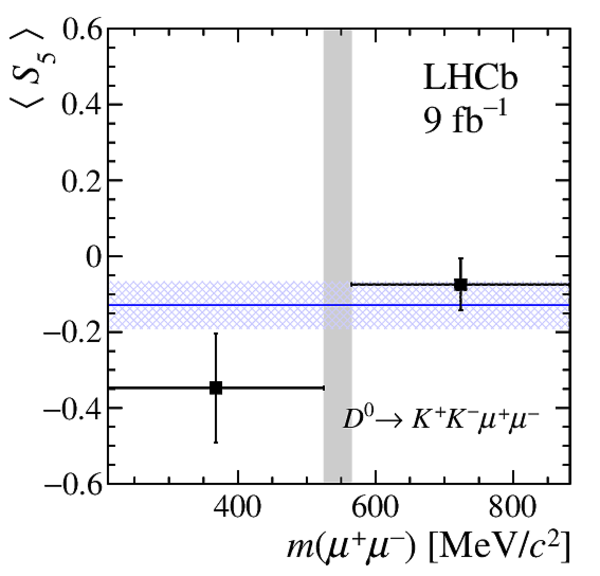
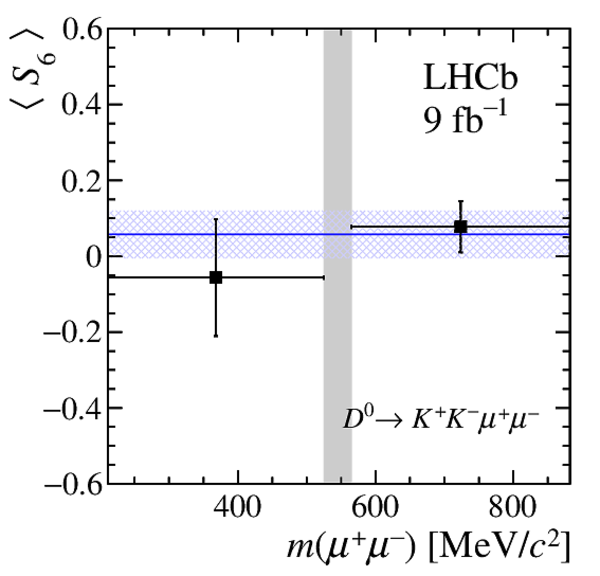
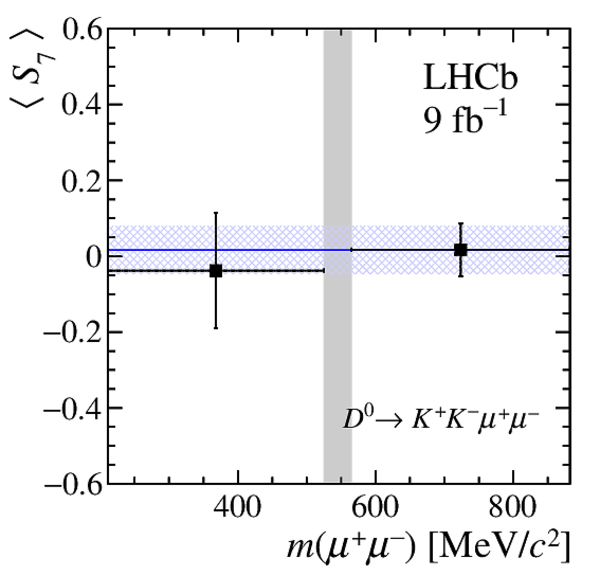
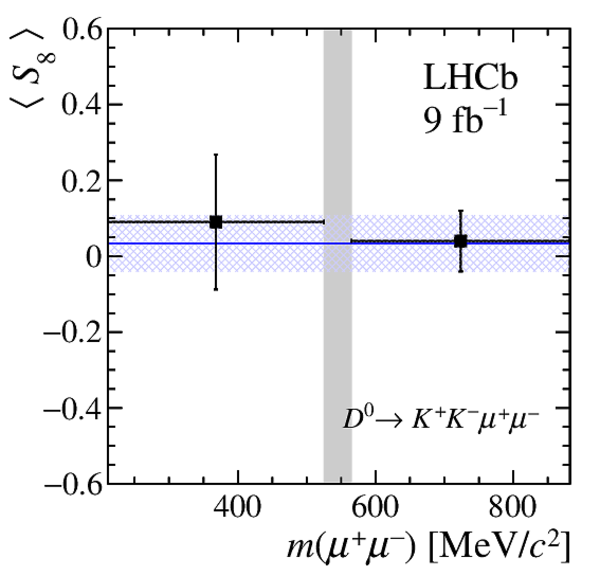
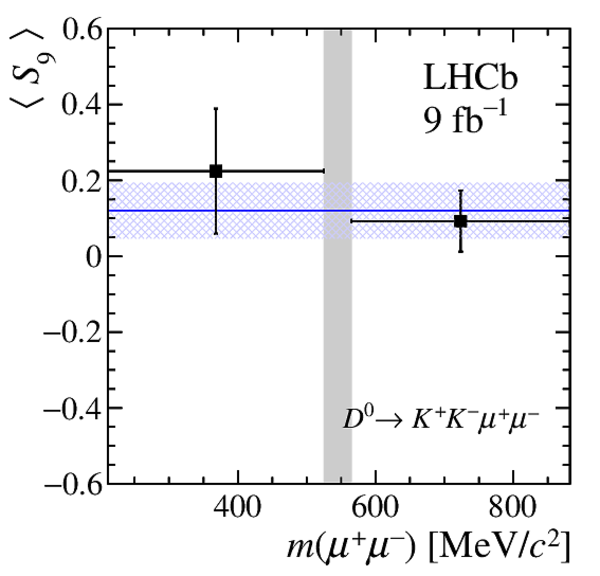
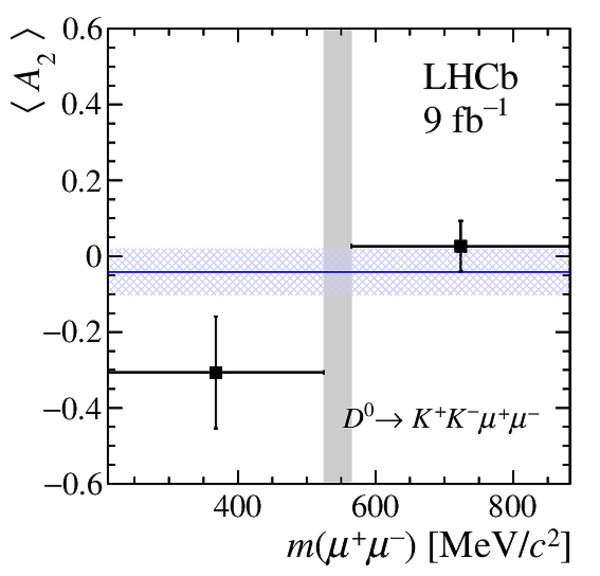
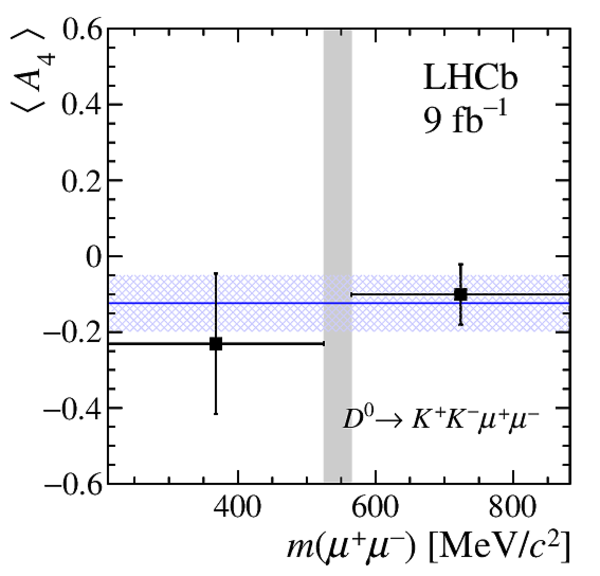
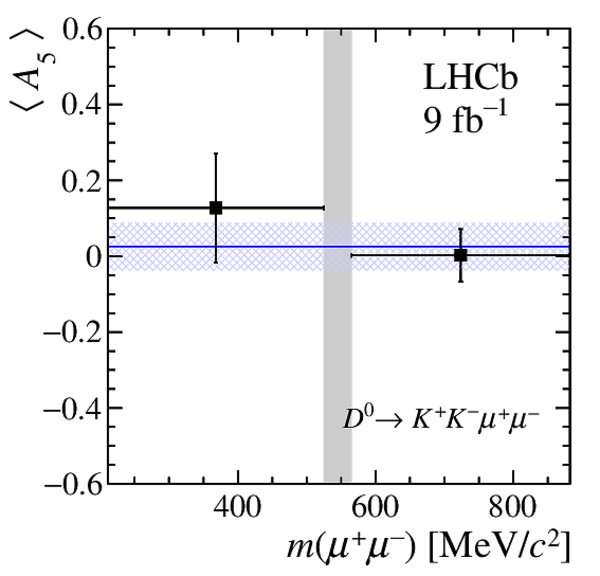
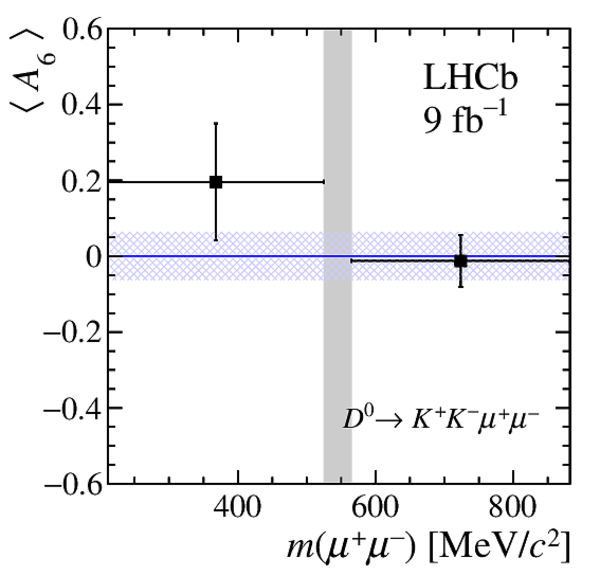
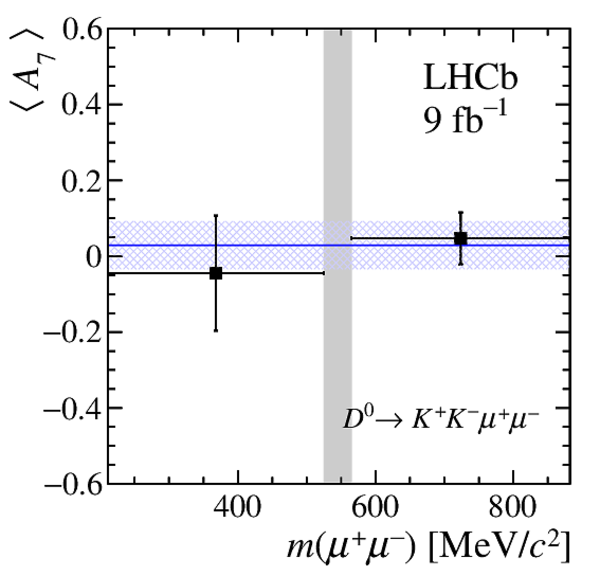
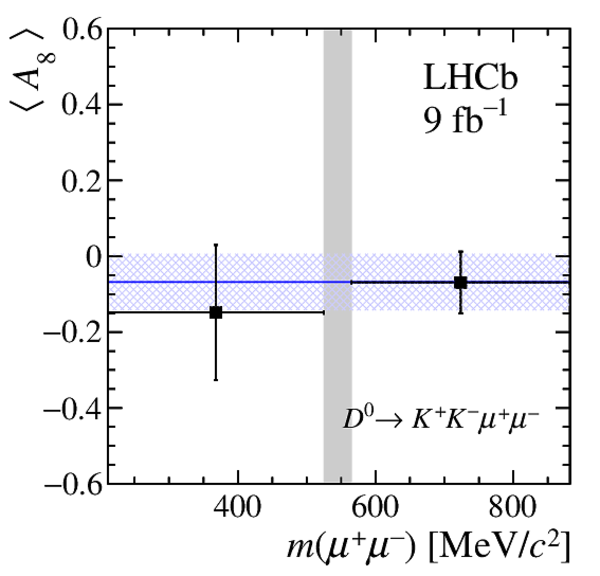
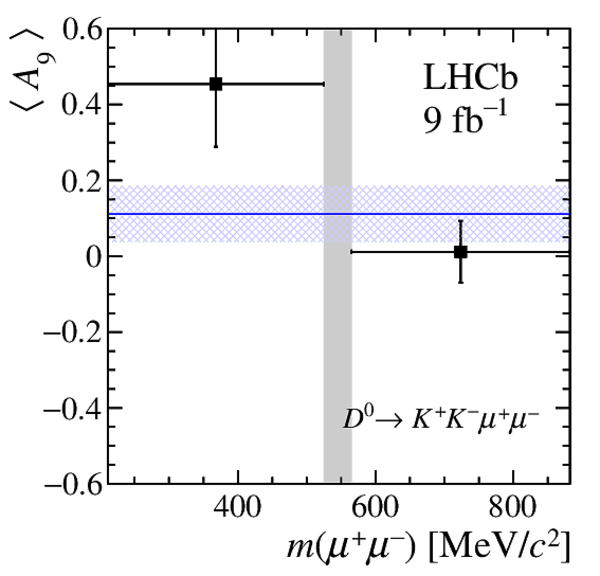
Measured observables for (left) $ D ^0 \rightarrow \pi ^+ \pi ^- \mu^+\mu^-$ and (right) $ D ^0 \rightarrow K ^+ K ^- \mu^+\mu^-$ decays in $ m(\mu ^+ \mu ^- )$ regions. No measurement is performed in the regions indicated by the vertical gray bands. The horizontal bands correspond to the measurements integrated in the dimuon mass, including candidates from all $ m(\mu ^+ \mu ^- )$ ranges. The high-mass region of $ D ^0 \rightarrow \pi ^+ \pi ^- \mu^+\mu^-$ extends to $1590.5\text{ Me V /}c^2 $ and has been truncated on the plots for a clearer visualization of the other regions. |
fig2a.pdf [31 KiB] HiDef png [660 KiB] Thumbnail [783 KiB] *.C file |
|
|
fig2b.pdf [25 KiB] HiDef png [444 KiB] Thumbnail [508 KiB] *.C file |
|
|
|
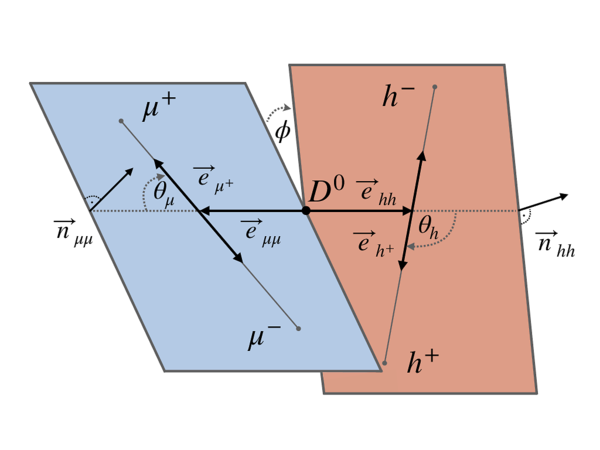
Decay topology of $ D ^0 \rightarrow h^+h^-\mu^+\mu^-$ decays illustrating the definition of the decay angles $\theta_{\mu}$, $\theta_{h}$ and $\phi$. |
fig3.pdf [76 KiB] HiDef png [305 KiB] Thumbnail [146 KiB] *.C file |
|
|
Animated gif made out of all figures. |
PAPER-2021-035.gif Thumbnail |

|
Tables and captions
|
Observable $ A_{ C P }$ for (top) $ D ^0 \rightarrow \pi ^+ \pi ^- \mu^+\mu^-$ and (bottom) $ D ^0 \rightarrow K ^+ K ^- \mu^+\mu^-$ decays in the dimuon-mass regions. The first uncertainty is statistical, the second systematic. |
Table_1.pdf [67 KiB] HiDef png [236 KiB] Thumbnail [104 KiB] tex code |

|
|
Angular observables $\langle S_{\mathrm{i}} \rangle $ for (top) $ D ^0 \rightarrow \pi ^+ \pi ^- \mu^+\mu^-$ and (bottom) $ D ^0 \rightarrow K ^+ K ^- \mu^+\mu^-$ decays in the different dimuon-mass regions reported in the first column. The first uncertainty is statistical and the second systematic. |
Table_2.pdf [62 KiB] HiDef png [81 KiB] Thumbnail [37 KiB] tex code |

|
|
Angular observables $\langle A_{\mathrm{i}} \rangle $ for (top) $ D ^0 \rightarrow \pi ^+ \pi ^- \mu^+\mu^-$ and (bottom) $ D ^0 \rightarrow K ^+ K ^- \mu^+\mu^-$ decays in the different dimuon-mass regions reported in the first column. The first uncertainty is statistical and the second systematic. |
Table_3.pdf [62 KiB] HiDef png [81 KiB] Thumbnail [36 KiB] tex code |

|
|
Correlation matrix for the observables $ A_{ C P } $, $\langle S_i \rangle$ and $\langle A_i \rangle$ for $ D ^0 \rightarrow \pi ^+ \pi ^- \mu^+\mu^-$ decays measured in the dimuon-mass-integrated interval. |
Table_4.pdf [57 KiB] HiDef png [80 KiB] Thumbnail [33 KiB] tex code |

|
|
Correlation matrix for the observables $ A_{ C P } $, $\langle S_i \rangle$ and $\langle A_i \rangle$ for $ D ^0 \rightarrow \pi ^+ \pi ^- \mu^+\mu^-$ decays measured in the interval $m(\mu^+\mu^-) <525 \text{ Me V /}c^2 $. |
Table_5.pdf [57 KiB] HiDef png [81 KiB] Thumbnail [31 KiB] tex code |

|
|
Correlation matrix for the observables $ A_{ C P } $, $\langle S_i \rangle$ and $\langle A_i \rangle$ for $ D ^0 \rightarrow \pi ^+ \pi ^- \mu^+\mu^-$ decays measured in the interval $ 565 < m(\mu^+\mu^-) <780 \text{ Me V /}c^2 $. |
Table_6.pdf [57 KiB] HiDef png [83 KiB] Thumbnail [30 KiB] tex code |

|
|
Correlation matrix for the observables $ A_{ C P } $, $\langle S_i \rangle$ and $\langle A_i \rangle$ for $ D ^0 \rightarrow \pi ^+ \pi ^- \mu^+\mu^-$ decays measured in the interval $780 < m(\mu^+\mu^-) <950 \text{ Me V /}c^2 $. |
Table_7.pdf [57 KiB] HiDef png [80 KiB] Thumbnail [33 KiB] tex code |

|
|
Correlation matrix for the observables $ A_{ C P } $, $\langle S_i \rangle$ and $\langle A_i \rangle$ for $ D ^0 \rightarrow \pi ^+ \pi ^- \mu^+\mu^-$ decays measured in the interval $950 < m(\mu^+\mu^-) <1020 \text{ Me V /}c^2 $. |
Table_8.pdf [57 KiB] HiDef png [80 KiB] Thumbnail [33 KiB] tex code |

|
|
Correlation matrix for the observables $ A_{ C P } $, $\langle S_i \rangle$ and $\langle A_i \rangle$ for $ D ^0 \rightarrow \pi ^+ \pi ^- \mu^+\mu^-$ decays measured in the interval $1020 \text{ Me V /}c^2 < m(\mu^+\mu^-) <1100 \text{ Me V /}c^2 $. |
Table_9.pdf [57 KiB] HiDef png [83 KiB] Thumbnail [30 KiB] tex code |

|
|
Correlation matrix for the observables $ A_{ C P } $, $\langle S_i \rangle$ and $\langle A_i \rangle$ for $ D ^0 \rightarrow K ^+ K ^- \mu^+\mu^-$ decays measured in the dimuon-mass-integrated interval. |
Table_10.pdf [57 KiB] HiDef png [80 KiB] Thumbnail [33 KiB] tex code |

|
|
Correlation matrix for the observables $ A_{ C P } $, $\langle S_i \rangle$ and $\langle A_i \rangle$ for $ D ^0 \rightarrow K ^+ K ^- \mu^+\mu^-$ decays measured in the interval $m(\mu^+\mu^-) <525 \text{ Me V /}c^2 $. |
Table_11.pdf [57 KiB] HiDef png [83 KiB] Thumbnail [31 KiB] tex code |

|
|
Correlation matrix for the observables $ A_{ C P } $, $\langle S_i \rangle$ and $\langle A_i \rangle$ for $ D ^0 \rightarrow K ^+ K ^- \mu^+\mu^-$ decays measured in the interval $m(\mu^+\mu^-) >565 \text{ Me V /}c^2 $. |
Table_12.pdf [57 KiB] HiDef png [79 KiB] Thumbnail [33 KiB] tex code |

|
Supplementary Material [file]

![HiDef png [590 KiB]](Directory_LHCb-PAPER-2021-035/hidef_fig1.png)
![HiDef png [660 KiB]](Directory_LHCb-PAPER-2021-035/hidef_fig2a.png)
![HiDef png [444 KiB]](Directory_LHCb-PAPER-2021-035/hidef_fig2b.png)
![HiDef png [305 KiB]](Directory_LHCb-PAPER-2021-035/hidef_fig3.png)
![HiDef png [236 KiB]](Directory_LHCb-PAPER-2021-035/hidef_Table_1.png)
![HiDef png [81 KiB]](Directory_LHCb-PAPER-2021-035/hidef_Table_2.png)
![HiDef png [81 KiB]](Directory_LHCb-PAPER-2021-035/hidef_Table_3.png)
![HiDef png [80 KiB]](Directory_LHCb-PAPER-2021-035/hidef_Table_4.png)
![HiDef png [81 KiB]](Directory_LHCb-PAPER-2021-035/hidef_Table_5.png)
![HiDef png [83 KiB]](Directory_LHCb-PAPER-2021-035/hidef_Table_6.png)
![HiDef png [80 KiB]](Directory_LHCb-PAPER-2021-035/hidef_Table_7.png)
![HiDef png [80 KiB]](Directory_LHCb-PAPER-2021-035/hidef_Table_8.png)
![HiDef png [83 KiB]](Directory_LHCb-PAPER-2021-035/hidef_Table_9.png)
![HiDef png [80 KiB]](Directory_LHCb-PAPER-2021-035/hidef_Table_10.png)
![HiDef png [83 KiB]](Directory_LHCb-PAPER-2021-035/hidef_Table_11.png)
![HiDef png [79 KiB]](Directory_LHCb-PAPER-2021-035/hidef_Table_12.png)
![HiDef png [442 KiB]](Directory_LHCb-PAPER-2021-035/supplementary/hidef_LHCb-PAPER-2021-035-supplementary.png)
![HiDef png [229 KiB]](Directory_LHCb-PAPER-2021-035/supplementary/hidef_fig1a.png)
![HiDef png [364 KiB]](Directory_LHCb-PAPER-2021-035/supplementary/hidef_fig1b.png)
![HiDef png [234 KiB]](Directory_LHCb-PAPER-2021-035/supplementary/hidef_fig2a.png)
![HiDef png [240 KiB]](Directory_LHCb-PAPER-2021-035/supplementary/hidef_fig2b.png)
![HiDef png [256 KiB]](Directory_LHCb-PAPER-2021-035/supplementary/hidef_fig2c.png)
![HiDef png [228 KiB]](Directory_LHCb-PAPER-2021-035/supplementary/hidef_fig2d.png)
![HiDef png [229 KiB]](Directory_LHCb-PAPER-2021-035/supplementary/hidef_fig2e.png)
![HiDef png [233 KiB]](Directory_LHCb-PAPER-2021-035/supplementary/hidef_fig2f.png)
![HiDef png [239 KiB]](Directory_LHCb-PAPER-2021-035/supplementary/hidef_fig2g.png)
![HiDef png [243 KiB]](Directory_LHCb-PAPER-2021-035/supplementary/hidef_fig2h.png)
![HiDef png [231 KiB]](Directory_LHCb-PAPER-2021-035/supplementary/hidef_fig3a.png)
![HiDef png [239 KiB]](Directory_LHCb-PAPER-2021-035/supplementary/hidef_fig3b.png)
![HiDef png [245 KiB]](Directory_LHCb-PAPER-2021-035/supplementary/hidef_fig3c.png)
![HiDef png [230 KiB]](Directory_LHCb-PAPER-2021-035/supplementary/hidef_fig3d.png)
![HiDef png [231 KiB]](Directory_LHCb-PAPER-2021-035/supplementary/hidef_fig3e.png)
![HiDef png [228 KiB]](Directory_LHCb-PAPER-2021-035/supplementary/hidef_fig3f.png)
![HiDef png [250 KiB]](Directory_LHCb-PAPER-2021-035/supplementary/hidef_fig3g.png)
![HiDef png [243 KiB]](Directory_LHCb-PAPER-2021-035/supplementary/hidef_fig3h.png)
![HiDef png [368 KiB]](Directory_LHCb-PAPER-2021-035/supplementary/hidef_fig4a.png)
![HiDef png [406 KiB]](Directory_LHCb-PAPER-2021-035/supplementary/hidef_fig4b.png)
![HiDef png [405 KiB]](Directory_LHCb-PAPER-2021-035/supplementary/hidef_fig4c.png)
![HiDef png [362 KiB]](Directory_LHCb-PAPER-2021-035/supplementary/hidef_fig4d.png)
![HiDef png [367 KiB]](Directory_LHCb-PAPER-2021-035/supplementary/hidef_fig4e.png)
![HiDef png [367 KiB]](Directory_LHCb-PAPER-2021-035/supplementary/hidef_fig4f.png)
![HiDef png [408 KiB]](Directory_LHCb-PAPER-2021-035/supplementary/hidef_fig4g.png)
![HiDef png [403 KiB]](Directory_LHCb-PAPER-2021-035/supplementary/hidef_fig4h.png)
![HiDef png [362 KiB]](Directory_LHCb-PAPER-2021-035/supplementary/hidef_fig5a.png)
![HiDef png [403 KiB]](Directory_LHCb-PAPER-2021-035/supplementary/hidef_fig5b.png)
![HiDef png [403 KiB]](Directory_LHCb-PAPER-2021-035/supplementary/hidef_fig5c.png)
![HiDef png [365 KiB]](Directory_LHCb-PAPER-2021-035/supplementary/hidef_fig5d.png)
![HiDef png [365 KiB]](Directory_LHCb-PAPER-2021-035/supplementary/hidef_fig5e.png)
![HiDef png [364 KiB]](Directory_LHCb-PAPER-2021-035/supplementary/hidef_fig5f.png)
![HiDef png [407 KiB]](Directory_LHCb-PAPER-2021-035/supplementary/hidef_fig5g.png)
![HiDef png [405 KiB]](Directory_LHCb-PAPER-2021-035/supplementary/hidef_fig5h.png)
![HiDef png [180 KiB]](Directory_LHCb-PAPER-2021-035/supplementary/hidef_fig6a.png)
![HiDef png [141 KiB]](Directory_LHCb-PAPER-2021-035/supplementary/hidef_fig6b.png)
![HiDef png [156 KiB]](Directory_LHCb-PAPER-2021-035/supplementary/hidef_fig6c.png)
![HiDef png [154 KiB]](Directory_LHCb-PAPER-2021-035/supplementary/hidef_fig6d.png)
Created on 13 April 2024.