First measurement of $Z \to \mu^+\mu^-$ angular coefficients in the forward region of $pp$ collisions at $\sqrt{s} = 13$ TeV
[to restricted-access page]Information
LHCb-PAPER-2021-048
CERN-EP-2022-030
arXiv:2203.01602 [PDF]
(Submitted on 03 Mar 2022)
Phys. Rev. Lett. 129 (2022) 091801
Inspire 2045484
Tools
Abstract
The first study of the angular distribution of $\mu^+ \mu^-$ pairs produced in the forward rapidity region via the Drell-Yan reaction $pp \rightarrow \gamma^{*}/Z +X \rightarrow l^+ l^- + X$ is presented, using data collected with the LHCb detector at a centre-of-mass energy of 13TeV, corresponding to an integrated luminosity of 5.1 $\rm{fb}^{-1}$. The coefficients of the five leading terms in the angular distribution are determined as a function of the dimuon transverse momentum and rapidity. The results are compared to various theoretical predictions of the $Z$-boson production mechanism and can also be used to probe transverse-momentum-dependent parton distributions within the proton.
Figures and captions
|
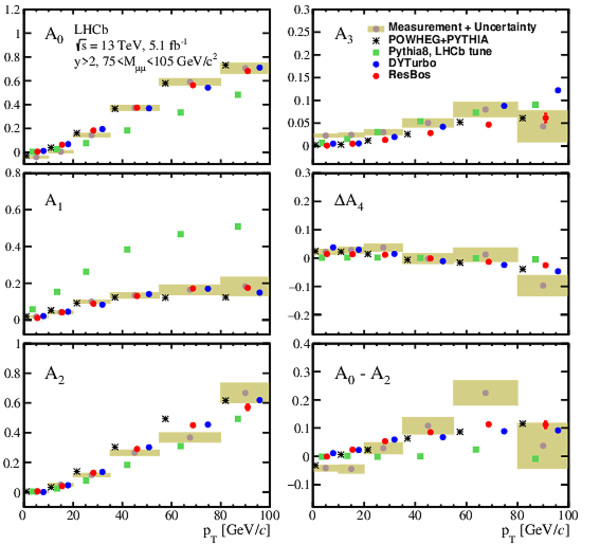
Comparison of the measured angular coefficients with different predictions, as a function of the $ Z $ -boson $ p_{\mathrm{T}}$ , in the rapidity region of $ Z $ -boson $y^Z>2$ and $75<M_{\mu\mu}<105\text{ Ge V /}c^2 $. The total uncertainty (shown in the figure) is dominated by the statistical component. The theoretical predictions correspond to the same $ Z $ -boson $ p_{\mathrm{T}}$ bins as data and the $ p_{\mathrm{T}}$ shifts of the theoretical markers in all plots are for visualization purposes only. {DYTurbo} and ResBos predictions include the theoretical uncertainties. |
Combin[..].pdf [22 KiB] HiDef png [333 KiB] Thumbnail [274 KiB] *.C file |
|
|
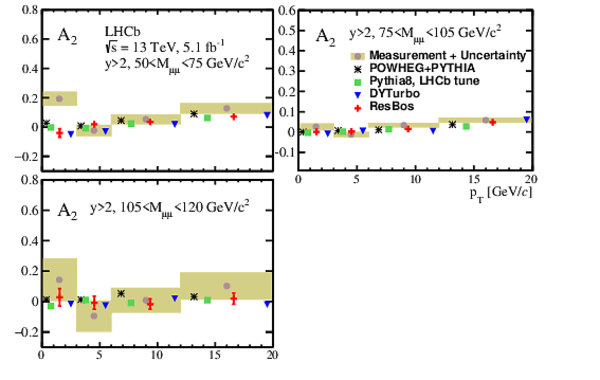
Comparison of the measured angular coefficient $A_{2}$ with different predictions, as a function of the $ Z $ -boson $ p_{\mathrm{T}}$ , in the rapidity region of $ Z $ -boson $y^Z>2$ and $50<M_{\mu\mu}<75\text{ Ge V /}c^2 $ (left), $50<M_{\mu\mu}<75\text{ Ge V /}c^2 $ (middle) and $105<M_{\mu\mu}<120\text{ Ge V /}c^2 $ (right). The total uncertainty (shown in the figure) is dominated by the statistical component. The horizontal positions of the theoretical predictions within the bins are adjusted to increase visibility. {DYTurbo} and ResBos predictions include the theoretical uncertainties. |
Combin[..].pdf [17 KiB] HiDef png [207 KiB] Thumbnail [178 KiB] *.C file |
|
|
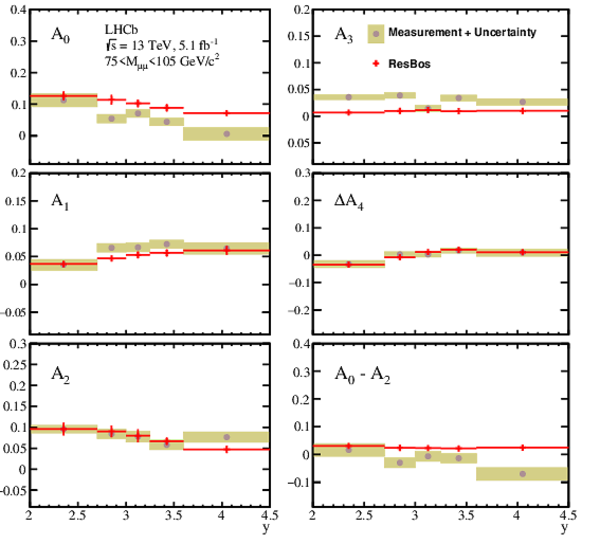
Comparison of the measured angular coefficients with ResBos predictions as a function of the $y^Z$ in the $75<M_{\mu\mu}<105\text{ Ge V /}c^2 $ mass region. The total uncertainty (shown in the figure) is dominated by the statistical component. ResBos predictions include the theoretical uncertainties. |
Combin[..].pdf [20 KiB] HiDef png [238 KiB] Thumbnail [210 KiB] *.C file |
|
|
Animated gif made out of all figures. |
PAPER-2021-048.gif Thumbnail |

|
![HiDef png [333 KiB]](Directory_LHCb-PAPER-2021-048/hidef_Combined_Ai_Normal.png)
![HiDef png [207 KiB]](Directory_LHCb-PAPER-2021-048/hidef_Combined_lowmass.png)
![HiDef png [238 KiB]](Directory_LHCb-PAPER-2021-048/hidef_Combined_Ai_Y.png)
Tables and captions
|
The number of selected data candidate events in different $ Z $ boson $ p_{\mathrm{T}}$ and rapidity intervals in the mass region $50<M_{\mu\mu}<120\text{ Ge V /}c^2 $. |
Table_1.pdf [52 KiB] HiDef png [94 KiB] Thumbnail [41 KiB] tex code |

|
|
Summary of measured angular coefficients and regularised uncertainties for $A_{i}$ and $A_{0}-A_2$, in intervals of $ Z $ -boson $ p_{\mathrm{T}}$ , in the region of $ Z $ -boson $y>2$ and $75<M_{\mu\mu}<105\text{ Ge V /}c^2 $. The total systematic uncertainty is shown with the breakdown into its underlying components. Entries marked with `-' indicate that the uncertainty is below 0.0001. |
Table_2.pdf [63 KiB] HiDef png [274 KiB] Thumbnail [117 KiB] tex code |

|
|
Summary of measured angular coefficients and regularised uncertainties for $A_{i}$ and $A_{0}-A_2$, in intervals of $ Z $ -boson rapidity, in the region of $ Z $ -boson $ p_{\mathrm{T}} <100 \text{ Ge V /}c $ and $75<M_{\mu\mu}<105\text{ Ge V /}c^2 $. The total systematic uncertainty is shown with the breakdown into its underlying components. Entries marked with `-' indicate that the uncertainty is below 0.0001. |
Table_3.pdf [67 KiB] HiDef png [181 KiB] Thumbnail [77 KiB] tex code |

|
|
Summary of measured angular coefficients and regularised uncertainties for $A_{2}$, in intervals of $ Z $ -boson $ p_{\mathrm{T}}$ , in the region of $ Z $ -boson $y>2$ and different mass ranges. The total systematic uncertainty is shown with the breakdown into its underlying components. Entries marked with `-' indicate that the uncertainty is below 0.0001. |
Table_4.pdf [67 KiB] HiDef png [266 KiB] Thumbnail [127 KiB] tex code |

|
![HiDef png [94 KiB]](Directory_LHCb-PAPER-2021-048/hidef_Table_1.png)
![HiDef png [274 KiB]](Directory_LHCb-PAPER-2021-048/hidef_Table_2.png)
![HiDef png [181 KiB]](Directory_LHCb-PAPER-2021-048/hidef_Table_3.png)
![HiDef png [266 KiB]](Directory_LHCb-PAPER-2021-048/hidef_Table_4.png)
Created on 20 April 2024.