Search for $CP$ violation using $\hat{T}$-odd correlations in $B^{0} \to p \bar p K^{+} \pi^{-}$ decays
[to restricted-access page]Information
LHCb-PAPER-2022-003
CERN-EP-2022-083
arXiv:2205.08973 [PDF]
(Submitted on 18 May 2022)
Phys. Rev. D108 (2023) 032007
Inspire 2083797
Tools
Abstract
A search for $CP$ and $P$ violation in charmless four-body $B^{0} \to p \bar p K^{+} \pi^{-}$ decays is performed using triple-product asymmetry observables. It is based on proton-proton collision data collected by the LHCb experiment at centre-of-mass energies of $7$, $8$ and $13$ TeV, corresponding to a total integrated luminosity of $8.4$ fb$^{-1}$. The $CP$- and $P$-violating asymmetries are measured both in the integrated phase space and in specific regions. No evidence is seen for $CP$ violation. $P$-parity violation is observed at a significance of 5.8 standard deviations
Figures and captions
|
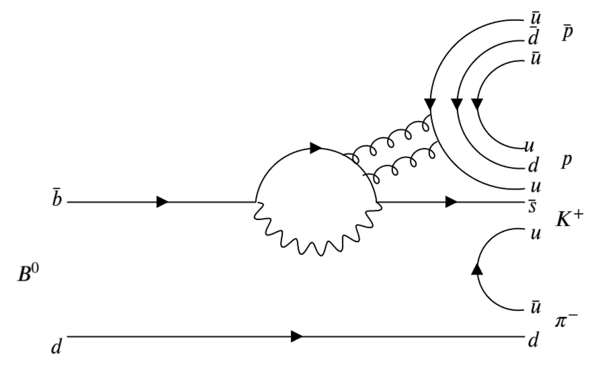
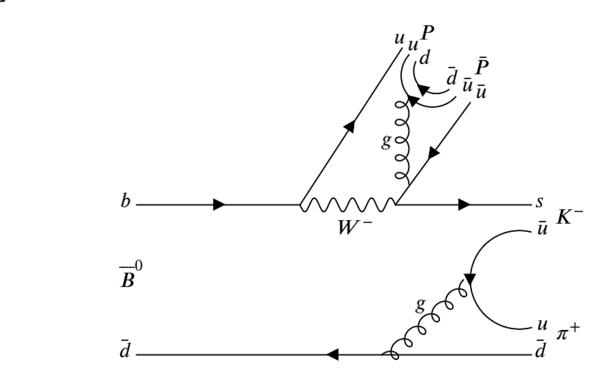
Feynman diagrams for the $B^{0}\rightarrow p\bar{p}K^{+}\pi^{-}$ decay in the charmless region: penguin (left) and tree (right). |
Figure5a.png [32 KiB] HiDef png [37 KiB] Thumbnail [12 KiB] *.C file |
|
|
Figure5b.png [28 KiB] HiDef png [35 KiB] Thumbnail [12 KiB] *.C file |
|
|
|
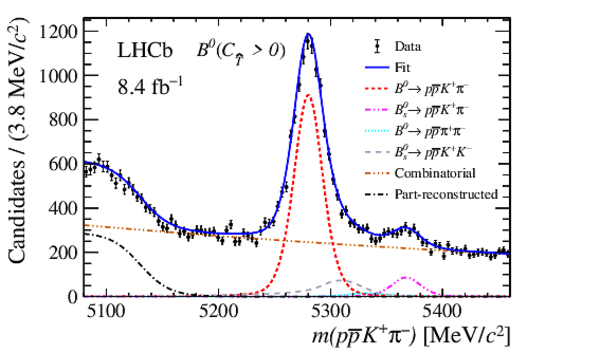
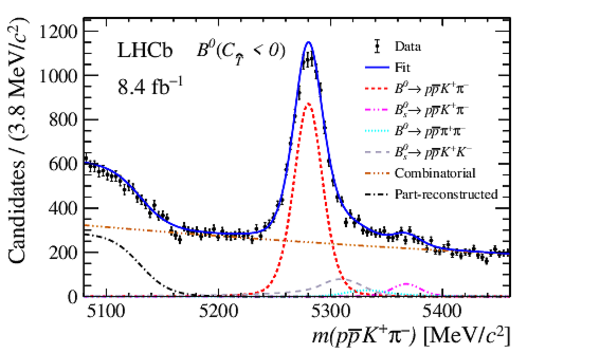
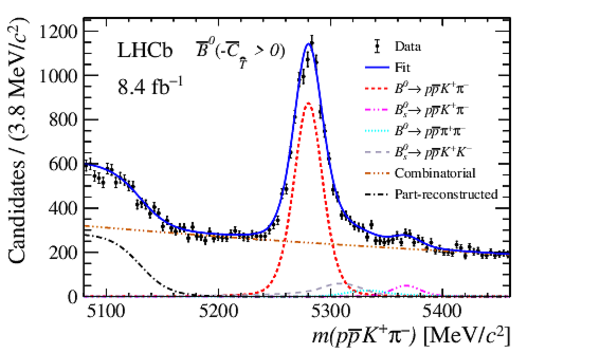
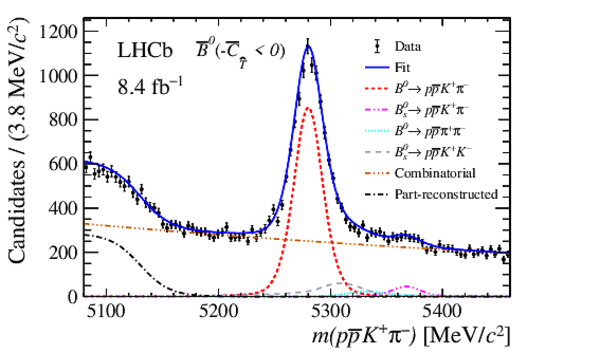
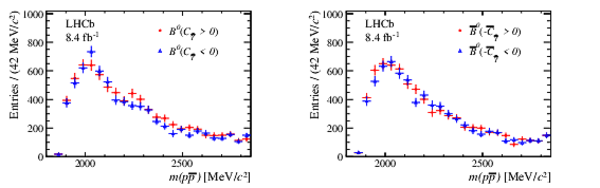
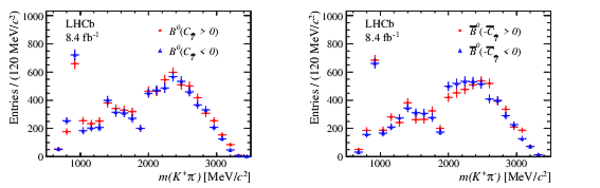
Distributions for combined Run 1 and Run 2 data of the $p\bar{p}K^{+}\pi^{-}$ invariant mass in the four samples defined by $B^{0}$ ($\bar{B}^{0}$) flavour and the sign of $C_{\hat{T}}$ ($\bar{C}_{\hat{T}}$). The results of the fit, as described in the legend, are overlaid on the data. |
Figure1a.pdf [28 KiB] HiDef png [288 KiB] Thumbnail [214 KiB] *.C file |
|
|
Figure1b.pdf [28 KiB] HiDef png [287 KiB] Thumbnail [213 KiB] *.C file |
|
|
|
Figure1c.pdf [27 KiB] HiDef png [286 KiB] Thumbnail [213 KiB] *.C file |
|
|
|
Figure1d.pdf [27 KiB] HiDef png [285 KiB] Thumbnail [213 KiB] *.C file |
|
|
|
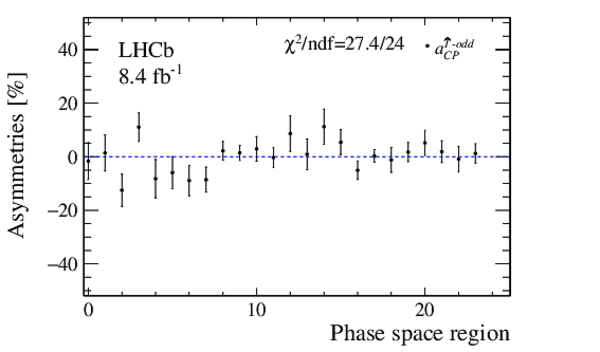
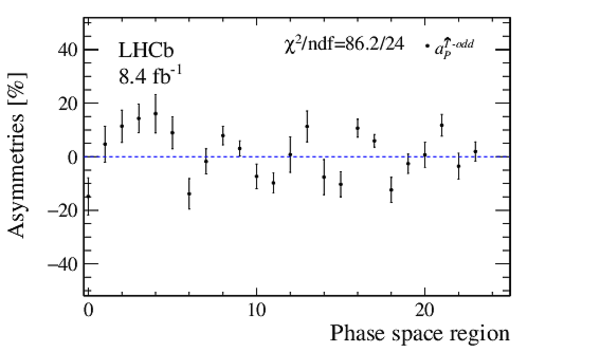
The $a^{\hat{T}\text{-odd}}_{ C P }$ (left) and $a^{\hat{T}\text{-odd}}_{P}$ (right) asymmetry parameters in each region of the phase space for Run 1 and Run 2 data combined for binning scheme A. The error bars represent the sum in quadrature of the statistical and systematic uncertainties. The $\chi^{2}$ per number of degrees of freedom (ndf) is calculated with respect to the null hypothesis. |
Figure2a.pdf [15 KiB] HiDef png [107 KiB] Thumbnail [100 KiB] *.C file |
|
|
Figure2b.pdf [15 KiB] HiDef png [107 KiB] Thumbnail [100 KiB] *.C file |
|
|
|
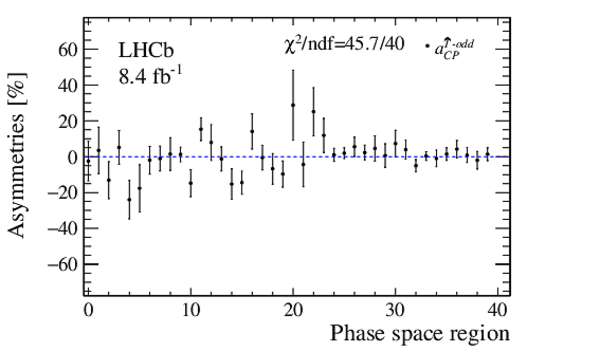
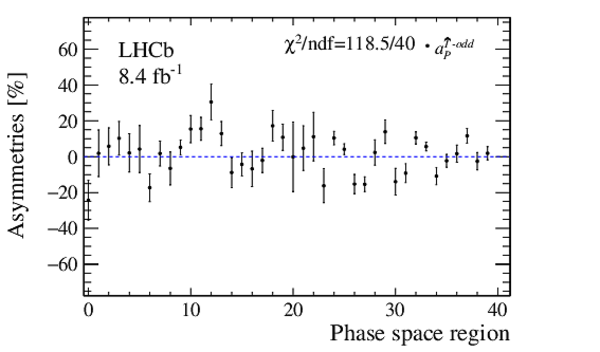
The $a^{\hat{T}\text{-odd}}_{ C P }$ (left) and $a^{\hat{T}\text{-odd}}_{P}$ (right) asymmetry parameters in each region of the phase space for Run 1 and Run 2 data combined for binning scheme B. The error bars represent the sum in quadrature of the statistical and systematic uncertainties. The $\chi^{2}$ per ndf is calculated with respect to the null hypothesis. |
Figure3a.pdf [16 KiB] HiDef png [128 KiB] Thumbnail [125 KiB] *.C file |
|
|
Figure3b.pdf [16 KiB] HiDef png [128 KiB] Thumbnail [126 KiB] *.C file |
|
|
|
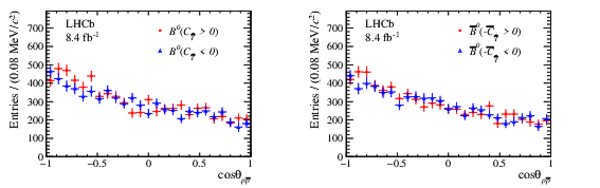
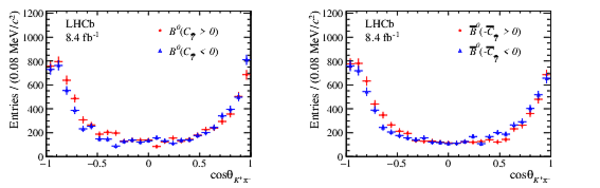
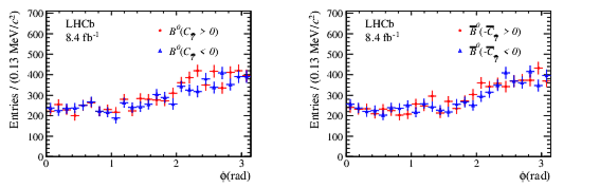
Background-subtracted distributions of $B^{0}$ ($\bar{B}^{0}$) candidates in the variables $m_{p \bar p}$, $m_{K^{+}\pi^{-}}$, $\cos\theta_{p \bar p}$, $\cos\theta_{K^{+}\pi^{-}}$ and $\phi$ with $C_{\hat{T}}>0$ and $C_{\hat{T}}<0$ ($-\bar{C}_{\hat{T}}>0$ and $-\bar{C}_{\hat{T}}<0$). |
Figure4a.pdf [21 KiB] HiDef png [142 KiB] Thumbnail [111 KiB] *.C file |
|
|
Figure4b.pdf [21 KiB] HiDef png [149 KiB] Thumbnail [118 KiB] *.C file |
|
|
|
Figure4c.pdf [22 KiB] HiDef png [160 KiB] Thumbnail [124 KiB] *.C file |
|
|
|
Figure4d.pdf [22 KiB] HiDef png [143 KiB] Thumbnail [114 KiB] *.C file |
|
|
|
Figure4e.pdf [22 KiB] HiDef png [154 KiB] Thumbnail [122 KiB] *.C file |
|
|
|
Animated gif made out of all figures. |
PAPER-2022-003.gif Thumbnail |

|
![Figure5a.png [32 KiB]](Directory_LHCb-PAPER-2022-003/Figure5a.png)
![HiDef png [37 KiB]](Directory_LHCb-PAPER-2022-003/hidef_Figure5a.png)
![Figure5b.png [28 KiB]](Directory_LHCb-PAPER-2022-003/Figure5b.png)
![HiDef png [35 KiB]](Directory_LHCb-PAPER-2022-003/hidef_Figure5b.png)
![HiDef png [288 KiB]](Directory_LHCb-PAPER-2022-003/hidef_Figure1a.png)
![HiDef png [287 KiB]](Directory_LHCb-PAPER-2022-003/hidef_Figure1b.png)
![HiDef png [286 KiB]](Directory_LHCb-PAPER-2022-003/hidef_Figure1c.png)
![HiDef png [285 KiB]](Directory_LHCb-PAPER-2022-003/hidef_Figure1d.png)
![HiDef png [107 KiB]](Directory_LHCb-PAPER-2022-003/hidef_Figure2a.png)
![HiDef png [107 KiB]](Directory_LHCb-PAPER-2022-003/hidef_Figure2b.png)
![HiDef png [128 KiB]](Directory_LHCb-PAPER-2022-003/hidef_Figure3a.png)
![HiDef png [128 KiB]](Directory_LHCb-PAPER-2022-003/hidef_Figure3b.png)
![HiDef png [142 KiB]](Directory_LHCb-PAPER-2022-003/hidef_Figure4a.png)
![HiDef png [149 KiB]](Directory_LHCb-PAPER-2022-003/hidef_Figure4b.png)
![HiDef png [160 KiB]](Directory_LHCb-PAPER-2022-003/hidef_Figure4c.png)
![HiDef png [143 KiB]](Directory_LHCb-PAPER-2022-003/hidef_Figure4d.png)
![HiDef png [154 KiB]](Directory_LHCb-PAPER-2022-003/hidef_Figure4e.png)
Tables and captions
|
Sources of systematic uncertainty and their relative contributions expressed as a percentage of the statistical uncertainty. In order to obtain the absolute systematic uncertainty assigned to specific region of the phase space, the numbers reported here have to be multiplied by the corresponding statistical uncertainties. $\Delta a^{\hat{T}\text{-odd}}_{ C P }$ and $\Delta a^{\hat{T}\text{-odd}}_{P}$ indicate the uncertainty assigned to $a^{\hat{T}\text{-odd}}_{ C P }$ and $a^{\hat{T}\text{-odd}}_{P}$ respectively. |
Table_1.pdf [54 KiB] HiDef png [54 KiB] Thumbnail [24 KiB] tex code |

|
|
Definition of the 24 regions that form scheme A for the $B^{0}\rightarrow p\bar{p}K^{+}\pi^{-}$ decay. |
Table_2.pdf [75 KiB] HiDef png [249 KiB] Thumbnail [116 KiB] tex code |

|
|
Measurements of $a^{\hat{T}\text{-odd}}_{CP}$ and $a^{\hat{T}\text{-odd}}_{P}$ in specific phase-space regions for the $B^{0}\rightarrow p\bar{p} K^{+}\pi^{-}$ decay for binning scheme A. Each value is obtained through an independent fit to the $B^{0}$ invariant-mass distribution of the candidates in the corresponding region of the phase space. The uncertainties are only statistical. |
Table_3.pdf [61 KiB] HiDef png [212 KiB] Thumbnail [111 KiB] tex code |

|
|
Definition of the 40 regions that form scheme B for the $B^{0}\rightarrow p\bar{p}K^{+}\pi^{-}$ decay. |
Table_4.pdf [75 KiB] HiDef png [411 KiB] Thumbnail [192 KiB] tex code |

|
|
Measurements of $a^{\hat{T}\text{-odd}}_{CP}$ and $a^{\hat{T}\text{-odd}}_{P}$ in specific phase-space regions for the $B^{0}\rightarrow p\bar{p} K^{+}\pi^{-}$ decay for binning scheme B. Each value is obtained through an independent fit to the $B^{0}$ invariant-mass distribution of the candidates in the corresponding region of the phase space. |
Table_5.pdf [61 KiB] HiDef png [298 KiB] Thumbnail [188 KiB] tex code |

|
![HiDef png [54 KiB]](Directory_LHCb-PAPER-2022-003/hidef_Table_1.png)
![HiDef png [249 KiB]](Directory_LHCb-PAPER-2022-003/hidef_Table_2.png)
![HiDef png [212 KiB]](Directory_LHCb-PAPER-2022-003/hidef_Table_3.png)
![HiDef png [411 KiB]](Directory_LHCb-PAPER-2022-003/hidef_Table_4.png)
![HiDef png [298 KiB]](Directory_LHCb-PAPER-2022-003/hidef_Table_5.png)
Created on 20 April 2024.