Information
LHCb-PAPER-2022-004
CERN-EP-2022-102
arXiv:2206.06673 [PDF]
(Submitted on 14 Jun 2022)
Phys. Rev. D108 (2023) 12007
Inspire 2677042
Tools
Abstract
A search for the rare hadronic decay $B_s^0\to p \bar{p}$ is performed using proton-proton collision data recorded by the LHCb experiment at a center-of-mass energy of 13 TeV, corresponding to an integrated luminosity of 6 fb$^{-1}$. No evidence of the decay is found and an upper limit on its branching fraction is set at ${\cal B}(B_s^0\to p \bar{p}) < 4.4 (5.1) \times 10^{-9}$ at 90 (95) confidence level; this is currently the world's best upper limit. The decay mode $B^0\to p \bar{p}$ is measured with very large significance, confirming the first observation by the LHCb experiment in 2017. The branching fraction is determined to be ${\cal B}(B^0\to p \bar{p}) = \rm (1.27 \pm 0.15 \pm 0.05 \pm 0.04) \times 10^{-8}$, where the first uncertainty is statistical, the second is systematic and the third is due to the external branching fraction of the normalization channel $B^0\to K^+\pi^-$. The combination of the two LHCb measurements of the $B^0\to p \bar{p}$ branching fraction yields ${\cal B}(B^0\to p \bar{p}) = \rm (1.27 \pm 0.13 \pm 0.05 \pm 0.03) \times 10^{-8}$.
Figures and captions
|
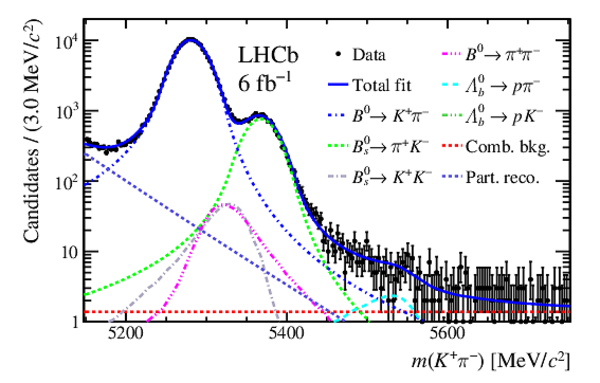
Invariant-mass distribution of $ B ^0 \rightarrow K ^+ \pi ^- $ candidates. The fit result is shown together with each fit model component. |
Fig1.pdf [71 KiB] HiDef png [314 KiB] Thumbnail [259 KiB] *.C file |
|
|
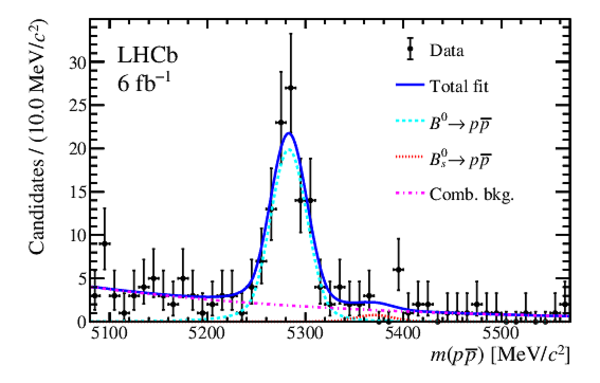
Invariant-mass distribution of $ p \overline p $ candidates with each fit model component. |
Fig2.pdf [20 KiB] HiDef png [237 KiB] Thumbnail [190 KiB] *.C file |
|
|
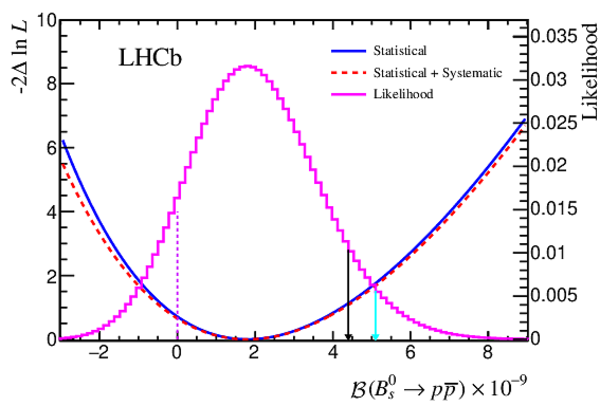
Negative logarithm of the profile likelihoods (${\rm -2 \Delta ln}L$) and the corresponding likelihood as a function of the $ B ^0_ s \rightarrow p \overline p $ branching fraction. The solid blue line represents the statistical-only profile, whereas the dashed red line includes the systematic uncertainties. The solid magenta line shows the distribution of likelihood. The dashed violet vertical line at 0 shows the start point of the integral. The black (cyan) arrow shows the upper limits at 90% (95%) confidence level. |
Fig3.pdf [18 KiB] HiDef png [187 KiB] Thumbnail [160 KiB] *.C file |
|
|
Animated gif made out of all figures. |
PAPER-2022-004.gif Thumbnail |

|
![HiDef png [314 KiB]](Directory_LHCb-PAPER-2022-004/hidef_Fig1.png)
![HiDef png [237 KiB]](Directory_LHCb-PAPER-2022-004/hidef_Fig2.png)
![HiDef png [187 KiB]](Directory_LHCb-PAPER-2022-004/hidef_Fig3.png)
Tables and captions
|
Systematic uncertainties on the $ B _{( s )}^0 \rightarrow p \overline p $ branching fractions, in percentage (%), coming from the $ B ^0 \rightarrow p \overline p $ and $ B ^0_ s \rightarrow p \overline p $ contributions in Equation 1. The totals correspond to the quadratic sums of each column. |
Table_1.pdf [70 KiB] HiDef png [53 KiB] Thumbnail [25 KiB] tex code |

|
![HiDef png [53 KiB]](Directory_LHCb-PAPER-2022-004/hidef_Table_1.png)
Created on 13 April 2024.