Measurement of antiproton production from antihyperon decays in pHe collisions at $\sqrt{s_{NN}}=110$ GeV
[to restricted-access page]Information
LHCb-PAPER-2022-006
CERN-EP-2022-091
arXiv:2205.09009 [PDF]
(Submitted on 18 May 2022)
EPJC 83, 543 (2023)
Inspire 2084295
Tools
Abstract
The interpretation of cosmic antiproton flux measurements from space-borne experiments is currently limited by the knowledge of the antiproton production cross-section in collisions between primary cosmic rays and the interstellar medium. Using collisions of protons with an energy of 6.5 TeV incident on helium nuclei at rest in the proximity of the interaction region of the LHCb experiment, the ratio of antiprotons originating from antihyperon decays to prompt production is measured for antiproton momenta between 12 and 110 GeV/c. The dominant antihyperon contribution, namely $\bar{\Lambda} \to \bar{p} \pi^+$ decays from promptly produced $\bar{\Lambda}$ particles, is also exclusively measured. The results complement the measurement of prompt antiproton production obtained from the same data sample. At the energy scale of this measurement, the antihyperon contributions to antiproton production are observed to be significantly larger than predictions of commonly used hadronic production models.
Figures and captions
|
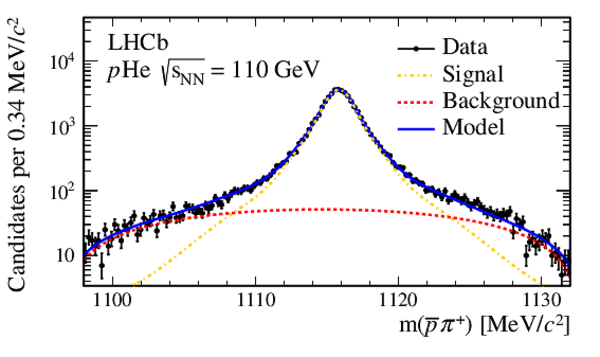
Invariant-mass distribution for the $\overline{ \Lambda} \rightarrow \overline p \pi ^+ $ candidates selected in the $ p {\rm He}$ data. The fit model is overlaid on the data. |
Fig1.pdf [31 KiB] HiDef png [225 KiB] Thumbnail [188 KiB] *.C file |
|
|
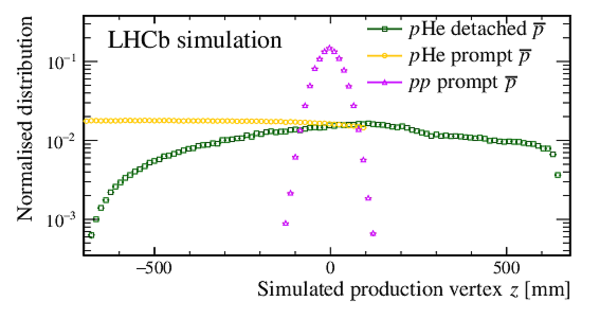
Normalised distributions of the production vertex $z$ coordinate for simulated prompt and detached $\overline p $ in $ p {\rm He}$ collisions and for prompt $\overline p $ in simulated $ p $ $ p $ collisions in the kinematic range explored in this paper. The PV fiducial region for $ p {\rm He}$ collisions is $-700 < z < 100$ $\text{ mm}$ . |
Fig2.pdf [23 KiB] HiDef png [209 KiB] Thumbnail [155 KiB] *.C file |
|
|
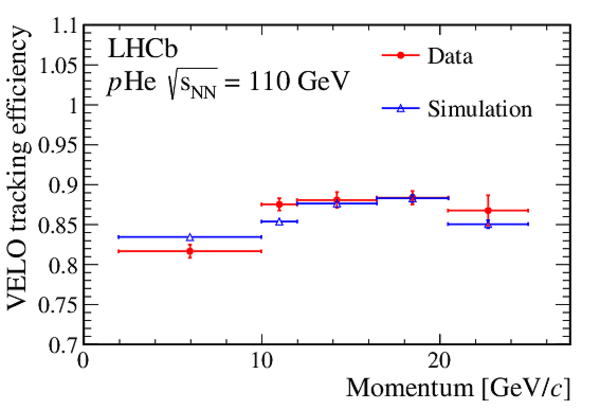
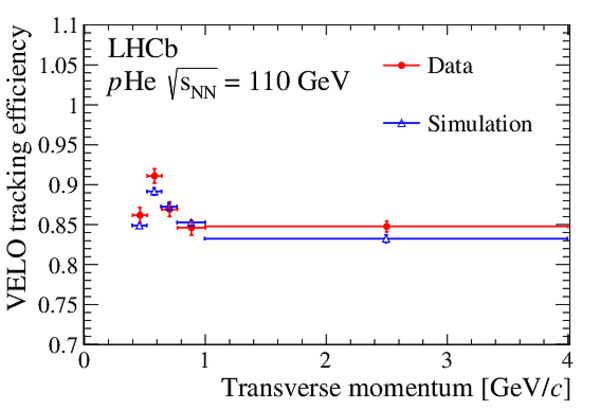
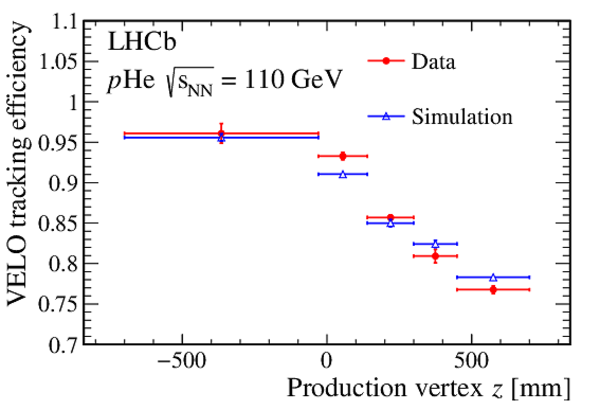
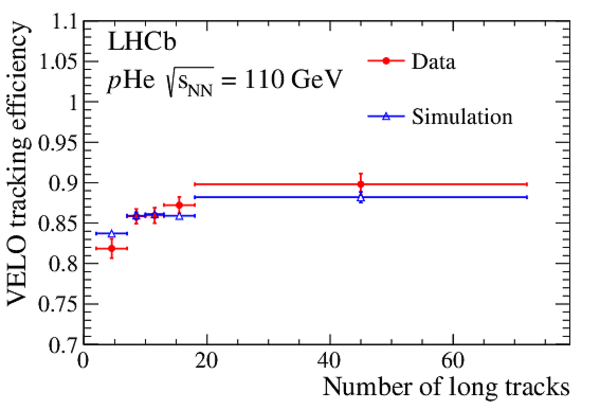
VELO tracking efficiency for $\overline p $ in $\overline{ \Lambda} \rightarrow \overline p \pi ^+ $ decays as a function of (top left) the particle momentum, (top right) the transverse momentum, (bottom left) the production vertex $z$ coordinate and (bottom right) the number of reconstructed long tracks in the event. |
Fig3a.pdf [14 KiB] HiDef png [138 KiB] Thumbnail [141 KiB] *.C file |
|
|
Fig3b.pdf [14 KiB] HiDef png [151 KiB] Thumbnail [147 KiB] *.C file |
|
|
|
Fig3c.pdf [14 KiB] HiDef png [143 KiB] Thumbnail [149 KiB] *.C file |
|
|
|
Fig3d.pdf [14 KiB] HiDef png [146 KiB] Thumbnail [143 KiB] *.C file |
|
|
|
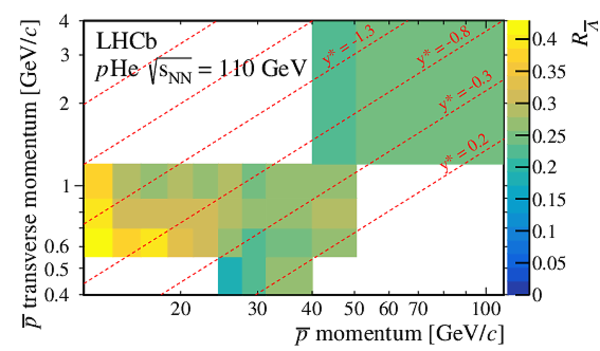
Measured $ R_{\overline{ \Lambda} }$ in each of the considered $ p$ and $ p_{\mathrm{T}}$ intervals. |
Fig4_ETA.pdf [14 KiB] HiDef png [282 KiB] Thumbnail [211 KiB] *.C file |
|
|
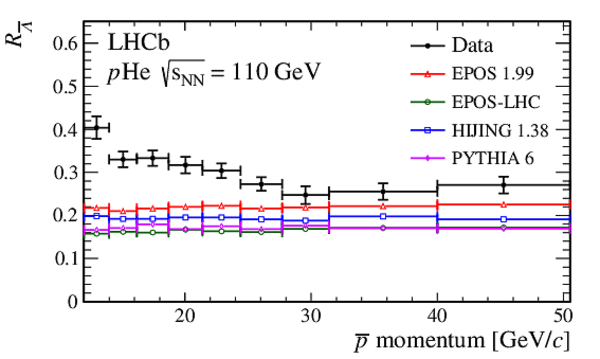
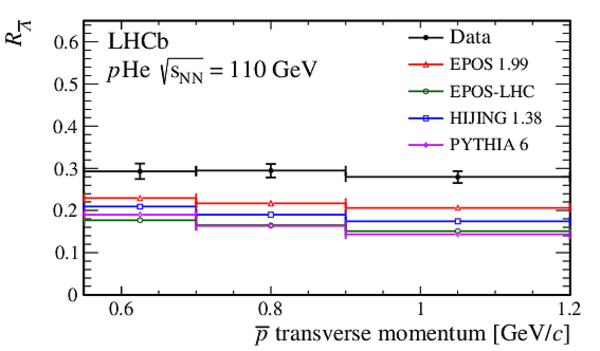
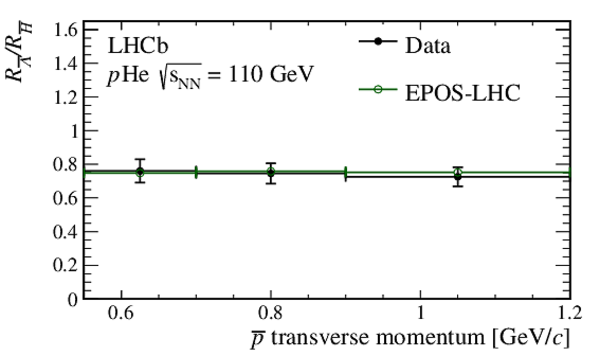
Measured $ R_{\overline{ \Lambda} }$ as a function of (top) the $\overline p $ momentum for $0.55< p_{\mathrm{T}} <1.2$ $\text{ Ge V /}c$ and (bottom) the $\overline p $ transverse momentum for $12< p <50.5$ $\text{ Ge V /}c$ . The measurement is compared to the predictions, in the same kinematic regions, from the Epos 1.99 [34], Epos-lhc [23], Hijing 1.38 [35] and Pythia 6 [36] models, included in the Crmc package [27]. Error bars on data represent the total uncertainty. |
Fig5a.pdf [16 KiB] HiDef png [165 KiB] Thumbnail [155 KiB] *.C file |
|
|
Fig5b.pdf [14 KiB] HiDef png [133 KiB] Thumbnail [131 KiB] *.C file |
|
|
|
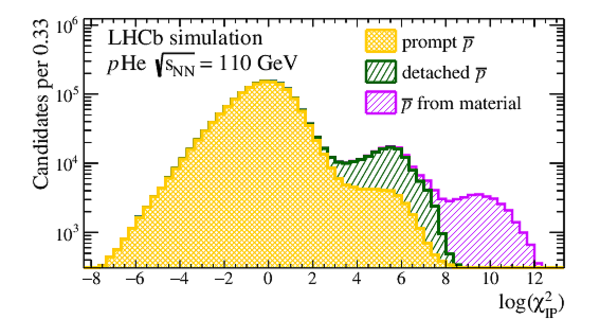
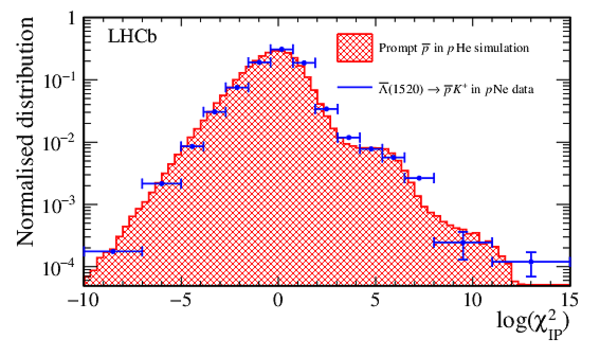
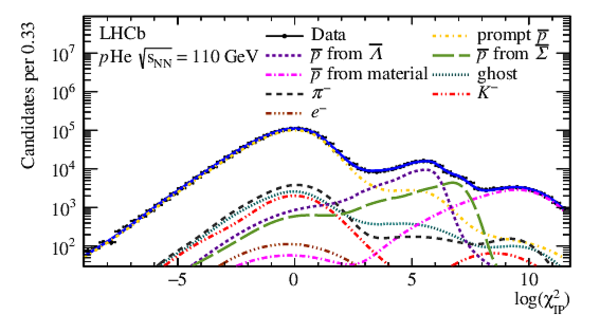
Distributions of the $\log(\chi^2_{\text{IP}} )$ variable for all simulated antiprotons in the $\overline p $ -enriched simulated sample. The contributions from prompt, detached and antiprotons produced in the detector material are separately shown. |
Fig6.pdf [21 KiB] HiDef png [762 KiB] Thumbnail [357 KiB] *.C file |
|
|
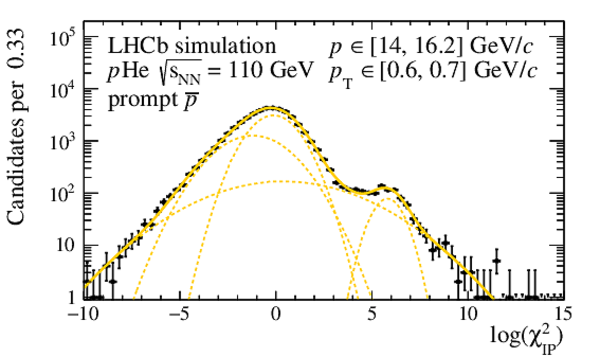
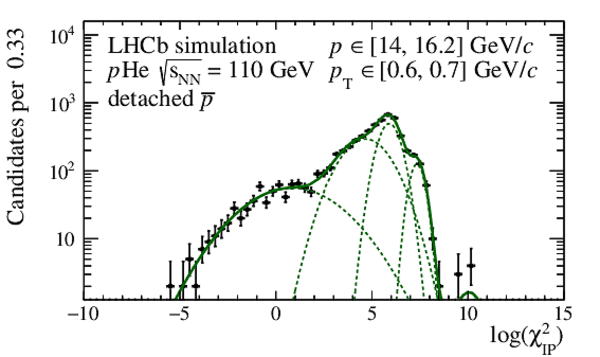
Distributions of $\log(\chi^2_{\text{IP}} )$ for (top) prompt and (bottom) detached antiprotons in the $\overline p $ -enriched simulated sample for a kinematic interval in the central region of the considered phase-space. The fit model is overlaid on the data. |
Fig7a.pdf [23 KiB] HiDef png [247 KiB] Thumbnail [205 KiB] *.C file |
|
|
Fig7b.pdf [22 KiB] HiDef png [238 KiB] Thumbnail [195 KiB] *.C file |
|
|
|
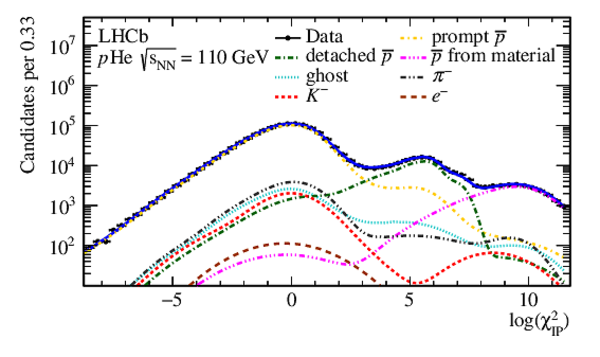
Distributions of the $\log(\chi^2_{\text{IP}} )$ variable in the data sample integrated over all kinematic intervals. The fit model is overlaid on the data. |
Fig8.pdf [26 KiB] HiDef png [293 KiB] Thumbnail [217 KiB] *.C file |
|
|
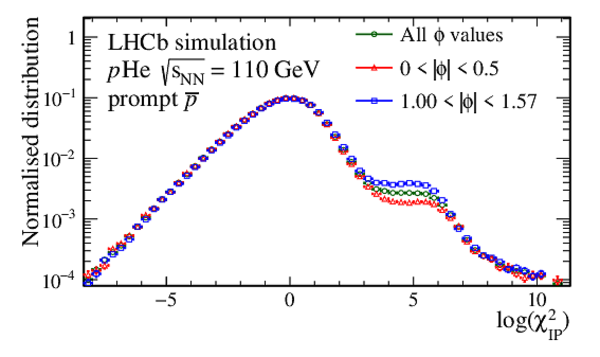
Normalised distributions of the prompt $\overline p $ $\log(\chi^2_{\text{IP}} )$ variable in different ranges of the azimuthal angle $\phi=\text{atan}(p_y/p_x)$. |
Fig9.pdf [24 KiB] HiDef png [230 KiB] Thumbnail [169 KiB] *.C file |
|
|
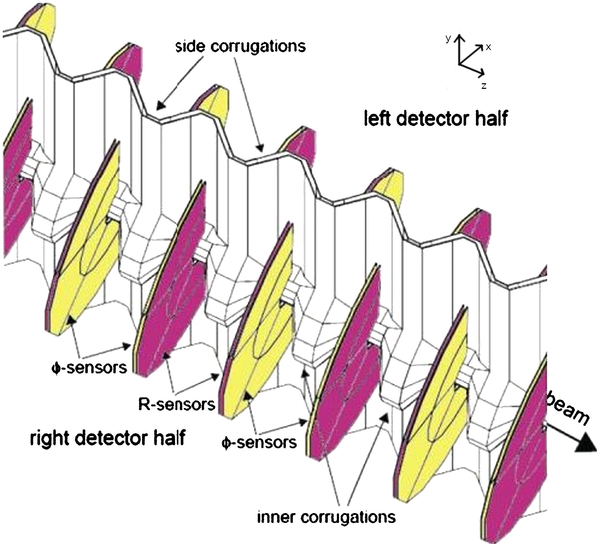
Sketch of the VELO [37], where the aluminium foils crossed by the particles before entering the VELO volume is visible. The crossed material is maximum for $|\phi| > 1$. |
Fig10.jpg [333 KiB] HiDef png [1 MiB] Thumbnail [260 KiB] *.C file |
|
|
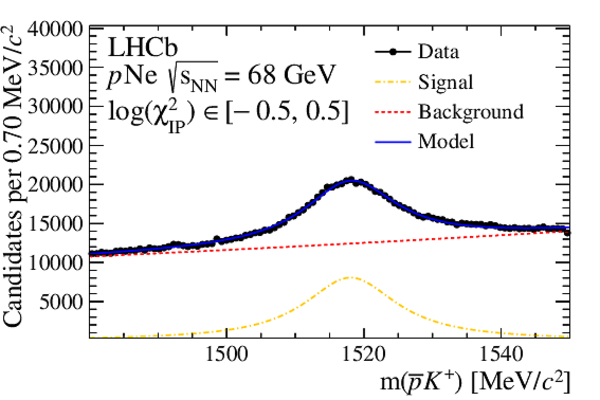
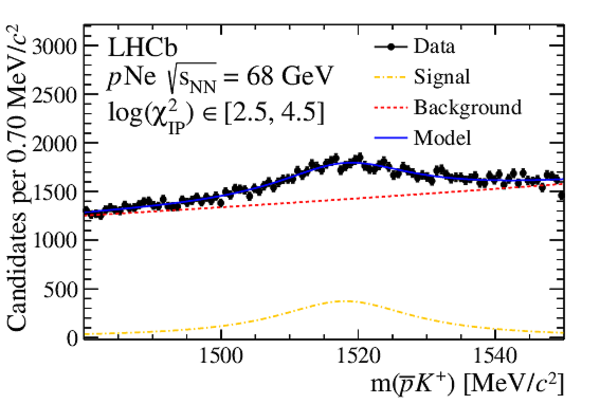
Invariant-mass distributions for the $\overline{ \Lambda} (1520) \rightarrow \overline p K ^+ $ candidates selected in the $ p {\rm Ne}$ data within two intervals of the $\overline p $ $\log(\chi^2_{\text{IP}} )$ variable. The fit model is overlaid on the data. |
Fig11a.pdf [19 KiB] HiDef png [250 KiB] Thumbnail [218 KiB] *.C file |
|
|
Fig11b.pdf [24 KiB] HiDef png [241 KiB] Thumbnail [218 KiB] *.C file |
|
|
|
Distributions of the number of signal candidates determined in each interval of the antiproton $\log(\chi^2_{\text{IP}} )$ compared to the prediction of the $ p {\rm He}$ simulation for selected prompt antiprotons. |
Fig12.pdf [15 KiB] HiDef png [631 KiB] Thumbnail [333 KiB] *.C file |
|
|
Distribution of the $\log(\chi^2_{\text{IP}} )$ variable in the data sample integrated over all kinematic intervals modelled with independent components for $\overline{ \Sigma } {}^-$ decays (labelled as $\overline p $ from $\overline{ \Sigma } {}^-$ ) and all other antihyperon decays ( $\overline p $ from $\overline{ \Lambda}$ ). |
Fig13.pdf [27 KiB] HiDef png [300 KiB] Thumbnail [211 KiB] *.C file |
|
|
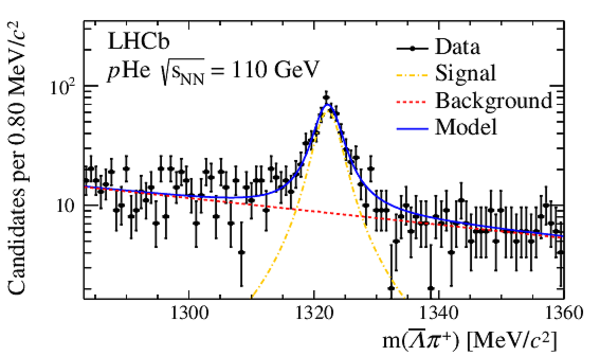
Invariant-mass distribution for the $\overline{ \Xi } ^+ \rightarrow \overline{ \Lambda} \pi ^+ $ candidates selected in the $ p {\rm He}$ data. The fit model is overlaid on the data. |
Fig14.pdf [25 KiB] HiDef png [239 KiB] Thumbnail [214 KiB] *.C file |
|
|
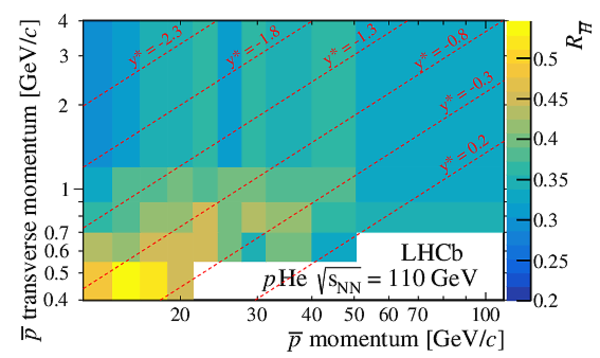
Measured $ R_{\overline{ H} }$ in each of the considered $ p$ and $ p_{\mathrm{T}}$ intervals. |
Fig15_ETA.pdf [14 KiB] HiDef png [343 KiB] Thumbnail [247 KiB] *.C file |
|
|
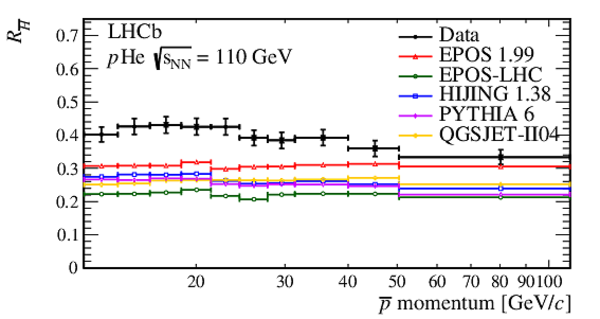
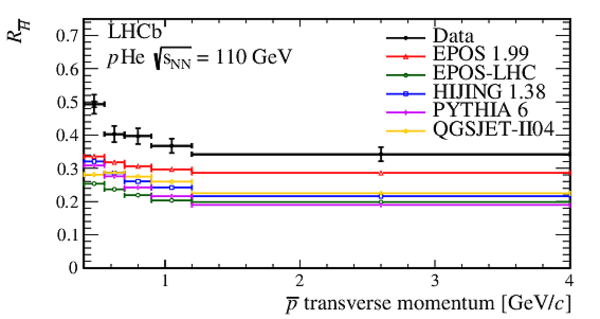
Measured $ R_{\overline{ H} }$ as a function of (top) the $\overline p $ momentum for $0.4< p_{\mathrm{T}} <4\text{ Ge V /}c $ and (bottom) the $\overline p $ transverse momentum for $12< p <110\text{ Ge V /}c $. The measurement is compared to predictions, in the same kinematic regions, from the Epos 1.99 [34], Epos-lhc [23], Hijing 1.38 [35], Pythia 6 [36] and Qgsjet-ii04 [39] models, included in the Crmc package [27]. Error bars on data represent the total uncertainty. |
Fig16a.pdf [18 KiB] HiDef png [180 KiB] Thumbnail [167 KiB] *.C file |
|
|
Fig16b.pdf [16 KiB] HiDef png [151 KiB] Thumbnail [145 KiB] *.C file |
|
|
|
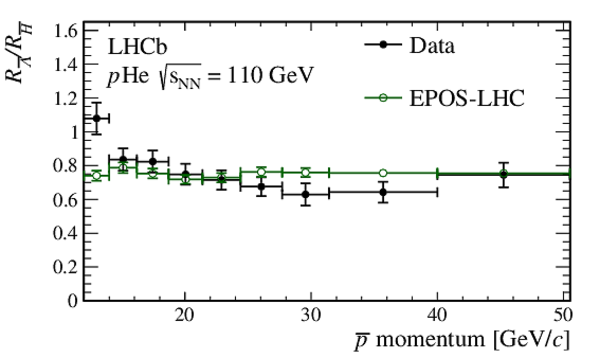
Fraction of antiprotons from decays of promptly produced $\overline{ \Lambda}$ particles to the total yield of detached antiprotons as a function of (top) their momentum for $0.55< p_{\mathrm{T}} <1.2\text{ Ge V /}c $ and (bottom) their transverse momentum for $12< p <50.5\text{ Ge V /}c $. The data are compared to the Epos-lhc [23] prediction for this quantity. Error bars on data represent the total uncertainty. |
Fig17a.pdf [15 KiB] HiDef png [134 KiB] Thumbnail [132 KiB] *.C file |
|
|
Fig17b.pdf [14 KiB] HiDef png [112 KiB] Thumbnail [114 KiB] *.C file |
|
|
|
Animated gif made out of all figures. |
PAPER-2022-006.gif Thumbnail |

|
![HiDef png [225 KiB]](Directory_LHCb-PAPER-2022-006/hidef_Fig1.png)
![HiDef png [209 KiB]](Directory_LHCb-PAPER-2022-006/hidef_Fig2.png)
![HiDef png [138 KiB]](Directory_LHCb-PAPER-2022-006/hidef_Fig3a.png)
![HiDef png [151 KiB]](Directory_LHCb-PAPER-2022-006/hidef_Fig3b.png)
![HiDef png [143 KiB]](Directory_LHCb-PAPER-2022-006/hidef_Fig3c.png)
![HiDef png [146 KiB]](Directory_LHCb-PAPER-2022-006/hidef_Fig3d.png)
![HiDef png [282 KiB]](Directory_LHCb-PAPER-2022-006/hidef_Fig4_ETA.png)
![HiDef png [165 KiB]](Directory_LHCb-PAPER-2022-006/hidef_Fig5a.png)
![HiDef png [133 KiB]](Directory_LHCb-PAPER-2022-006/hidef_Fig5b.png)
![HiDef png [762 KiB]](Directory_LHCb-PAPER-2022-006/hidef_Fig6.png)
![HiDef png [247 KiB]](Directory_LHCb-PAPER-2022-006/hidef_Fig7a.png)
![HiDef png [238 KiB]](Directory_LHCb-PAPER-2022-006/hidef_Fig7b.png)
![HiDef png [293 KiB]](Directory_LHCb-PAPER-2022-006/hidef_Fig8.png)
![HiDef png [230 KiB]](Directory_LHCb-PAPER-2022-006/hidef_Fig9.png)
![Fig10.jpg [333 KiB]](Directory_LHCb-PAPER-2022-006/Fig10.jpg)
![HiDef png [1 MiB]](Directory_LHCb-PAPER-2022-006/hidef_Fig10.png)
![HiDef png [250 KiB]](Directory_LHCb-PAPER-2022-006/hidef_Fig11a.png)
![HiDef png [241 KiB]](Directory_LHCb-PAPER-2022-006/hidef_Fig11b.png)
![HiDef png [631 KiB]](Directory_LHCb-PAPER-2022-006/hidef_Fig12.png)
![HiDef png [300 KiB]](Directory_LHCb-PAPER-2022-006/hidef_Fig13.png)
![HiDef png [239 KiB]](Directory_LHCb-PAPER-2022-006/hidef_Fig14.png)
![HiDef png [343 KiB]](Directory_LHCb-PAPER-2022-006/hidef_Fig15_ETA.png)
![HiDef png [180 KiB]](Directory_LHCb-PAPER-2022-006/hidef_Fig16a.png)
![HiDef png [151 KiB]](Directory_LHCb-PAPER-2022-006/hidef_Fig16b.png)
![HiDef png [134 KiB]](Directory_LHCb-PAPER-2022-006/hidef_Fig17a.png)
![HiDef png [112 KiB]](Directory_LHCb-PAPER-2022-006/hidef_Fig17b.png)
Tables and captions
|
Selection requirements for $\overline{ \Lambda} \rightarrow \overline p \pi ^+ $ decays. Symbols are defined in the text. |
[Error creating the table] | |
|
Relative uncertainties on the $ R_{\overline{ \Lambda} }$ measurement. |
[Error creating the table] | |
|
Relative uncertainties on the $ R_{\overline{ H} }$ measurement. |
Table_3.pdf [55 KiB] HiDef png [82 KiB] Thumbnail [37 KiB] tex code |

|
|
Measured $ R_{\overline{ H} }$ and $ R_{\overline{ \Lambda} }$ ratios in intervals of the antiproton momentum and transverse momentum, measured in $\text{ Ge V /}c$ units. The average momentum and transverse momentum, as predicted by the Epos-lhc generator for prompt antiprotons, are also listed for each interval in $\text{ Ge V /}c$ units. The uncertainty is split into an uncorrelated component, denoted with $\delta _{\text{uncorr}} $, and a component that is fully correlated among the kinematic intervals, denoted $\delta _{\text{corr}} $. |
Table_4.pdf [17 KiB] HiDef png [1 KiB] Thumbnail [0 KiB] tex code |

|
![HiDef png [82 KiB]](Directory_LHCb-PAPER-2022-006/hidef_Table_3.png)
![HiDef png [1 KiB]](Directory_LHCb-PAPER-2022-006/hidef_Table_4.png)
Created on 20 April 2024.