Measurement of the prompt $D^0$ nuclear modification factor in $p$Pb collisions at $\sqrt{s_\mathrm{NN}} = 8.16$ TeV
[to restricted-access page]Information
LHCb-PAPER-2022-007
CERN-EP-2022-082
arXiv:2205.03936 [PDF]
(Submitted on 08 May 2022)
Phys. Rev. Lett. 131 (2023) 102301
Inspire 2694685
Tools
Abstract
The production of prompt $D^0$ mesons in proton-lead collisions in the forward and backward configurations at a center-of-mass energy per nucleon pair of $\sqrt{s_\mathrm{NN}} = 8.16 \mathrm{TeV}$ is measured by the LHCb experiment. The nuclear modification factor of prompt $D^0$ mesons is determined as a function of the transverse momentum $p_\mathrm{T}$, and rapidity in the nucleon-nucleon center-of-mass frame $y^*$. In the forward rapidity region, significantly suppressed production with respect to $pp$ collisions is measured, which provides significant constraints of nuclear parton distributions and hadron production down to the very low Bjorken-$x$ region of $\sim 10^{-5}$. In the backward rapidity region, a suppression with a significance of 2.0 - 3.8 standard deviations compared to nPDF expectations is found in the kinematic region of $p_\mathrm{T}>6 \mathrm{GeV}/c$ and $-3.25<y^*<-2.5$, corresponding to $x\sim 0.01$.
Figures and captions
|
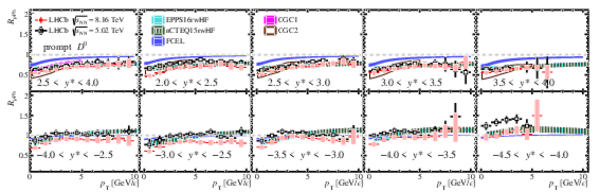
Nuclear modification factor as a function of $ p_{\mathrm{T}} $ in different $y^*$ intervals for prompt $ D ^0 $ mesons in the (top) forward and (bottom) backward regions. The error bars show the statistical uncertainties and the boxes show the systematic uncertainties. The LHCb results at $\sqrt{s_{\scriptscriptstyle\text{NN}}} = 5.02\text{ Te V} $ \cite{LHCb-PAPER-2017-015} and theoretical calculations at $\sqrt{s_{\scriptscriptstyle\text{NN}}} =8.16\text{ Te V} $ from Refs. \cite{Eskola:2016oht,Kovarik:2015cma,Ducloue:2016ywt,Ma:2018bax,Arleo:2021bpv} are also shown. For LHCb results at $\sqrt{s_{\scriptscriptstyle\text{NN}}} =5.02\text{ Te V} $, the error bars show the quadric sum of statistical and systematic uncertainties. |
Fig1.pdf [52 KiB] HiDef png [461 KiB] Thumbnail [259 KiB] *.C file |
|
|
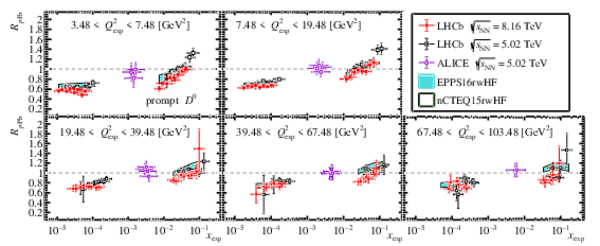
Nuclear modification factor as a function of $x_\mathrm{exp}$ in different $Q^2_\mathrm{exp}$ intervals for prompt $ D ^0 $ mesons for LHCb results at $\sqrt{s_{\scriptscriptstyle\text{NN}}} = 8.16\text{ Te V} $ and $\sqrt{s_{\scriptscriptstyle\text{NN}}} =5.02$ \cite{LHCb-PAPER-2017-015} and the ALICE result at $\sqrt{s_{\scriptscriptstyle\text{NN}}} =5.02\text{ Te V} $ \cite{ALICE:2019fhe}. Theoretical calculations at $\sqrt{s_{\scriptscriptstyle\text{NN}}} =8.16\text{ Te V} $ from Refs. \cite{Eskola:2016oht,Kovarik:2015cma} are also shown. The horizontal error bars account for the maximum and minimum $x_\mathrm{exp}$ values for a given $( p_{\mathrm{T}} , y^*)$ interval and the vertical error bars show the quadric sum of statistical and systematic uncertainties. |
Fig2.pdf [41 KiB] HiDef png [415 KiB] Thumbnail [256 KiB] *.C file |
|
|
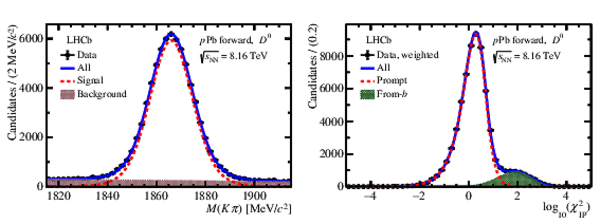
Distributions and fit results of (left) $M( K \pi )$ and (right) $\log_{10}\left(\chi^2_{\text{IP}}\right)$ \ for inclusive $ D ^0$ mesons in the forward data sample in the kinematic range of $2.5< p_{\mathrm{T}} <3.0\text{ Ge V /}c $ and $3.25<y^*<3.50$. For the $\log_{10}\left(\chi^2_{\text{IP}}\right)$ fit, the data are weighted using the sPlot method to subtract the background component. |
Fig3.pdf [33 KiB] HiDef png [257 KiB] Thumbnail [151 KiB] *.C file |
|
|
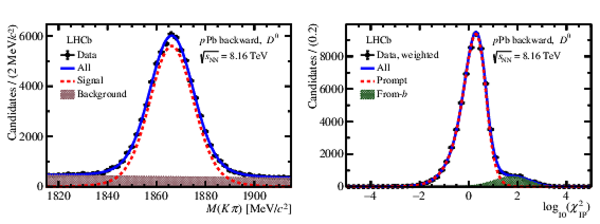
Distributions and fit results of (left) $M( K \pi )$ and (right) $\log_{10}\left(\chi^2_{\text{IP}}\right)$ \ for inclusive $ D ^0$ mesons in the backward data sample in the kinematic range of $2.5< p_{\mathrm{T}} <3.0\text{ Ge V /}c $ and $-4.50<y^*<-4.25$. For the $\log_{10}\left(\chi^2_{\text{IP}}\right)$ fit, the data are weighted using the sPlot method to subtract the background component. |
Fig4.pdf [33 KiB] HiDef png [277 KiB] Thumbnail [158 KiB] *.C file |
|
|
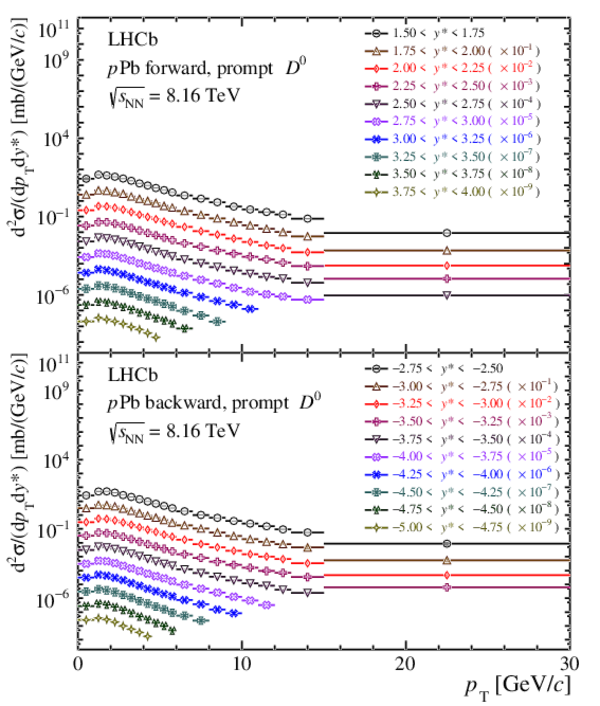
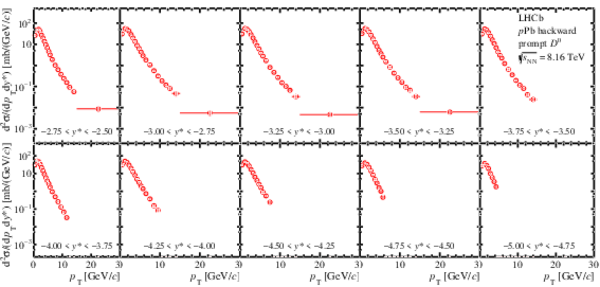
Double-differential cross-sections of prompt $ D ^0$ mesons in $p$Pb collisions in the (top) forward and (bottom) backward rapidity regions. To display the differential cross-section values in different rapidity intervals, multiplicative factors of $10^{-n}$ are used with $n$ increasing with rapidity value. The uncertainties are smaller than the symbol size. |
Fig5.pdf [40 KiB] HiDef png [1 MiB] Thumbnail [631 KiB] *.C file |
|
|
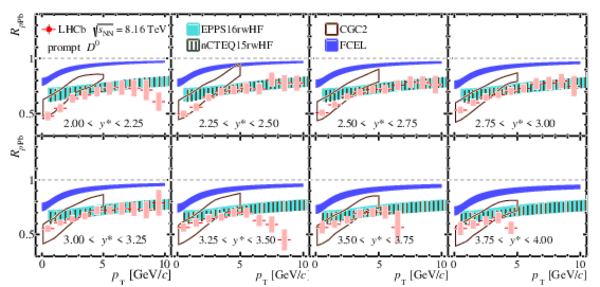
Nuclear modification factor as a function of $ p_{\mathrm{T}} $ in different $y^*$ intervals for prompt $ D ^0 $ mesons in the forward regions for $2.0<y^*<4.0$. The error bars show the statistical uncertainties and the boxes show the systematic uncertainties. The theoretical calculations from Refs. \cite{Eskola:2016oht,Kovarik:2015cma,Ma:2018bax,Arleo:2021bpv} are also shown. |
Fig6.pdf [39 KiB] HiDef png [528 KiB] Thumbnail [327 KiB] *.C file |
|
|
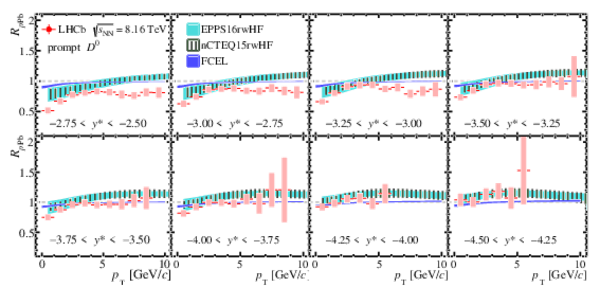
Nuclear modification factor as a function of $ p_{\mathrm{T}} $ in different $y^*$ intervals for prompt $ D ^0 $ mesons in the backward regions for $-4.5<y^*<-2.5$. The error bars show the statistical uncertainties and the boxes show the systematic uncertainties. The theoretical calculations from Refs. \cite{Eskola:2016oht,Kovarik:2015cma,Arleo:2021bpv} are also shown. |
Fig7.pdf [39 KiB] HiDef png [441 KiB] Thumbnail [278 KiB] *.C file |
|
|
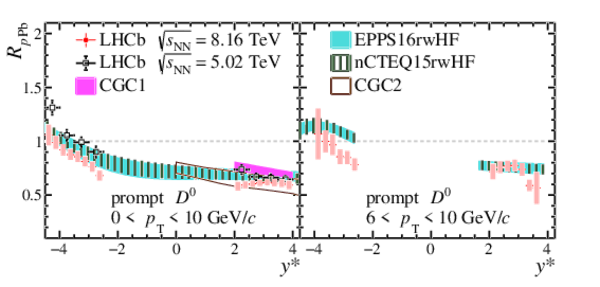
Nuclear modification factor for prompt $ D ^0 $ mesons as a function of $y^*$ in (left) the full- $ p_{\mathrm{T}}$ range and (right) the high- $ p_{\mathrm{T}}$ range. The error bars show the statistical uncertainties and the boxes show the systematic uncertainties. The LHCb results at $\sqrt{s_{\scriptscriptstyle\text{NN}}} =5.02\text{ Te V} $ \cite{LHCb-PAPER-2017-015} and theoretical calculations at $\sqrt{s_{\scriptscriptstyle\text{NN}}} =8.16\text{ Te V} $ from Refs. \cite{Eskola:2016oht,Kovarik:2015cma,Ducloue:2016ywt,Ma:2018bax} are also shown. For the LHCb results at $\sqrt{s_{\scriptscriptstyle\text{NN}}} =5.02\text{ Te V} $, the error bars show the quadratic sum of statistical and systematic uncertainties. On the left, the $ p_{\mathrm{T}}$ range is $0 < p_{\mathrm{T}} < 15\text{ Ge V /}c $ for the calculations with nPDFs of EPPS16 and nCTEQ15. |
Fig8.pdf [19 KiB] HiDef png [272 KiB] Thumbnail [198 KiB] *.C file |
|
|
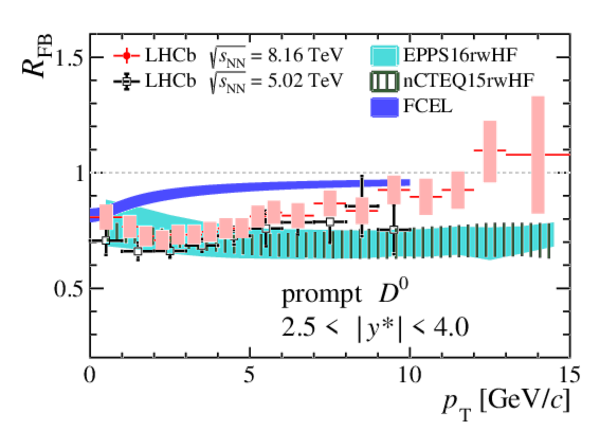
Forward-backward production ratio for prompt $ D ^0$ mesons as a function of $ p_{\mathrm{T}}$ , integrated over the common rapidity range $2.5 < |y^*| < 4.0$. The error bars show the statistical uncertainties and the boxes show the systematic uncertainties. The LHCb results at $\sqrt{s_{\scriptscriptstyle\text{NN}}} = 5.02\text{ Te V} $ \cite{LHCb-PAPER-2017-015} and theoretical calculations at $\sqrt{s_{\scriptscriptstyle\text{NN}}} =8.16\text{ Te V} $ from Refs. \cite{Eskola:2016oht,Kovarik:2015cma,Arleo:2021bpv} are also shown. For the LHCb results at $\sqrt{s_{\scriptscriptstyle\text{NN}}} =5.02\text{ Te V} $, the error bars show the quadratic sum of statistical and systematic uncertainties. |
Fig9.pdf [18 KiB] HiDef png [279 KiB] Thumbnail [198 KiB] *.C file |
|
|
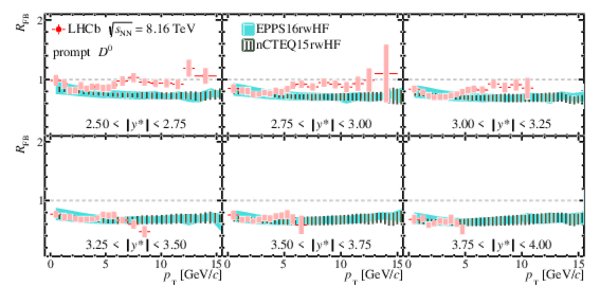
Forward and backward production ratio $R_{\mathrm{FB}}$ for prompt $ D ^0$ mesons as a function of $ p_{\mathrm{T}}$ in different $|y^*|$ intervals. The error bars show the statistical uncertainties and the boxes show the systematic uncertainties. The theoretical calculations from Refs. \cite{Eskola:2016oht,Kovarik:2015cma} are also shown. |
Fig10.pdf [28 KiB] HiDef png [380 KiB] Thumbnail [252 KiB] *.C file |
|
|
Animated gif made out of all figures. |
PAPER-2022-007.gif Thumbnail |

|
![HiDef png [461 KiB]](Directory_LHCb-PAPER-2022-007/hidef_Fig1.png)
![HiDef png [415 KiB]](Directory_LHCb-PAPER-2022-007/hidef_Fig2.png)
![HiDef png [257 KiB]](Directory_LHCb-PAPER-2022-007/hidef_Fig3.png)
![HiDef png [277 KiB]](Directory_LHCb-PAPER-2022-007/hidef_Fig4.png)
![HiDef png [1 MiB]](Directory_LHCb-PAPER-2022-007/hidef_Fig5.png)
![HiDef png [528 KiB]](Directory_LHCb-PAPER-2022-007/hidef_Fig6.png)
![HiDef png [441 KiB]](Directory_LHCb-PAPER-2022-007/hidef_Fig7.png)
![HiDef png [272 KiB]](Directory_LHCb-PAPER-2022-007/hidef_Fig8.png)
![HiDef png [279 KiB]](Directory_LHCb-PAPER-2022-007/hidef_Fig9.png)
![HiDef png [380 KiB]](Directory_LHCb-PAPER-2022-007/hidef_Fig10.png)
Tables and captions
|
Systematic uncertainties considered in this measurement, in %. The range indicates the minimum and the maximum value among the two-dimensional $ p_{\mathrm{T}}$ and $y^*$ intervals. The systematic uncertainties due to simulation sample size, mass fit and $\log_{10}\left(\chi^2_{\text{IP}}\right)$ fit are uncorrelated across the intervals. The other sources of systematic uncertainties are fully correlated between different intervals. |
Table_1.pdf [58 KiB] HiDef png [94 KiB] Thumbnail [45 KiB] tex code |

|
|
Double-differential cross-sections for prompt $ D ^0$ mesons in intervals of $ p_{\mathrm{T}}$ and $y^*$ in forward rapidity regions. The first uncertainty is statistical, the second is the component of the systematic uncertainty that is uncorrelated across intervals and the third is the correlated component. |
Table_2.pdf [64 KiB] HiDef png [337 KiB] Thumbnail [122 KiB] tex code |

|
|
Double-differential cross-sections for prompt $ D ^0$ mesons in intervals of $ p_{\mathrm{T}}$ and $y^*$ in backward rapidity regions. The first uncertainty is statistical, the second is the component of the systematic uncertainty that is uncorrelated across intervals and the third is the correlated component. |
Table_3.pdf [64 KiB] HiDef png [285 KiB] Thumbnail [121 KiB] tex code |

|
|
Nuclear modification factor $R_{p\mathrm{Pb}}$ for prompt $ D ^0$ mesons in intervals of $ p_{\mathrm{T}}$ and $y^*$ for $ p_{\mathrm{T}} <10\text{ Ge V /}c $. The first uncertainty is statistical and the second is the systematic. |
Table_4.pdf [67 KiB] HiDef png [87 KiB] Thumbnail [33 KiB] tex code |

|
|
Nuclear modification factor $R_{p\mathrm{Pb}}$ for prompt $ D ^0$ mesons in intervals of $ p_{\mathrm{T}}$ and $y^*$ for $ p_{\mathrm{T}} <10\text{ Ge V /}c $. The first uncertainty is statistical and the second is systematic. |
Table_5.pdf [67 KiB] HiDef png [86 KiB] Thumbnail [33 KiB] tex code |

|
|
Forward-backward production ratio $R_\mathrm{FB}$ for prompt $ D ^0$ mesons as a function of $ p_{\mathrm{T}}$ , integrated over $2.5<|y^*|<4.0$. The first uncertainty is statistical, the second is the component of the systematic uncertainty that is uncorrelated across intervals and the third is the correlated component. |
Table_6.pdf [52 KiB] HiDef png [282 KiB] Thumbnail [137 KiB] tex code |

|
![HiDef png [94 KiB]](Directory_LHCb-PAPER-2022-007/hidef_Table_1.png)
![HiDef png [337 KiB]](Directory_LHCb-PAPER-2022-007/hidef_Table_2.png)
![HiDef png [285 KiB]](Directory_LHCb-PAPER-2022-007/hidef_Table_3.png)
![HiDef png [87 KiB]](Directory_LHCb-PAPER-2022-007/hidef_Table_4.png)
![HiDef png [86 KiB]](Directory_LHCb-PAPER-2022-007/hidef_Table_5.png)
![HiDef png [282 KiB]](Directory_LHCb-PAPER-2022-007/hidef_Table_6.png)
Supplementary Material [file]
| Supplementary material full pdf |
supple[..].pdf [243 KiB] |
|
|
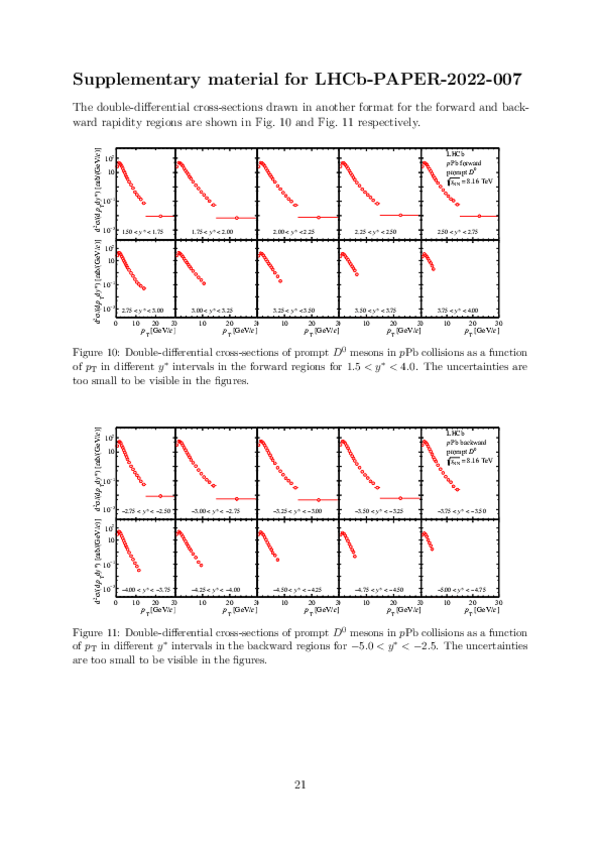
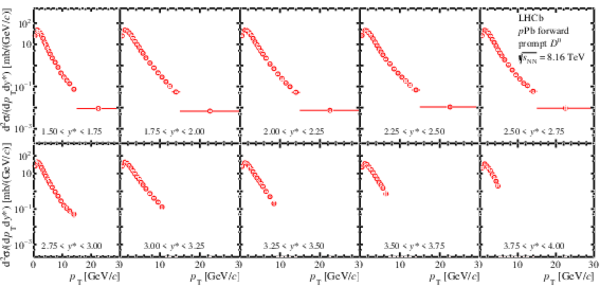
This ZIP file contains the supplementary for publication LHCb-PAPER-2022-007 The files are: supplementary.pdf: the double-differential cross-sections of D0 production for forward and backward data plotted in another format Fig10.*: figures for the double-differential cross-sections in forward rapidity regions Fig11.*: figures for the double-differential cross-sections in background rapidity regions |
Fig10.pdf [28 KiB] HiDef png [336 KiB] Thumbnail [202 KiB] *C file |
|
|
Fig11.pdf [28 KiB] HiDef png [341 KiB] Thumbnail [204 KiB] *C file |
|
![HiDef png [336 KiB]](Directory_LHCb-PAPER-2022-007/supplementary/hidef_Fig10.png)
![HiDef png [341 KiB]](Directory_LHCb-PAPER-2022-007/supplementary/hidef_Fig11.png)
Created on 13 April 2024.