Charmonium production in $p$Ne collisions at $\sqrt{s_{\rm NN}}=68.5$ GeV
[to restricted-access page]Information
LHCb-PAPER-2022-014
CERN-EP-2022-216
arXiv:2211.11645 [PDF]
(Submitted on 21 Nov 2022)
Eur. Phys. J. C83 (2023) 625
Inspire 2678329
Tools
Abstract
The measurement of charmonium states produced in proton-neon ($p$Ne) collisions by the LHCb experiment in its fixed-target configuration is presented. The production of $J/\psi$ and $\psi(2S)$ mesons is studied with a beam of 2.5 TeV protons colliding on gaseous neon targets at rest, corresponding to a nucleon-nucleon centre-of-mass energy $\sqrt{s_{\rm NN}}=68.5$ GeV. The data sample corresponds to an integrated luminosity of $21.7\pm 1.4 $ nb$^{-1}$. The $J/\psi$ and $\psi(2S)$ hadrons are reconstructed in $\mu^+\mu^-$ final states. The $J/\psi$ production cross-section per target nucleon in the centre-of-mass rapidity range $y^{*}\in [-2.29, 0]$ is found to be $506 \pm 8 \pm 25 \textrm{ nb/nucleon}$. The $\psi(2S)$ to $J/\psi$ relative production rate is found to be $(1.67 \pm 0.27\pm 0.10)\%$ in good agreement with other measurements involving beam and target nuclei of similar sizes.
Figures and captions
|
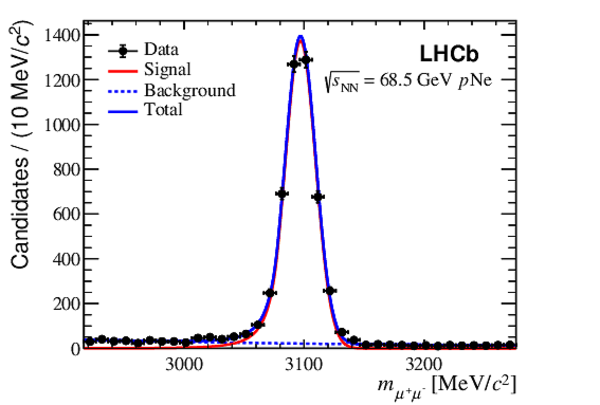
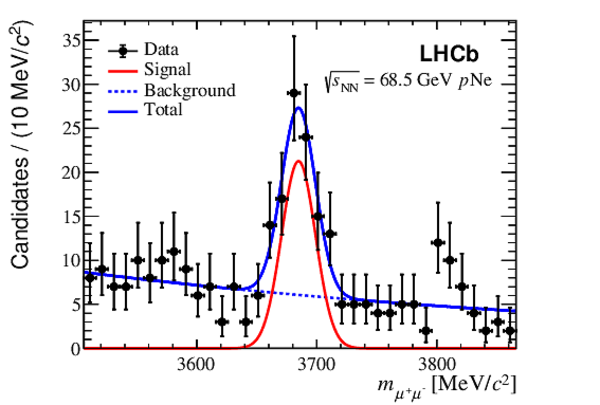
Invariant mass distributions of (left) $ { J \mskip -3mu/\mskip -2mu\psi } \rightarrow \mu ^- \mu ^+ $ candidates and (right) $\psi {(2S)} \rightarrow \mu ^- \mu ^+ $ candidates. The data are overlaid with the fit function. |
Fig1a.pdf [20 KiB] HiDef png [197 KiB] Thumbnail [163 KiB] *.C file |
|
|
Fig1b.pdf [20 KiB] HiDef png [211 KiB] Thumbnail [191 KiB] *.C file |
|
|
|
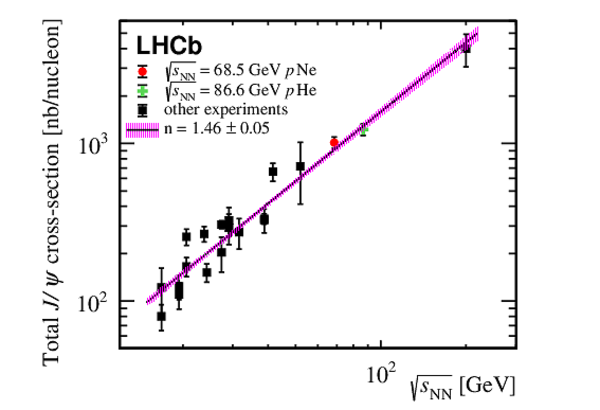
Total $ { J \mskip -3mu/\mskip -2mu\psi }$ cross-section per target nucleon as a function of centre-of-mass energy. Experimental data, represented by black points, are taken from Ref. [24]. The red point corresponds to the $ p\text{Ne}$ result from the present analysis. The green point corresponds to a measurement performed by LHCb with $ p\text{He}$ collisions [13]. |
Fig2.pdf [308 KiB] HiDef png [166 KiB] Thumbnail [137 KiB] *.C file |
|
|
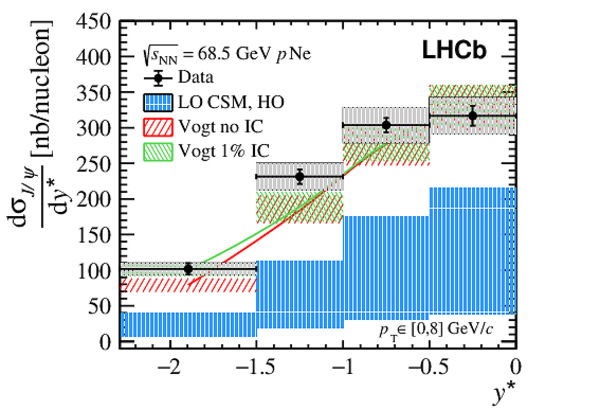
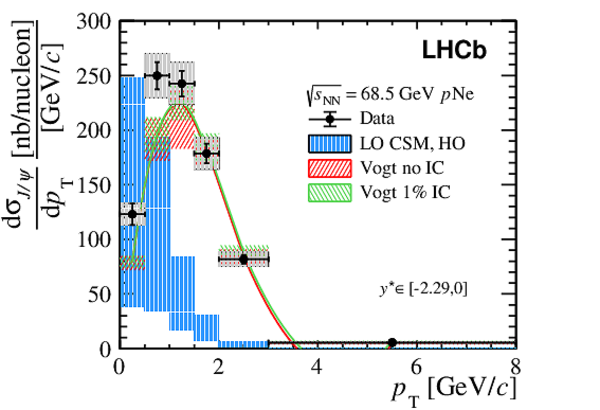
Differential $ { J \mskip -3mu/\mskip -2mu\psi }$ cross-section as a function of (left) $y^\star$ and (right) $ p_{\mathrm{T}}$ . The quadratic sums of statistical and uncorrelated systematic uncertainties are given by the error bars, while the grey boxes represent the correlated systematic uncertainties. Blue boxes (LO CSM, HO) correspond to predictions using the CT14NLO and nCTEQ15 PDF sets [28,29,30,31]. Green and red boxes correspond to predictions (Vogt) from [32] with and without a 1$\%$ intrinsic charm (IC) contribution respectively (green and red lines indicate the central values). |
Fig3a.pdf [17 KiB] HiDef png [1 MiB] Thumbnail [294 KiB] *.C file |
|
|
Fig3b.pdf [18 KiB] HiDef png [617 KiB] Thumbnail [230 KiB] *.C file |
|
|
|
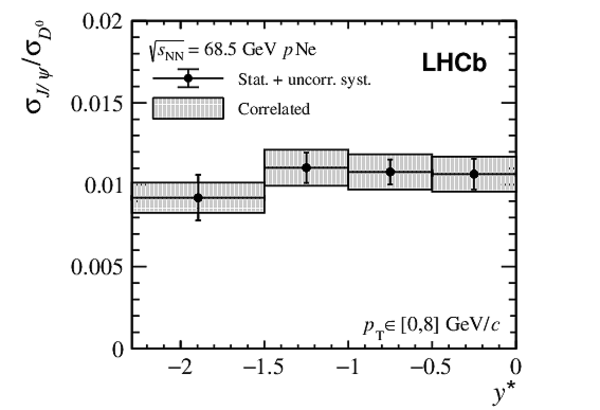
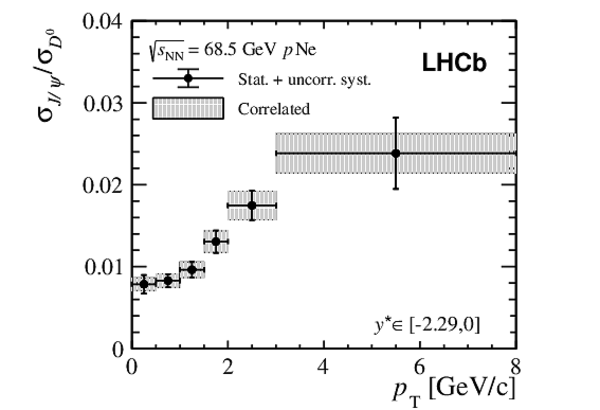
Ratio of $ { J \mskip -3mu/\mskip -2mu\psi }$ and $ D ^0$ cross-sections as a function of (left) $y^\star$ and (right) $ p_{\mathrm{T}}$ . The quadratic sums of the statistical and uncorrelated systematic uncertainties are given by the error bars, while the grey boxes represent the correlated systematic uncertainties. |
Fig4a.pdf [14 KiB] HiDef png [214 KiB] Thumbnail [66 KiB] *.C file |
|
|
Fig4b.pdf [14 KiB] HiDef png [221 KiB] Thumbnail [63 KiB] *.C file |
|
|
|
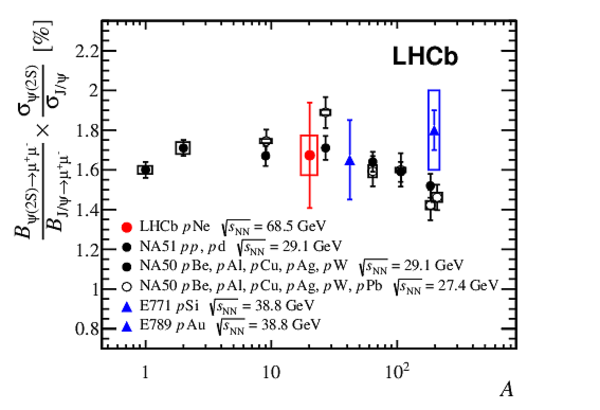
The $\psi {(2S)}$ -to- $ { J \mskip -3mu/\mskip -2mu\psi }$ production ratio as a function of the target atomic mass number $A$. The red point corresponds to the $\sqrt{s_{\scriptscriptstyle\text{NN}}} =68.5\text{ Ge V} $ $ p\text{Ne}$ result from the present analysis, vertical error bar corresponds to the statistical uncertainty and the box to the systematic uncertainty. The other points show previous fixed-target experimental data at various centre-of-mass energies [33,34,35,36,37]. |
Fig5.pdf [16 KiB] HiDef png [185 KiB] Thumbnail [186 KiB] *.C file |
|
|
Animated gif made out of all figures. |
PAPER-2022-014.gif Thumbnail |

|
![HiDef png [197 KiB]](Directory_LHCb-PAPER-2022-014/hidef_Fig1a.png)
![HiDef png [211 KiB]](Directory_LHCb-PAPER-2022-014/hidef_Fig1b.png)
![HiDef png [166 KiB]](Directory_LHCb-PAPER-2022-014/hidef_Fig2.png)
![HiDef png [1 MiB]](Directory_LHCb-PAPER-2022-014/hidef_Fig3a.png)
![HiDef png [617 KiB]](Directory_LHCb-PAPER-2022-014/hidef_Fig3b.png)
![HiDef png [214 KiB]](Directory_LHCb-PAPER-2022-014/hidef_Fig4a.png)
![HiDef png [221 KiB]](Directory_LHCb-PAPER-2022-014/hidef_Fig4b.png)
![HiDef png [185 KiB]](Directory_LHCb-PAPER-2022-014/hidef_Fig5.png)
Tables and captions
|
Systematic and statistical uncertainties on the $ { J \mskip -3mu/\mskip -2mu\psi }$ meson yield. Systematic uncertainties correlated between bins affect all measurements by the same relative amount. Ranges denote the minimum and the maximum values among the $y^{\star}$ or $ p_{\mathrm{T}}$ intervals while the latter value is the uncertainty integrated over $y^{\star}$ or $ p_{\mathrm{T}}$ . |
Table_1.pdf [41 KiB] HiDef png [128 KiB] Thumbnail [57 KiB] tex code |

|
![HiDef png [128 KiB]](Directory_LHCb-PAPER-2022-014/hidef_Table_1.png)
Created on 20 April 2024.