Amplitude analysis of the $D^+ \to \pi^-\pi^+\pi^+$ decay and measurement of the $\pi^-\pi^+$ S-wave amplitude
[to restricted-access page]Information
LHCb-PAPER-2022-016
CERN-EP-2022-136
arXiv:2208.03300 [PDF]
(Submitted on 05 Aug 2022)
JHEP 06 (2023) 044
Inspire 2132748
Tools
Abstract
An amplitude analysis of the $D^+ \to \pi^- \pi^+ \pi^+$ decay is performed with a sample corresponding to $1.5\rm fb^{-1}$ of integrated luminosity of $pp$ collisions at a centre-of-mass energy $\sqrt{s}=8$ TeV collected by the LHCb detector in 2012. The sample contains approximately six hundred thousand candidates with a signal purity of $95\%$. The resonant structure is studied through a fit to the Dalitz plot where the $\pi^- \pi^+$ S-wave amplitude is extracted as a function of $\pi^-\pi^+$ mass, and spin-1 and spin-2 resonances are included coherently through an isobar model. The S-wave component is found to be dominant, followed by the $\rho(770)^0\pi^+$ and $f_2(1270)\pi^+$ components. A small contribution from the $\omega(782)\to\pi^-\pi^+$ decay is seen for the first time in the $D^+ \to \pi^- \pi^+ \pi^+$ decay.
Figures and captions
|
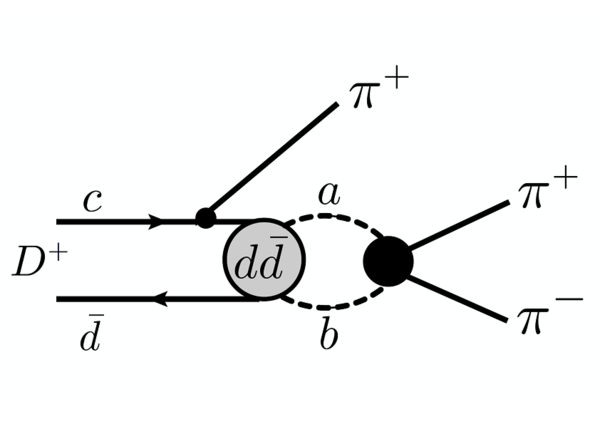
Leading diagram for the $ D ^+ \rightarrow \pi ^- \pi ^+ \pi ^+ $ decay. Possible rescattering effects are represented by the $a, b$ meson pair. |
Fig1.pdf [97 KiB] HiDef png [150 KiB] Thumbnail [82 KiB] *.C file |
|
|
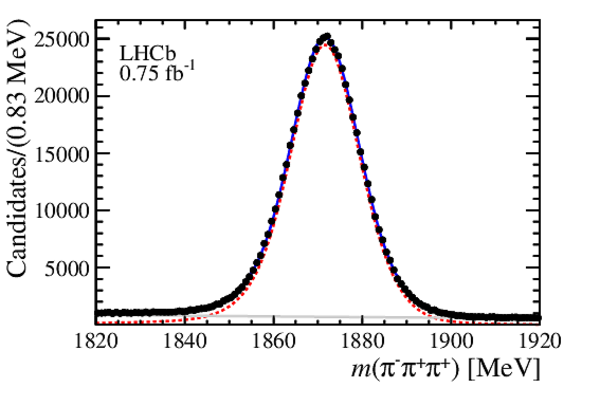
Invariant-mass distribution of $ D ^+ \rightarrow \pi ^- \pi ^+ \pi ^+ $ candidates after final selection, with the fit result superimposed (blue solid line). The dashed red line and the solid gray line correspond to the signal and background components of the fit, respectively. |
Fig2.pdf [39 KiB] HiDef png [187 KiB] Thumbnail [157 KiB] *.C file |
|
|
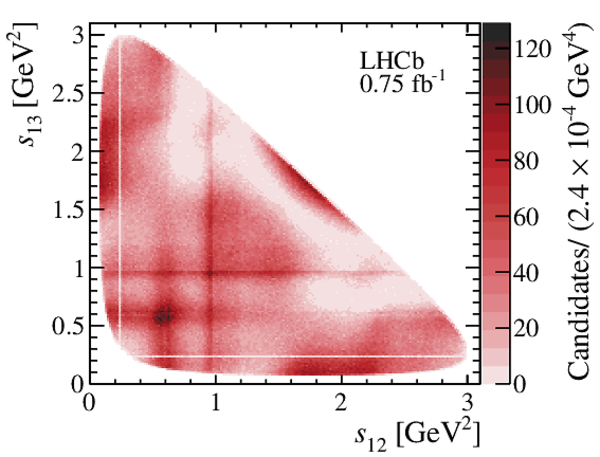
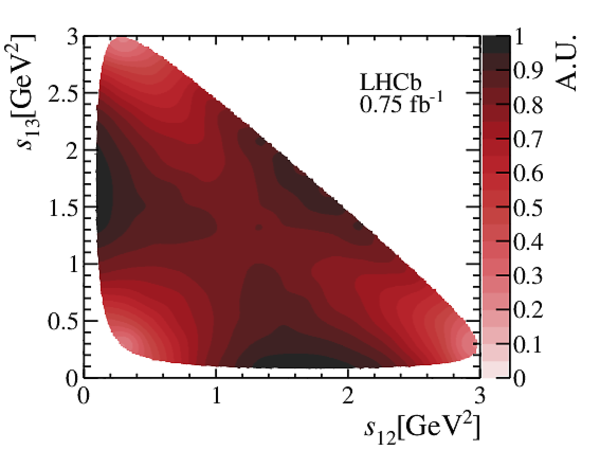
Dalitz plot distribution of the final $ D ^+ \rightarrow \pi ^- \pi ^+ \pi ^+ $ sample. The lines in the interval $[0.235, 0.250]\text{ Ge V} ^2$ correspond to the veto applied to remove $ D ^+ \rightarrow K ^0_{\mathrm{S}} \pi ^+ $ decays. |
Fig3.pdf [110 KiB] HiDef png [1 MiB] Thumbnail [523 KiB] *.C file |
|
|
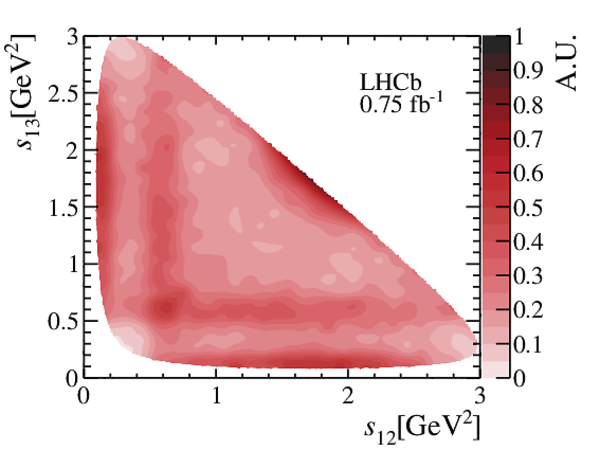
Models for (left) background distribution and (right) signal efficiency across the Dalitz plot, where the $z$-axis scale is arbitrary. |
Fig4a.pdf [1 MiB] HiDef png [599 KiB] Thumbnail [315 KiB] *.C file |
|
|
Fig4b.pdf [1 MiB] HiDef png [400 KiB] Thumbnail [255 KiB] *.C file |
|
|
|
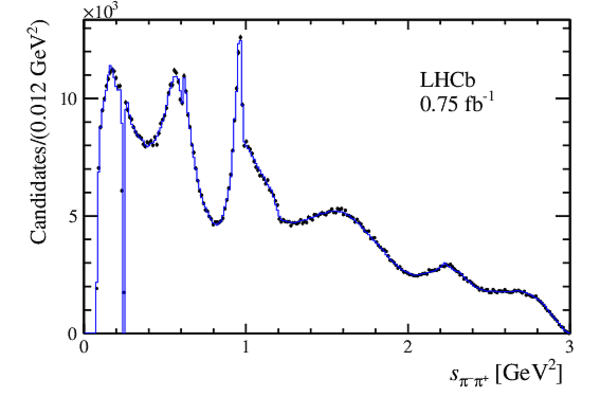
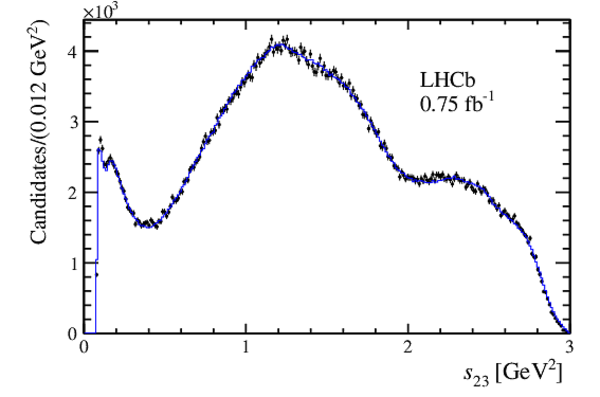
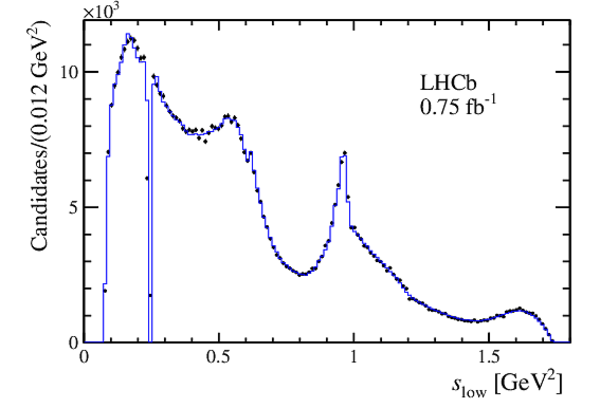
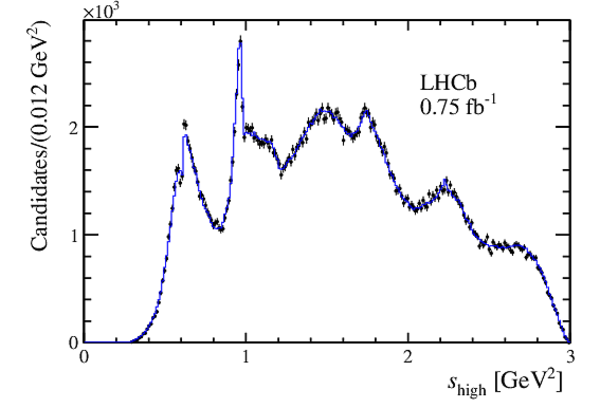
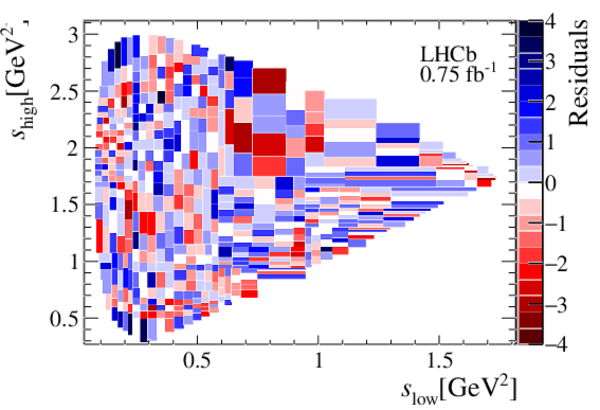
Dalitz plot projections of (top left) $s_{\pi ^- \pi ^+ }$, (top right) $s_{23}$, (middle left) $s_{\rm low}$, and (middle right) $s_{\rm high}$ projections, where the (red) points are data and the (blue) line is the fit model result, with the fit normalised residuals displayed in the bottom plot. |
Fig5a.pdf [27 KiB] HiDef png [141 KiB] Thumbnail [106 KiB] *.C file |
|
|
Fig5b.pdf [28 KiB] HiDef png [158 KiB] Thumbnail [123 KiB] *.C file |
|
|
|
Fig5c.pdf [23 KiB] HiDef png [129 KiB] Thumbnail [101 KiB] *.C file |
|
|
|
Fig5d.pdf [27 KiB] HiDef png [165 KiB] Thumbnail [122 KiB] *.C file |
|
|
|
Fig5e.pdf [25 KiB] HiDef png [262 KiB] Thumbnail [241 KiB] *.C file |
|
|
|
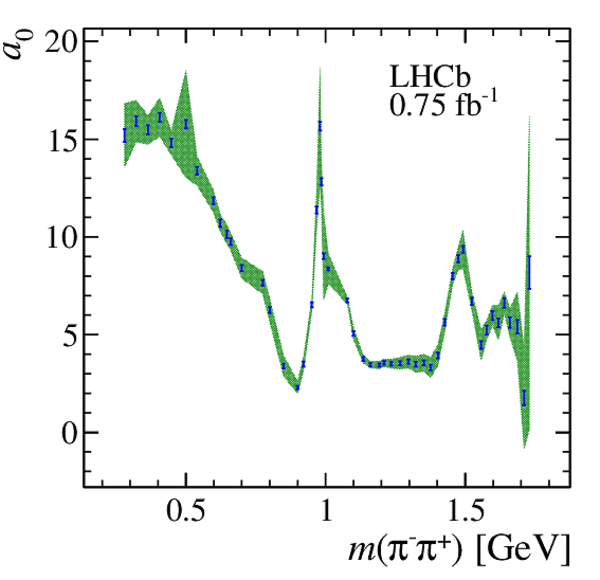
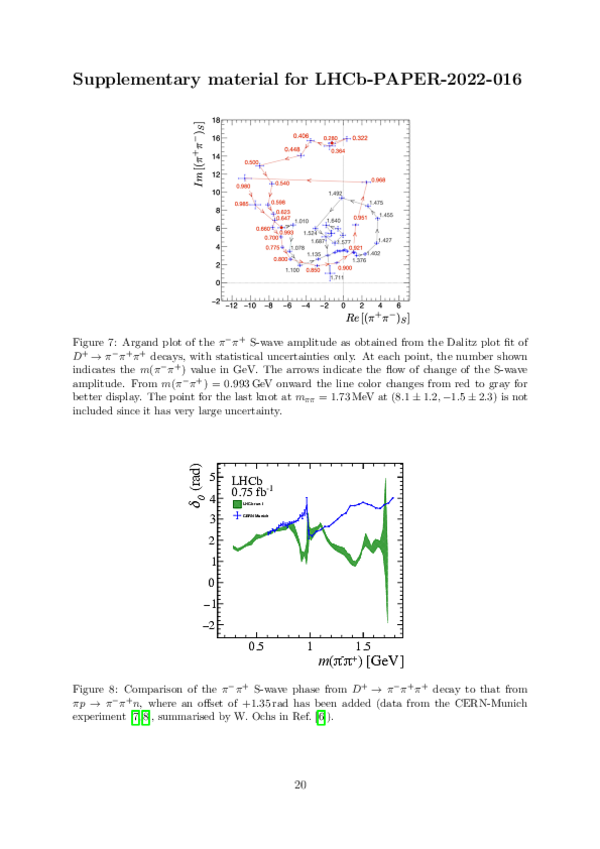
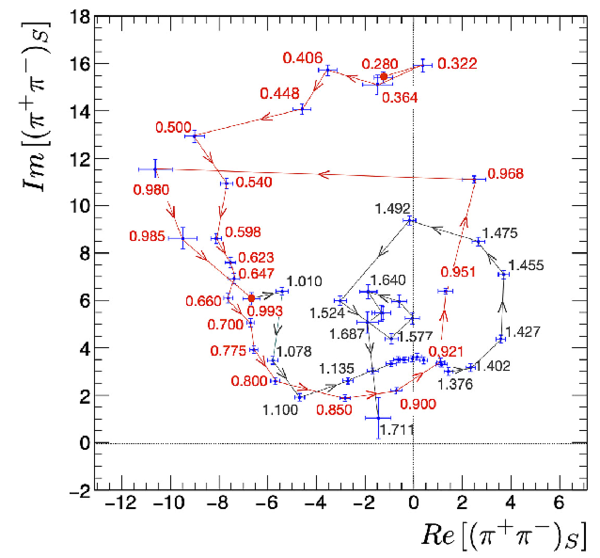
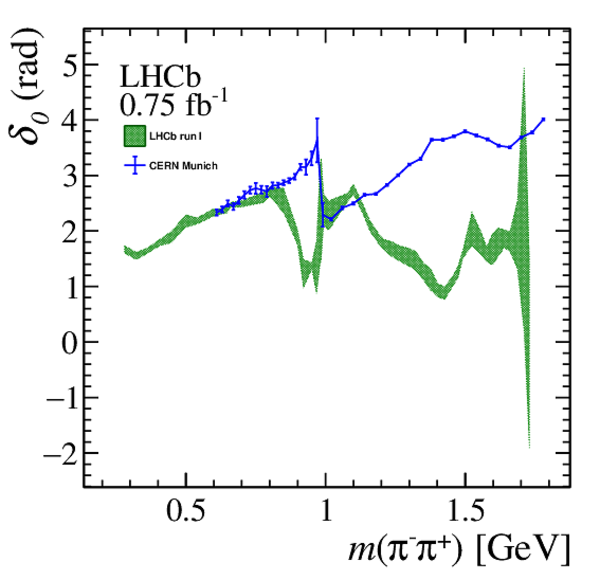
Fitted (left) magnitude and (right) phase of the $\pi ^-$ $\pi ^+$ S-wave amplitude with statistical uncertainties as the blue bars and the total uncertainties (combined statistical, experimental and model systematics) as the green bands. |
Fig6a.pdf [34 KiB] HiDef png [477 KiB] Thumbnail [204 KiB] *.C file |
|
|
Fig6b.pdf [27 KiB] HiDef png [366 KiB] Thumbnail [188 KiB] *.C file |

|
|
|
Animated gif made out of all figures. |
PAPER-2022-016.gif Thumbnail |

|
![HiDef png [150 KiB]](Directory_LHCb-PAPER-2022-016/hidef_Fig1.png)
![HiDef png [187 KiB]](Directory_LHCb-PAPER-2022-016/hidef_Fig2.png)
![HiDef png [1 MiB]](Directory_LHCb-PAPER-2022-016/hidef_Fig3.png)
![HiDef png [599 KiB]](Directory_LHCb-PAPER-2022-016/hidef_Fig4a.png)
![HiDef png [400 KiB]](Directory_LHCb-PAPER-2022-016/hidef_Fig4b.png)
![HiDef png [141 KiB]](Directory_LHCb-PAPER-2022-016/hidef_Fig5a.png)
![HiDef png [158 KiB]](Directory_LHCb-PAPER-2022-016/hidef_Fig5b.png)
![HiDef png [129 KiB]](Directory_LHCb-PAPER-2022-016/hidef_Fig5c.png)
![HiDef png [165 KiB]](Directory_LHCb-PAPER-2022-016/hidef_Fig5d.png)
![HiDef png [262 KiB]](Directory_LHCb-PAPER-2022-016/hidef_Fig5e.png)
![HiDef png [477 KiB]](Directory_LHCb-PAPER-2022-016/hidef_Fig6a.png)
![HiDef png [366 KiB]](Directory_LHCb-PAPER-2022-016/hidef_Fig6b.png)
Tables and captions
|
Spin-dependent Blatt-Weisskopf barrier factors. |
Table_1.pdf [52 KiB] HiDef png [64 KiB] Thumbnail [29 KiB] tex code |

|
|
Dalitz fit results for magnitudes, phases and fit fractions (%) of the spin-1 and spin-2 components, and the S-wave fit fraction. The uncertainties quoted are, in order, statistical, experimental systematics, and model systematics. |
Table_2.pdf [80 KiB] HiDef png [58 KiB] Thumbnail [25 KiB] tex code |

|
|
Dalitz fit results for the interference fit fractions (%) (statistical uncertainties only). |
Table_3.pdf [52 KiB] HiDef png [44 KiB] Thumbnail [20 KiB] tex code |

|
|
Fitted magnitude and phase of the S-wave amplitude at each $\pi ^-$ $\pi ^+$ mass knot, relative to the $\rho(770)^0\pi ^+ $ channel. The uncertainties quoted are, in order, statistical, experimental systematics and model systematics. |
Table_4.pdf [69 KiB] HiDef png [461 KiB] Thumbnail [208 KiB] tex code |

|
![HiDef png [64 KiB]](Directory_LHCb-PAPER-2022-016/hidef_Table_1.png)
![HiDef png [58 KiB]](Directory_LHCb-PAPER-2022-016/hidef_Table_2.png)
![HiDef png [44 KiB]](Directory_LHCb-PAPER-2022-016/hidef_Table_3.png)
![HiDef png [461 KiB]](Directory_LHCb-PAPER-2022-016/hidef_Table_4.png)
Supplementary Material [file]
| Supplementary material full pdf |
supple[..].pdf [424 KiB] |
|
|
This ZIP file contains supplementary material for the publication LHCb-PAPER-2022-016. The files are: Supplementary.pdf : An overview of the extra figures *.pdf, *.png, *.eps : The figures in various formats |
Fig1-S.pdf [165 KiB] HiDef png [1 MiB] Thumbnail [392 KiB] *C file |
|
|
Fig2-S.pdf [28 KiB] HiDef png [411 KiB] Thumbnail [211 KiB] *C file |
|
![HiDef png [1 MiB]](Directory_LHCb-PAPER-2022-016/supplementary/hidef_Fig1-S.png)
![HiDef png [411 KiB]](Directory_LHCb-PAPER-2022-016/supplementary/hidef_Fig2-S.png)
Created on 20 April 2024.