Information
LHCb-PAPER-2022-019
CERN-EP-2022-205
arXiv:2211.05034 [PDF]
(Submitted on 09 Nov 2022)
PRD 108, 034012
Inspire 2178454
Tools
Abstract
The $B^+ \rightarrow D_s^+ D_s^- K^+$ decay is observed for the first time using proton-proton collision data collected by the LHCb detector at centre-of-mass energies of $7$, $8$ and $13 \text{TeV}$, corresponding to an integrated luminosity of $9 \text{fb}^{-1}$. Its branching fraction relative to that of the $B^{+} \rightarrow D^{+} D^{-} K^{+}$ decay is measured to be $$\frac{B\left(B^{+} \rightarrow D_s^{+} D_s^{-} K^{+}\right)}{B\left(B^{+} \rightarrow D^{+} D^{-} K^{+}\right)}=0.525 \pm 0.033 \pm 0.027 \pm 0.034,$$ where the first uncertainty is statistical, the second systematic, and the third is due to the uncertainties on the branching fractions of the $D_s^{\pm} \rightarrow K^{\mp} K^{\pm} \pi^{\pm}$ and $D^{\pm} \rightarrow K^{\mp} \pi^{\pm} \pi^{\pm}$ decays. This measurement fills an experimental gap in the knowledge of the family of Cabibbo$-$favoured $\bar{b} \rightarrow \bar{c} c \bar{s}$ transitions and opens the path for unique studies of spectroscopy in future.
Figures and captions
|
Feynman diagrams contributing to the $ B ^+ \rightarrow D ^+_ s D ^-_ s K ^+ $ decay. |
Fig1.pdf [155 KiB] HiDef png [27 KiB] Thumbnail [13 KiB] *.C file |

|
|
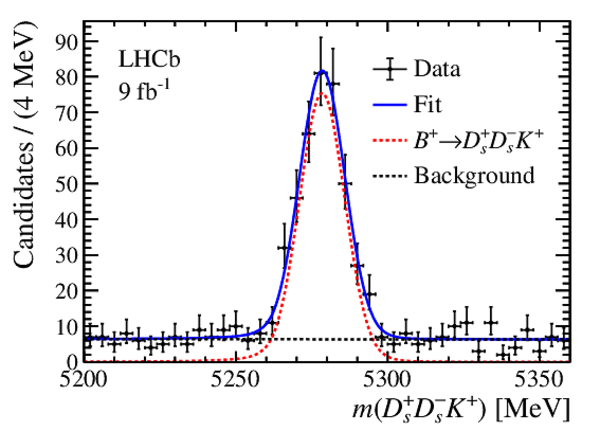
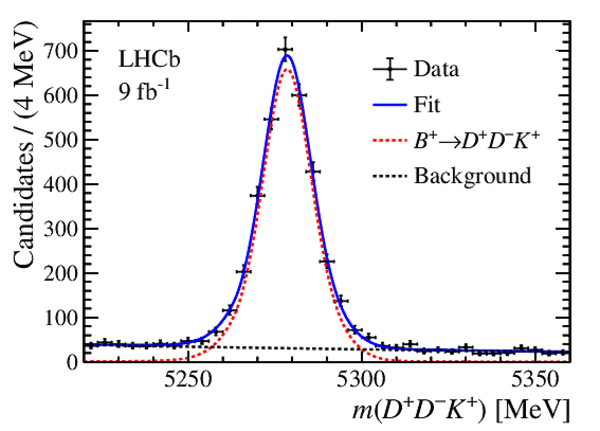
Invariant-mass distributions of reconstructed (left) $ D ^+_ s $ $ D ^-_ s $ $ K ^+$ and (right) $ D ^+$ $ D ^-$ $ K ^+$ candidates. The fit results are overlaid. |
Fig2a.pdf [20 KiB] HiDef png [252 KiB] Thumbnail [229 KiB] *.C file |
|
|
Fig2b.pdf [19 KiB] HiDef png [233 KiB] Thumbnail [199 KiB] *.C file |
|
|
|
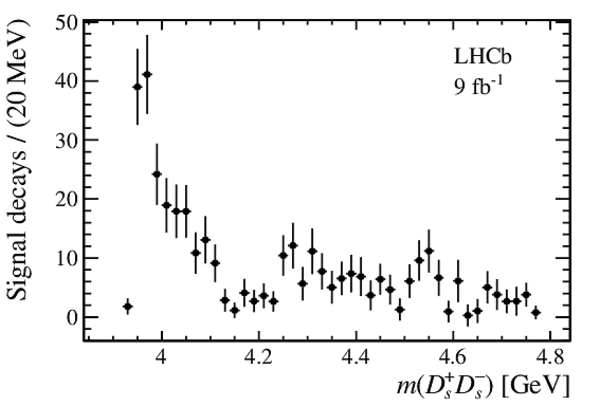
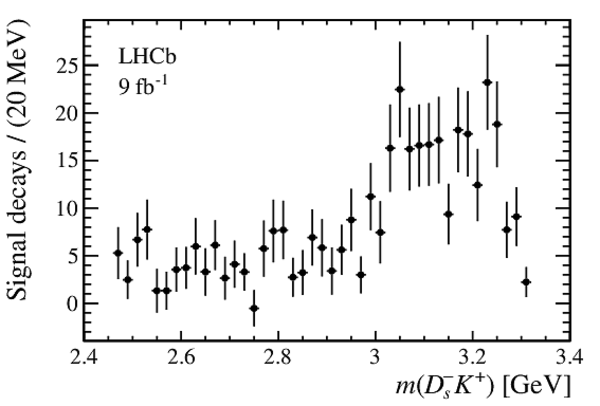
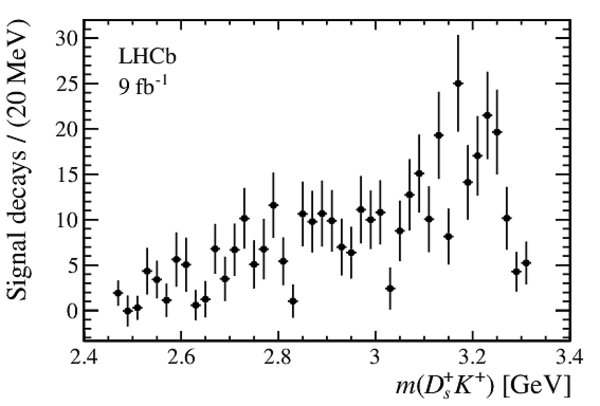
Distributions of background-subtracted invariant mass of the (top) $ D ^+_ s $ $ D ^-_ s $ , (bottom left) $ D ^-_ s $ $ K ^+$ and (bottom right) $ D ^+_ s $ $ K ^+$ systems of the $ B ^+ \rightarrow D ^+_ s D ^-_ s K ^+ $ decay. |
Fig3a.pdf [16 KiB] HiDef png [96 KiB] Thumbnail [57 KiB] *.C file |
|
|
Fig3b.pdf [16 KiB] HiDef png [99 KiB] Thumbnail [58 KiB] *.C file |
|
|
|
Fig3c.pdf [16 KiB] HiDef png [102 KiB] Thumbnail [60 KiB] *.C file |
|
|
|
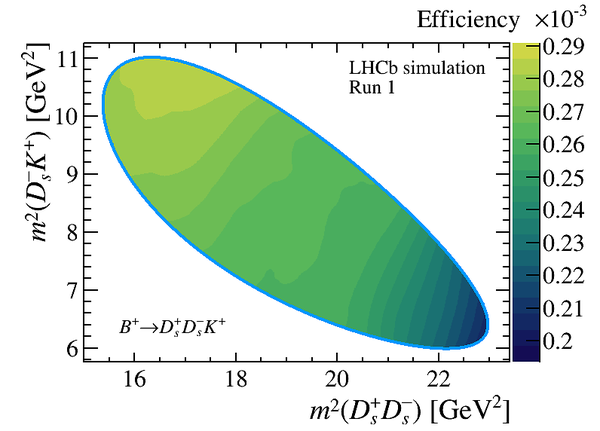
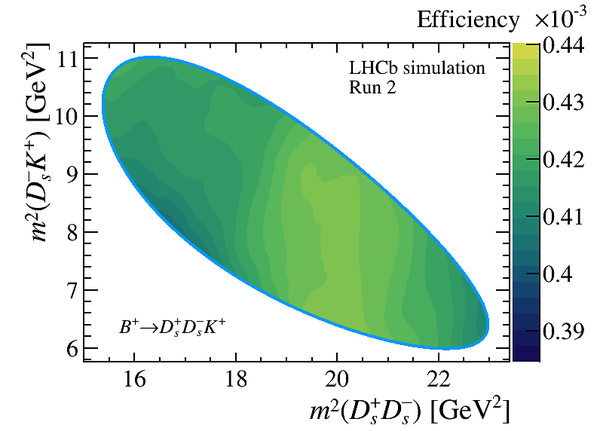
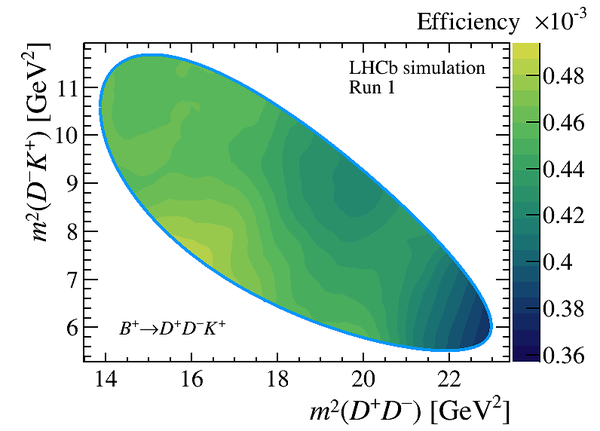
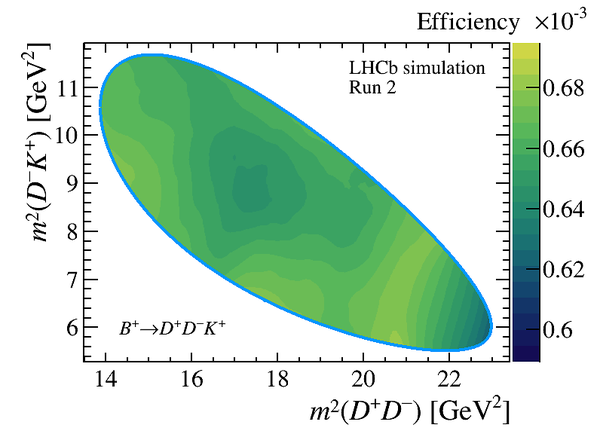
Efficiency as a function of the Dalitz-plot variables for the (top) $ B ^+ \rightarrow D ^+_ s D ^-_ s K ^+ $ and (bottom) $ B ^+ \rightarrow D ^+ D ^- K ^+ $ decays, calculated separately for the (left) Run1 and (right) Run2 periods. |
Fig4a.png [25 KiB] HiDef png [167 KiB] Thumbnail [90 KiB] *.C file |
|
|
Fig4b.png [24 KiB] HiDef png [155 KiB] Thumbnail [84 KiB] *.C file |
|
|
|
Fig4c.png [26 KiB] HiDef png [165 KiB] Thumbnail [90 KiB] *.C file |
|
|
|
Fig4d.png [25 KiB] HiDef png [160 KiB] Thumbnail [88 KiB] *.C file |
|
|
|
Animated gif made out of all figures. |
PAPER-2022-019.gif Thumbnail |

|
![HiDef png [27 KiB]](Directory_LHCb-PAPER-2022-019/hidef_Fig1.png)
![HiDef png [252 KiB]](Directory_LHCb-PAPER-2022-019/hidef_Fig2a.png)
![HiDef png [233 KiB]](Directory_LHCb-PAPER-2022-019/hidef_Fig2b.png)
![HiDef png [96 KiB]](Directory_LHCb-PAPER-2022-019/hidef_Fig3a.png)
![HiDef png [99 KiB]](Directory_LHCb-PAPER-2022-019/hidef_Fig3b.png)
![HiDef png [102 KiB]](Directory_LHCb-PAPER-2022-019/hidef_Fig3c.png)
![Fig4a.png [25 KiB]](Directory_LHCb-PAPER-2022-019/Fig4a.png)
![HiDef png [167 KiB]](Directory_LHCb-PAPER-2022-019/hidef_Fig4a.png)
![Fig4b.png [24 KiB]](Directory_LHCb-PAPER-2022-019/Fig4b.png)
![HiDef png [155 KiB]](Directory_LHCb-PAPER-2022-019/hidef_Fig4b.png)
![Fig4c.png [26 KiB]](Directory_LHCb-PAPER-2022-019/Fig4c.png)
![HiDef png [165 KiB]](Directory_LHCb-PAPER-2022-019/hidef_Fig4c.png)
![Fig4d.png [25 KiB]](Directory_LHCb-PAPER-2022-019/Fig4d.png)
![HiDef png [160 KiB]](Directory_LHCb-PAPER-2022-019/hidef_Fig4d.png)
Tables and captions
|
Sources of systematic uncertainty on the branching-fraction ratio. The statistical uncertainty is also given. |
Table_1.pdf [37 KiB] HiDef png [96 KiB] Thumbnail [42 KiB] tex code |

|
![HiDef png [96 KiB]](Directory_LHCb-PAPER-2022-019/hidef_Table_1.png)
Created on 19 April 2024.