Model-independent measurement of charm mixing parameters in $\bar{B} \rightarrow D^0 ( \rightarrow K_S^0 \pi^+ \pi^-) \mu^- \bar{\nu}_\mu X$ decays
[to restricted-access page]Information
LHCb-PAPER-2022-020
CERN-EP-2022-160
arXiv:2208.06512 [PDF]
(Submitted on 12 Aug 2022)
Phys. Rev. D108 (2023) 052005
Inspire 2694330
Tools
Abstract
A measurement of charm mixing and $CP$-violating parameters is reported, using $\bar{B} \rightarrow D^0 ( \rightarrow K_S^0 \pi^+ \pi^-) \mu^- \bar{\nu}_\mu X$ decays reconstructed in proton-proton collisions collected by the LHCb experiment during the years 2016 to 2018, corresponding to an integrated luminosity of 5.4 fb$^{-1}$. The measured mixing and $CP$-violating parameters are $$x_{\rm CP} = [ 4.29 \pm 1.48 (stat) \pm 0.26 (syst) ] \times 10^{-3} ,$$ $$y_{\rm CP} = [ 12.61 \pm 3.12 (stat) \pm 0.83 (syst) ] \times 10^{-3} ,$$ $$\Delta x = [ -0.77 \pm 0.93 (stat) \pm 0.28 (syst) ] \times 10^{-3} ,$$ $$\Delta y = [ 3.01 \pm 1.92 (stat) \pm 0.26 (syst) ] \times 10^{-3} .$$ The results are complementary to and consistent with previous measurements. A combination with the recent LHCb analysis of $D^{*+} \rightarrow D^0 ( \rightarrow K_S^0 \pi^+ \pi^-) \pi^+ $ decays is reported.
Figures and captions
|
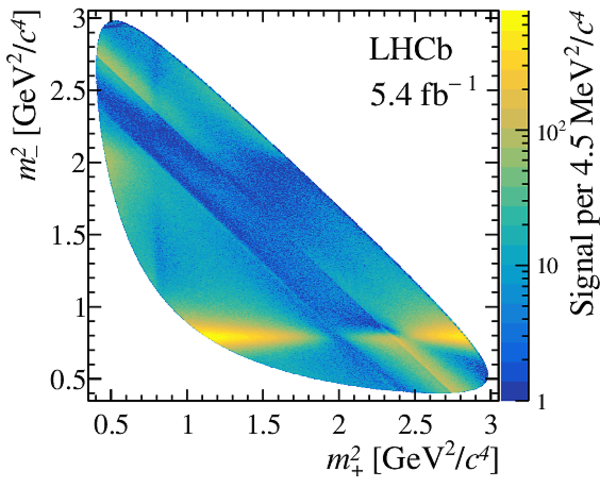
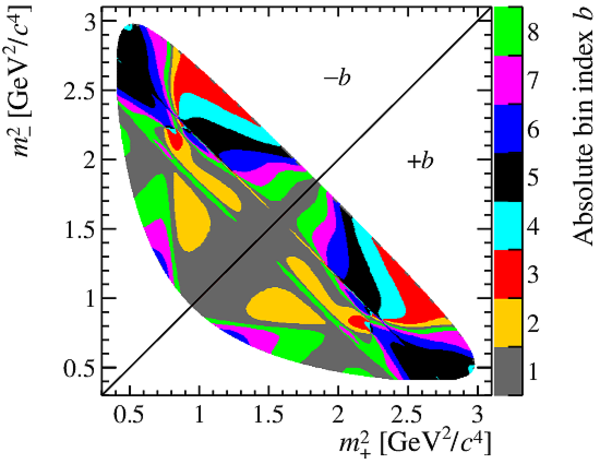
(Left) $ D ^0$ Dalitz plot of reconstructed $\overline{ B } \rightarrow D ^0 (\rightarrow K ^0_{\mathrm{S}} \pi ^+ \pi ^- )\mu ^- \bar{\nu}_\mu X$ decays for the $ D ^0$ flavor and (right) definition of the binning scheme proposed by CLEO [25]. |
Fig1Left.pdf [832 KiB] HiDef png [1 MiB] Thumbnail [566 KiB] *.C file |
|
|
Fig1Right.pdf [409 KiB] HiDef png [392 KiB] Thumbnail [273 KiB] *.C file |
|
|
|
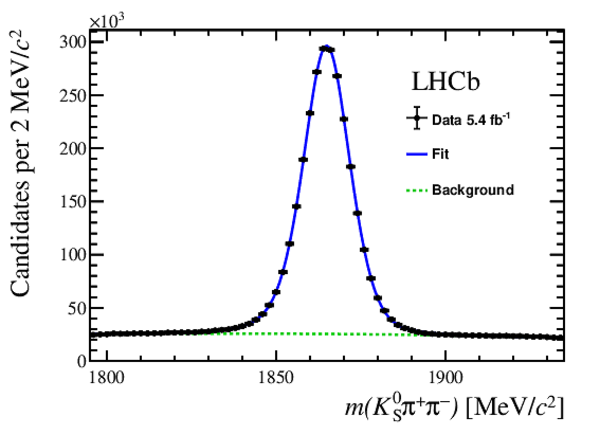
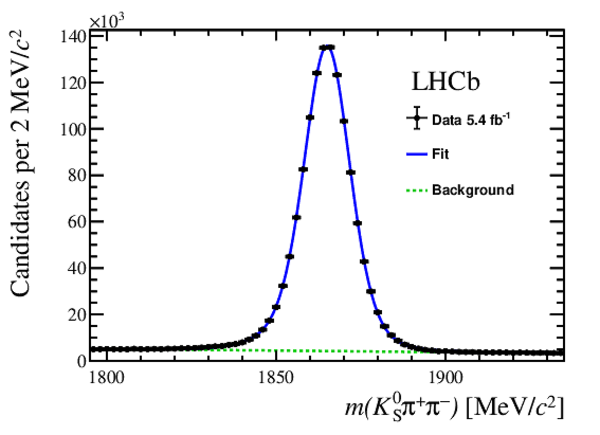
$ K ^0_{\mathrm{S}}$ $\pi ^+$ $\pi ^-$ invariant-mass distribution of (left) DD and (right) LL $ K ^0_{\mathrm{S}}$ candidates after all selection requirements, with fit results superimposed. |
Fig2Left.pdf [22 KiB] HiDef png [170 KiB] Thumbnail [143 KiB] *.C file |
|
|
Fig2Right.pdf [22 KiB] HiDef png [171 KiB] Thumbnail [144 KiB] *.C file |
|
|
|
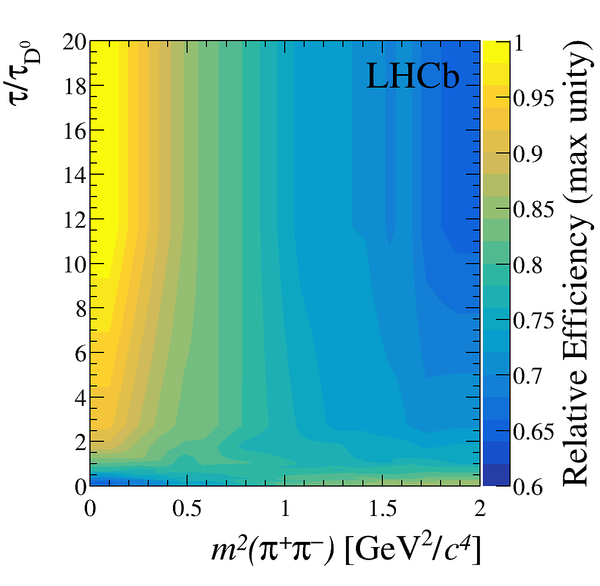
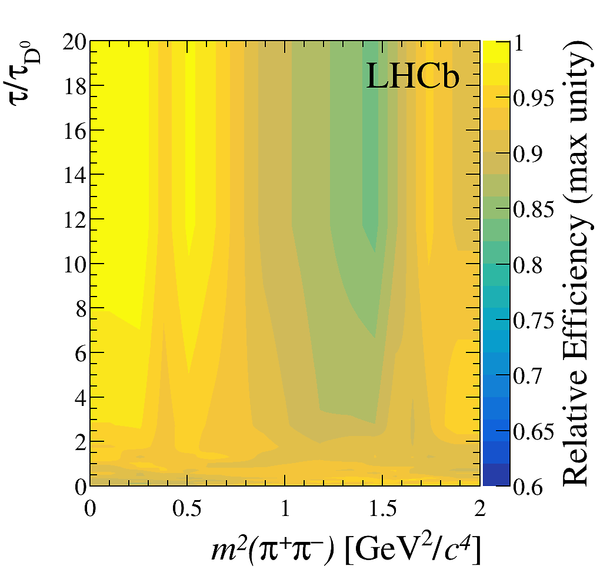
Relative efficiency as a function of $ D ^0$ decay-time and $ m^2(\pi ^+ \pi ^- )$ as determined from $\overline{ B } \rightarrow D ^0 (\rightarrow K ^0_{\mathrm{S}} \pi ^+ \pi ^- )\mu ^- \bar{\nu}_\mu X$ candidates, separately for (left) DD and (right) LL $ K ^0_{\mathrm{S}} $ candidates. The distributions are smoothed using bilinear interpolation. |
Fig3Left.png [38 KiB] HiDef png [151 KiB] Thumbnail [92 KiB] *.C file |
|
|
Fig3Right.png [37 KiB] HiDef png [149 KiB] Thumbnail [92 KiB] *.C file |
|
|
|
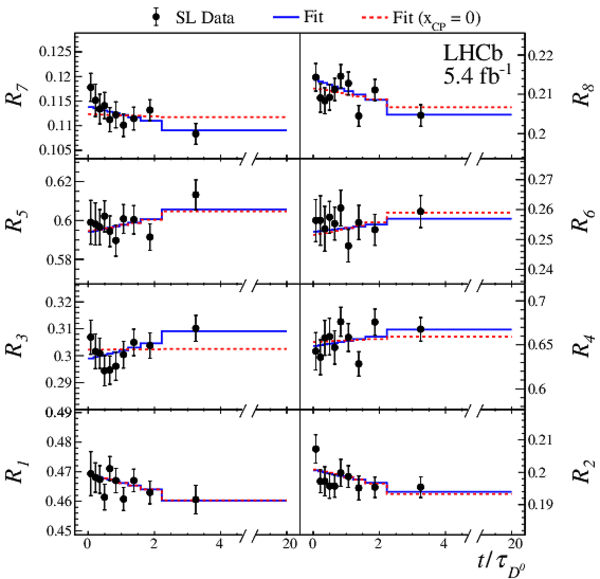
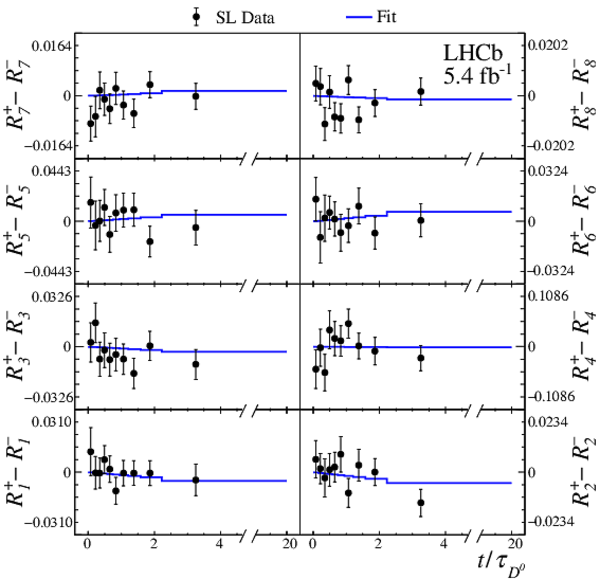
(Top) $ C P$ -averaged yield ratios and (bottom) difference of $ D ^0$ and $\overline{ D } {}^0$ yield ratios as a function of $ D ^0$ decay-time for the different Dalitz bins. The solid blue line shows the nominal fit projections and the dashed red line shows the fit projections when $ x_{ C P }$ is fixed to zero. |
Fig4Top.pdf [86 KiB] HiDef png [287 KiB] Thumbnail [269 KiB] *.C file |
|
|
Fig4Bottom.pdf [31 KiB] HiDef png [255 KiB] Thumbnail [251 KiB] *.C file |
|
|
|
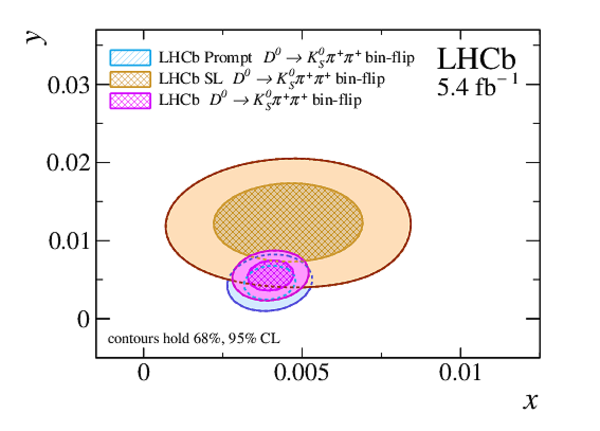
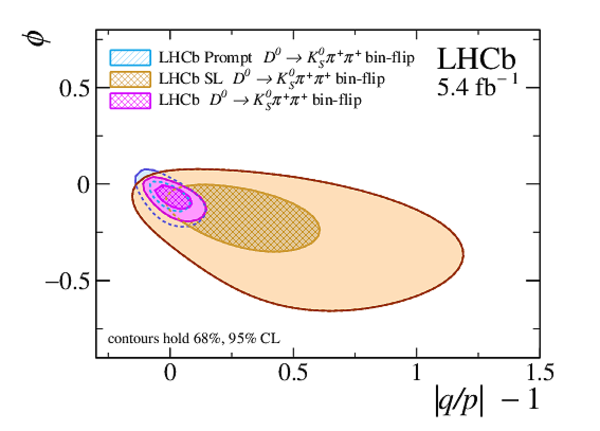
Two-dimensional 68% and 95% confidence-level contours on (left) ($x$, $y$) and (right) ($|q/p| - 1$, $\phi$). Results from Run 2 ${ D ^{*+} \rightarrow D ^0 (\rightarrow K ^0_{\mathrm{S}} \pi ^+ \pi ^- )\pi ^+ }$ (Prompt) [9], ${\overline{ B } \rightarrow D ^0 (\rightarrow K ^0_{\mathrm{S}} \pi ^+ \pi ^- )\mu ^- \bar{\nu}_\mu X }$ (SL), and their combination are shown. |
Fig5Left.pdf [15 KiB] HiDef png [402 KiB] Thumbnail [220 KiB] *.C file |
|
|
Fig5Right.pdf [15 KiB] HiDef png [358 KiB] Thumbnail [200 KiB] *.C file |
|
|
|
Animated gif made out of all figures. |
PAPER-2022-020.gif Thumbnail |

|
![HiDef png [1 MiB]](Directory_LHCb-PAPER-2022-020/hidef_Fig1Left.png)
![HiDef png [392 KiB]](Directory_LHCb-PAPER-2022-020/hidef_Fig1Right.png)
![HiDef png [170 KiB]](Directory_LHCb-PAPER-2022-020/hidef_Fig2Left.png)
![HiDef png [171 KiB]](Directory_LHCb-PAPER-2022-020/hidef_Fig2Right.png)
![Fig3Left.png [38 KiB]](Directory_LHCb-PAPER-2022-020/Fig3Left.png)
![HiDef png [151 KiB]](Directory_LHCb-PAPER-2022-020/hidef_Fig3Left.png)
![Fig3Right.png [37 KiB]](Directory_LHCb-PAPER-2022-020/Fig3Right.png)
![HiDef png [149 KiB]](Directory_LHCb-PAPER-2022-020/hidef_Fig3Right.png)
![HiDef png [287 KiB]](Directory_LHCb-PAPER-2022-020/hidef_Fig4Top.png)
![HiDef png [255 KiB]](Directory_LHCb-PAPER-2022-020/hidef_Fig4Bottom.png)
![HiDef png [402 KiB]](Directory_LHCb-PAPER-2022-020/hidef_Fig5Left.png)
![HiDef png [358 KiB]](Directory_LHCb-PAPER-2022-020/hidef_Fig5Right.png)
Tables and captions
|
Summary of the uncertainties on the measured quantities. The total systematic uncertainty is the sum in quadrature of the individual components. The uncertainties due to the strong-phase inputs are (by default) included in the statistical uncertainty. Here, to ease comparison with other sources, we also report the separate contributions due to the strong phase inputs and to the statistics of the data sample. |
Table_1.pdf [64 KiB] HiDef png [69 KiB] Thumbnail [29 KiB] tex code |

|
|
Fit results of $ x_{ C P }$ , $ y_{ C P }$ , $\Delta x$ , and $\Delta y$ in $\overline{ B } \rightarrow D ^0 (\rightarrow K ^0_{\mathrm{S}} \pi ^+ \pi ^- )\mu ^- \bar{\nu}_\mu X$ sample. The first contribution to the uncertainty is statistical, the second systematic. Statistical and systematic correlations between $ x_{ C P }$ , $ y_{ C P }$ , $\Delta x$ , and $\Delta y$ are provided. |
Table_2.pdf [68 KiB] HiDef png [42 KiB] Thumbnail [19 KiB] tex code |

|
|
Fit results of $ x_{ C P }$ , $ y_{ C P }$ , $\Delta x$ , and $\Delta y$ in the combination. The first contribution to the uncertainty is statistical, the second systematic. Statistical and systematic correlations between $ x_{ C P }$ , $ y_{ C P }$ , $\Delta x$ , and $\Delta y$ are provided. |
Table_3.pdf [68 KiB] HiDef png [43 KiB] Thumbnail [19 KiB] tex code |

|
|
Correlation between $ x_{ C P }$ , $ y_{ C P }$ , $\Delta x$ , and $\Delta y$ for each sytematic uncertainty in the ${\overline{ B } \rightarrow D ^0 (\rightarrow K ^0_{\mathrm{S}} \pi ^+ \pi ^- )\mu ^- \bar{\nu}_\mu X }$ sample. |
Table_4.pdf [62 KiB] HiDef png [77 KiB] Thumbnail [34 KiB] tex code |

|
|
Correlation between $ x_{ C P }$ , $ y_{ C P }$ , $\Delta x$ , and $\Delta y$ for each systematic uncertainty in the combination. |
Table_5.pdf [63 KiB] HiDef png [93 KiB] Thumbnail [42 KiB] tex code |

|
|
The statistical uncertainty on $ x_{ C P }$ , $ y_{ C P }$ , $\Delta x$ and $\Delta y$ , and the component of the statistical uncertainty due to the limited precision of the external measurements of the strong phases for the semileptonic sample. |
Table_7.pdf [61 KiB] HiDef png [25 KiB] Thumbnail [10 KiB] tex code |

|
|
The component of the statistical uncertainty due to the limited precision of the external measurements of the strong phases for the combined measurement of the prompt and semileptonic samples. |
Table_7.pdf [61 KiB] HiDef png [25 KiB] Thumbnail [10 KiB] tex code |
|
![HiDef png [69 KiB]](Directory_LHCb-PAPER-2022-020/hidef_Table_1.png)
![HiDef png [42 KiB]](Directory_LHCb-PAPER-2022-020/hidef_Table_2.png)
![HiDef png [43 KiB]](Directory_LHCb-PAPER-2022-020/hidef_Table_3.png)
![HiDef png [77 KiB]](Directory_LHCb-PAPER-2022-020/hidef_Table_4.png)
![HiDef png [93 KiB]](Directory_LHCb-PAPER-2022-020/hidef_Table_5.png)
![HiDef png [25 KiB]](Directory_LHCb-PAPER-2022-020/hidef_Table_7.png)
Created on 20 April 2024.