Search for the lepton-flavour violating decays $B^0 \to K^{*0} \tau^\pm \mu^\mp$
[to restricted-access page]Information
LHCb-PAPER-2022-021
CERN-EP-2022-154
arXiv:2209.09846 [PDF]
(Submitted on 20 Sep 2022)
JHEP 06 (2023) 143
Inspire 2154229
Tools
Abstract
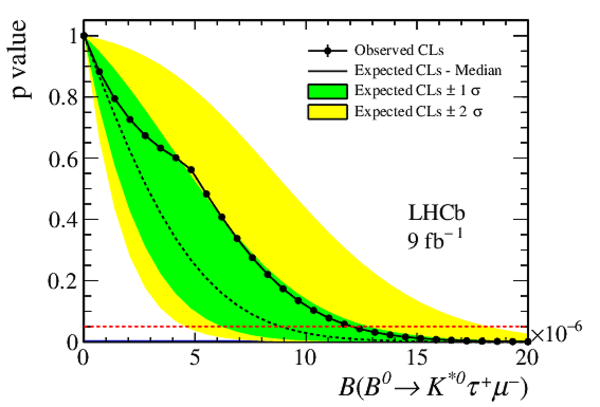
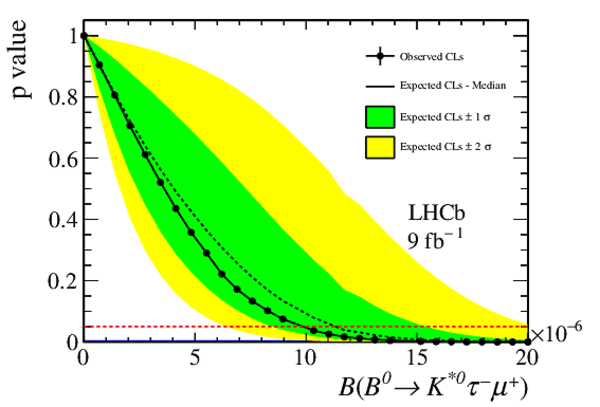
A first search for the lepton-flavour violating decays $B^0 \to K^{*0} \tau^\pm \mu^\mp$ is presented. The analysis is performed using a sample of proton-proton collision data, collected with the LHCb detector at centre-of-mass energies of 7, 8 and 13 TeV between 2011 and 2018, corresponding to an integrated luminosity of 9 fb$^{-1}$. No significant signal is observed, and upper limits on the branching fractions are determined to be ${\cal{B}}(B^0 \to K^{*0} \tau^+ \mu^-)< 1.0$ $(1.2)\times 10^{-5} $ and ${\cal{B}}(B^0 \to K^{*0} \tau^- \mu^+)< 8.2$ $(9.8) \times 10^{-6}$ at the 90 (95) confidence level.
Figures and captions
|
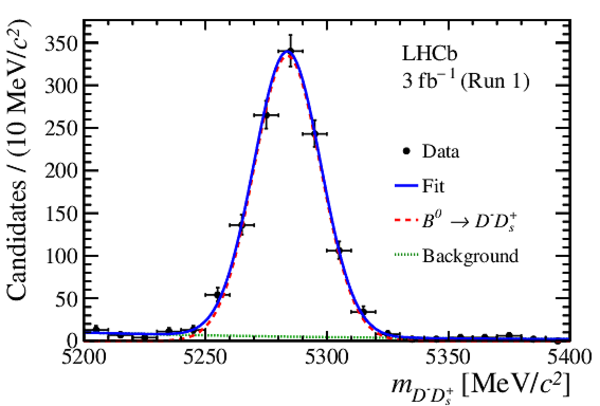
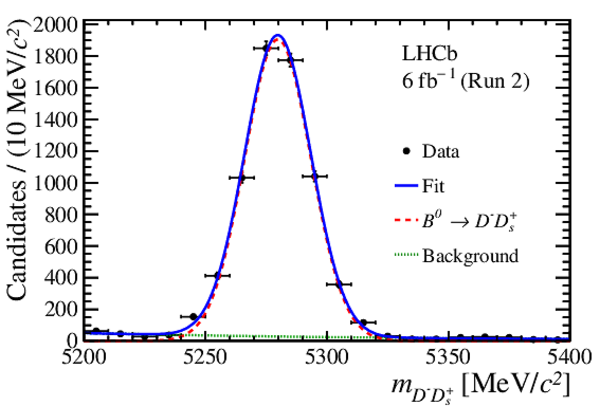
Mass distributions of selected $D^- D_s^+$ candidates in (left) Run 1 and (right) Run 2 data, with the fit overlaid (blue solid line). The red dashed line is signal, while the green dotted line is background. |
fit_DDs_01.pdf [17 KiB] HiDef png [220 KiB] Thumbnail [188 KiB] *.C file |
|
|
fit_DDs_02.pdf [17 KiB] HiDef png [236 KiB] Thumbnail [202 KiB] *.C file |
|
|
|
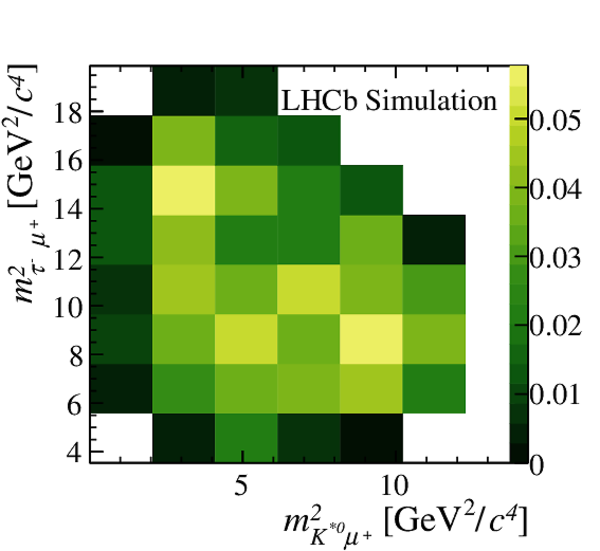
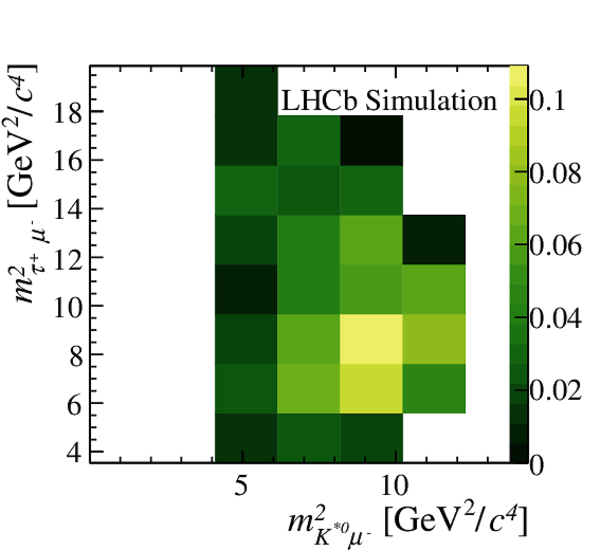
Efficiency as a function of $m^2_{K^{*0}\mu^{\pm}}$ and $m^2_{\tau^{\mp}\mu^{\pm}}$ for the (left) $ B ^0 \rightarrow K ^{*0} \tau^-\mu^+ $ and (right) $ B ^0 \rightarrow K ^{*0} \tau^+\mu^- $ cases, normalised to unity. The selection requirement $m(K^+\mu^-)>1885$ $\text{ Me V /}c^2$ for the $ B ^0 \rightarrow K ^{*0} \tau^+\mu^- $ decay implies zero efficiency for $m^2_{K^{*0}\mu^-}<4.1$ $\text{ Ge V} ^2 /c^4$ on the right plot. |
Dalitz[..].pdf [14 KiB] HiDef png [157 KiB] Thumbnail [140 KiB] *.C file |
|
|
Dalitz[..].pdf [14 KiB] HiDef png [149 KiB] Thumbnail [136 KiB] *.C file |
|
|
|
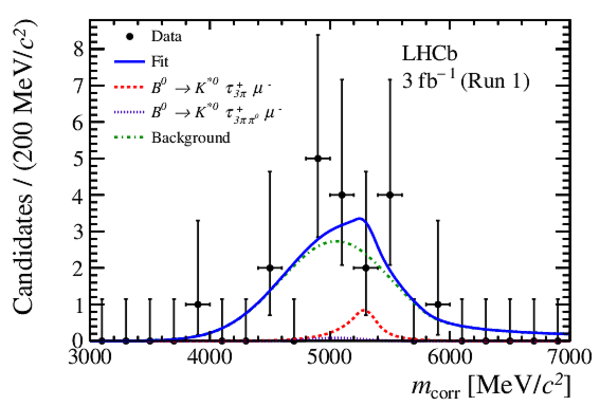
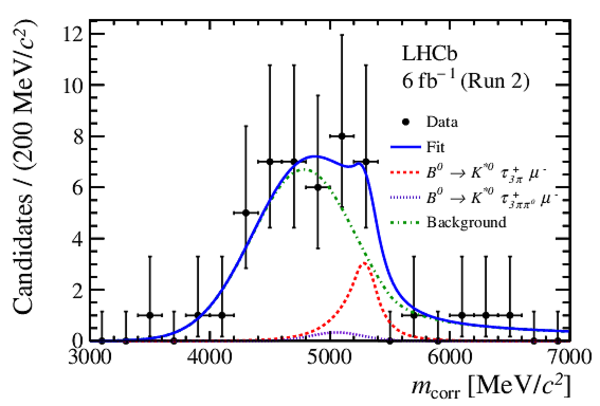
Distribution of the corrected mass $m_{\rm corr}$ of selected $ B ^0 \rightarrow K ^{*0} \tau^+\mu^- $ candidates in (left) Run 1 and (right) Run 2 data, with the simultaneous fit overlaid (blue solid line). The red dashed line is the dominant signal component with $\tau^+ \rightarrow \pi^+ \pi^- \pi^+ \bar{\nu_{\tau}}$; the violet dotted line is the subdominant signal component with $\tau^+ \rightarrow \pi^+ \pi^- \pi^+ \pi^0 \bar{\nu_{\tau}}$, extremely small and consequently barely visible; and the green dash-dotted line is the background. |
SimFit[..].pdf [17 KiB] HiDef png [222 KiB] Thumbnail [184 KiB] *.C file |
|
|
SimFit[..].pdf [17 KiB] HiDef png [240 KiB] Thumbnail [191 KiB] *.C file |
|
|
|
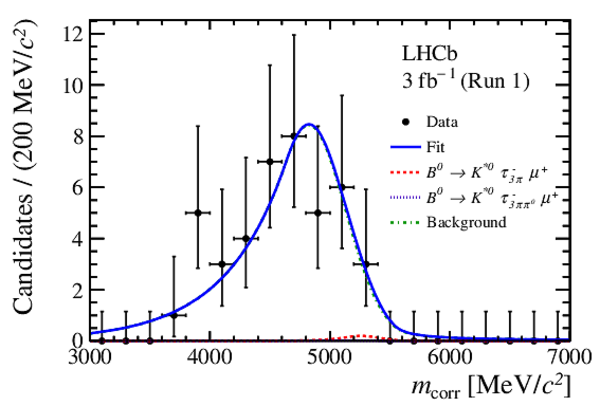
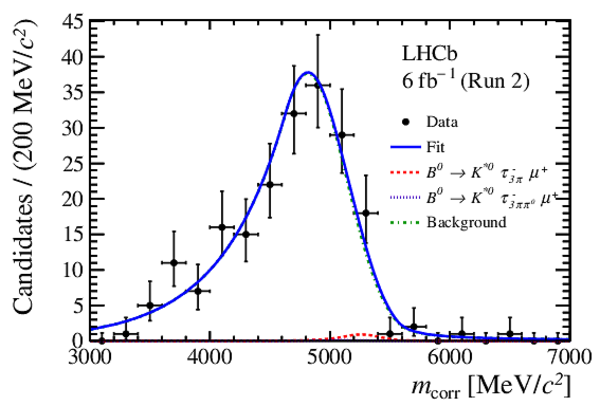
Distribution of the corrected mass $m_{\rm corr}$ of selected $ B ^0 \rightarrow K ^{*0} \tau^-\mu^+ $ candidates in (left) Run 1 and (right) Run 2 data, with the simultaneous fit overlaid (blue solid line). The red dashed line is the dominant signal component with $\tau^- \rightarrow \pi^- \pi^+ \pi^- {\nu_{\tau}}$; the violet dotted line is the subdominant signal component with $\tau^- \rightarrow \pi^- \pi^+ \pi^- \pi^0 {\nu_{\tau}}$, extremely small and consequently barely visible; and the green dash-dotted line is the background. |
SimFit[..].pdf [17 KiB] HiDef png [218 KiB] Thumbnail [177 KiB] *.C file |
|
|
SimFit[..].pdf [17 KiB] HiDef png [239 KiB] Thumbnail [202 KiB] *.C file |
|
|
|
The expected and observed p-values derived with the $CL_s$ method as a function of the (left) $ B ^0 \rightarrow K ^{*0} \tau^+\mu^- $ and (right) $ B ^0 \rightarrow K ^{*0} \tau^-\mu^+ $ branching fraction. The red line corresponds to the 95% CL. |
Limit_[..].pdf [16 KiB] HiDef png [188 KiB] Thumbnail [149 KiB] *.C file |
|
|
Limit_[..].pdf [16 KiB] HiDef png [176 KiB] Thumbnail [140 KiB] *.C file |
|
|
|
Animated gif made out of all figures. |
PAPER-2022-021.gif Thumbnail |

|
![HiDef png [220 KiB]](Directory_LHCb-PAPER-2022-021/hidef_fit_DDs_01.png)
![HiDef png [236 KiB]](Directory_LHCb-PAPER-2022-021/hidef_fit_DDs_02.png)
![HiDef png [157 KiB]](Directory_LHCb-PAPER-2022-021/hidef_DalitzAll_toBmass_PIDweights_Norm1_oc.png)
![HiDef png [149 KiB]](Directory_LHCb-PAPER-2022-021/hidef_DalitzAll_toBmass_PIDweights_Norm1_sc.png)
![HiDef png [222 KiB]](Directory_LHCb-PAPER-2022-021/hidef_SimFit_sc_DSCB_01.png)
![HiDef png [240 KiB]](Directory_LHCb-PAPER-2022-021/hidef_SimFit_sc_DSCB_02.png)
![HiDef png [218 KiB]](Directory_LHCb-PAPER-2022-021/hidef_SimFit_oc_DSCB_01.png)
![HiDef png [239 KiB]](Directory_LHCb-PAPER-2022-021/hidef_SimFit_oc_DSCB_02.png)
![HiDef png [188 KiB]](Directory_LHCb-PAPER-2022-021/hidef_Limit_sc_DSCB_YYYYY.png)
![HiDef png [176 KiB]](Directory_LHCb-PAPER-2022-021/hidef_Limit_oc_DSCB_YYYYY.png)
Tables and captions
|
Relative increase (in %) of the observed upper limit when applying each of the systematic uncertainties. |
Table_1.pdf [74 KiB] HiDef png [46 KiB] Thumbnail [20 KiB] tex code |

|
![HiDef png [46 KiB]](Directory_LHCb-PAPER-2022-021/hidef_Table_1.png)
Created on 13 April 2024.