Measurement of the time-integrated $C P$ asymmetry in $D^0\to K^- K^+$ decays
[to restricted-access page]Information
LHCb-PAPER-2022-024
CERN-EP-2022-163
arXiv:2209.03179 [PDF]
(Submitted on 07 Sep 2022)
Phys. Rev. Lett. 131 (2023) 091802
Inspire 2692262
Tools
Abstract
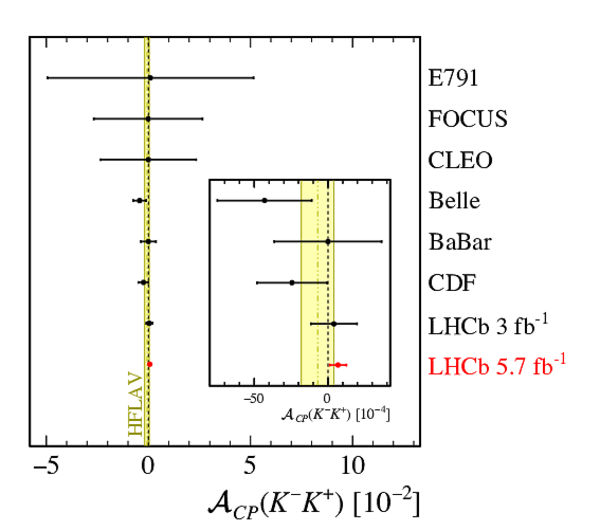
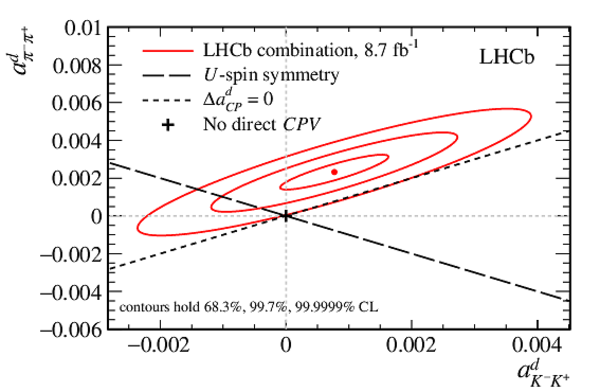
The time-integrated $C P$ asymmetry in the Cabibbo-suppressed decay $D^0\to K^-K^+$ is measured using proton-proton collision data, corresponding to an integrated luminosity of 5.7 fb$^{-1}$ collected at a center-of-mass energy of 13 TeV with the LHCb detector. The $D^0$ mesons are required to originate from promptly produced $D^{*+}\to D^0\pi^+$ decays and the charge of the companion pion is used to determine the flavor of the charm meson at production. The time-integrated $C P$ asymmetry is measured to be \begin{align*} \mathcal{A}_{C P}(K^-K^+) = \left[6.8 \pm 5.4 \text{ (stat)} \pm 1.6 \text{ (syst)} \right]\times 10^{-4}. \end{align*} The direct $C P$ asymmetries in $D^0\to K^- K^+$ and $D^0\to\pi^-\pi^+$ decays, $a_{K^-K^+}^{d}$ and $a_{\pi^-\pi^+}^{d}$, are derived by combining $\mathcal{A}_{C P} (K^-K^+)$ with the time-integrated $C P$ asymmetry difference, $\Delta \mathcal{A}_{C P} =\mathcal{A}_{C P} (K^-K^+)-\mathcal{A}_{C P} (\pi^-\pi^+)$, giving \begin{alignat*}{2} a_{K^-K^+}^{d} &= (\phantom{2}7.7 \pm 5.7) \times 10^{-4}, \end{alignat*} \begin{alignat*}{2} a_{\pi^-\pi^+}^{d} &= (23.2 \pm 6.1) \times 10^{-4}, \end{alignat*} with a correlation coefficient corresponding to $\rho=0.88$. The compatibility of these results with $C P$ symmetry is 1.4 and 3.8 standard deviations for $D^0\to K^- K^+$ and $D^0\to\pi^-\pi^+$ decays, respectively. This is the first evidence for direct $C P$ violation in a specific $D^0$ decay.
Figures and captions
|
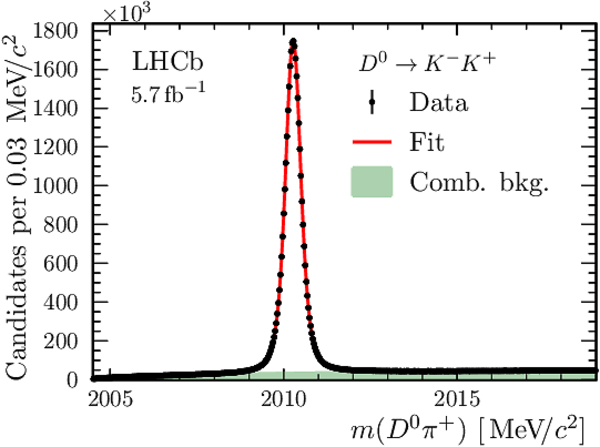
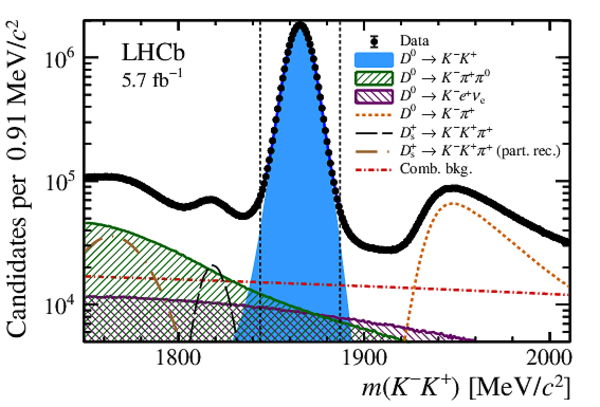
Distribution of the invariant mass for the weighted $ D ^{*+} \rightarrow D ^0 (\rightarrow K ^- K ^+ )\pi ^+ $ decay candidates, from the C$_ D ^+ $ calibration procedure. The result of the fit to this distribution is also shown. |
Fig1.pdf [159 KiB] HiDef png [212 KiB] Thumbnail [191 KiB] *.C file |
|
|
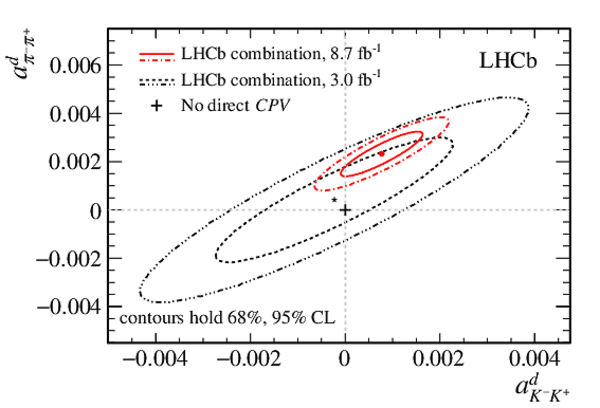
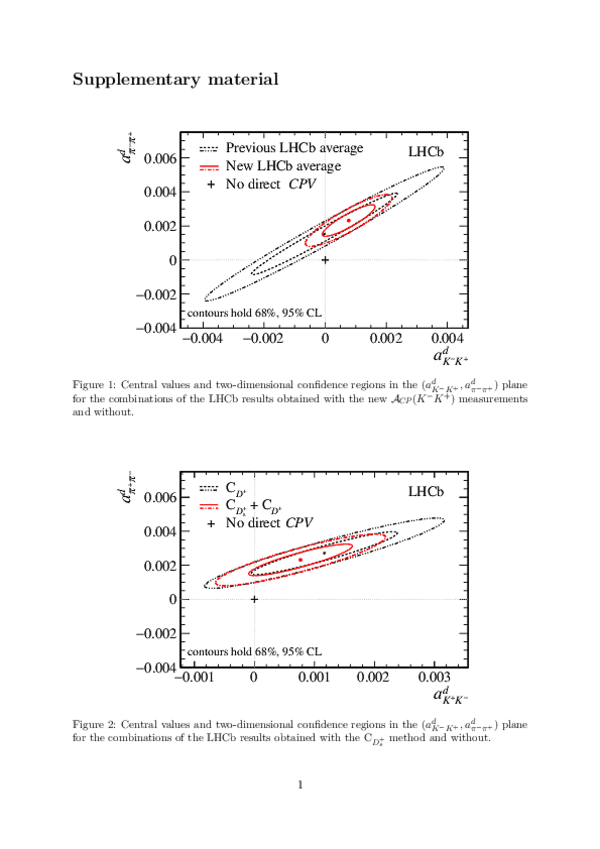
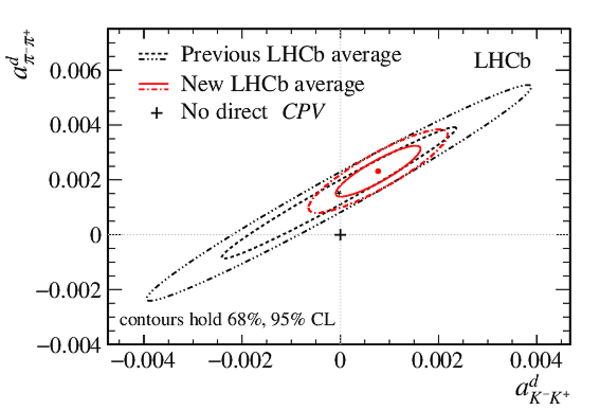
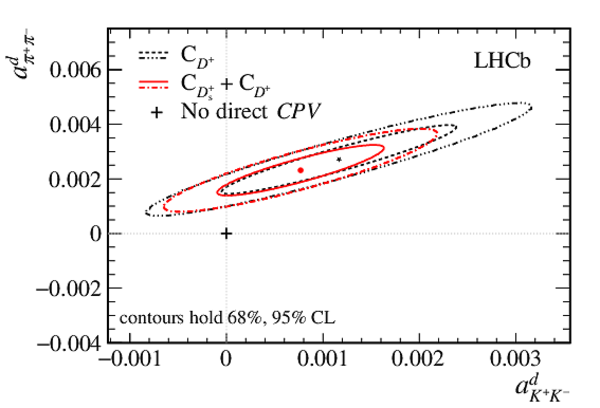
Central values and two-dimensional confidence regions in the $(a_{ K ^- K ^+ }^{d},a_{\pi ^- \pi ^+ }^{d})$ plane for the combinations of the LHCb results obtained with the dataset taken between 2010 and 2018 and the one taken between 2010 and 2012, corresponding to an integrated luminosity of 8.7 $\text{ fb} ^{-1}$ and 3.0 $\text{ fb} ^{-1}$ , respectively. |
Fig2.pdf [15 KiB] HiDef png [206 KiB] Thumbnail [201 KiB] *.C file |
|
|
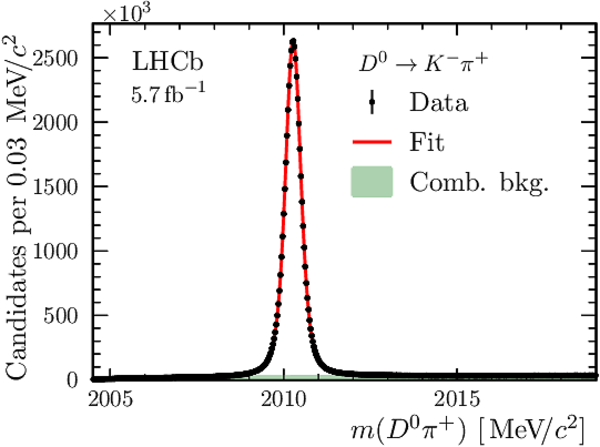
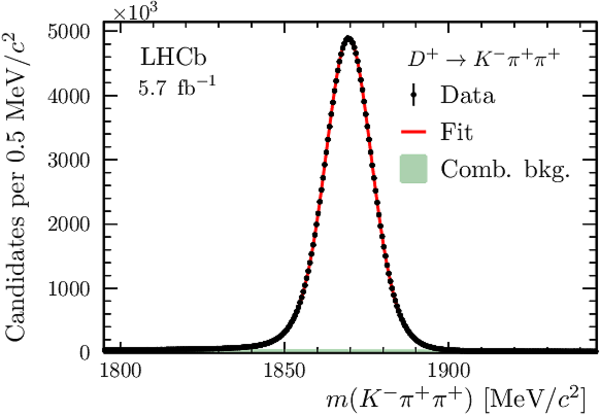
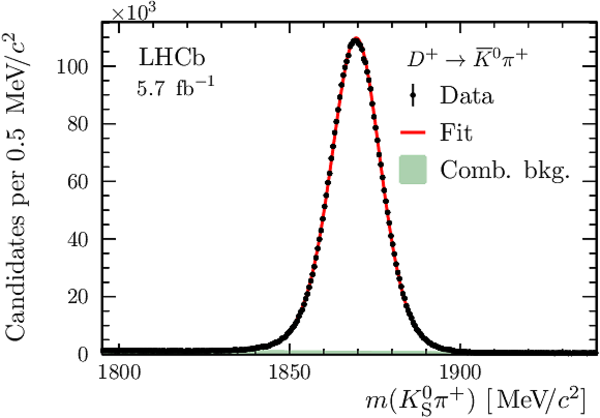
Distributions of the invariant mass for the weighted charm-meson candidates, for the decays (top left) $ D ^{*+}$ $\rightarrow$ $ D ^0$ ( $\rightarrow$ $ K ^-$ $ K ^+$ ) $\pi ^+$ , (top right) $ D ^{*+}$ $\rightarrow$ $ D ^0$ ( $\rightarrow$ $ K ^-$ $\pi ^+$ ) $\pi ^+$ , (bottom left) $ D ^+$ $\rightarrow$ $ K ^-$ $\pi ^+$ $\pi ^+$ , (bottom right) $ D ^+$ $\rightarrow$ $\overline{ K } {}^0$ $\pi ^+$ . The data are from the $\mathrm{C}_ D ^+ $ calibration procedure. The results of the fits to these distributions are also shown. The top left is repeated from the main text. |
Fig1a-S.pdf [159 KiB] HiDef png [212 KiB] Thumbnail [191 KiB] *.C file |

|
|
Fig1b-S.pdf [163 KiB] HiDef png [189 KiB] Thumbnail [169 KiB] *.C file |
|
|
|
Fig1c-S.pdf [126 KiB] HiDef png [181 KiB] Thumbnail [155 KiB] *.C file |
|
|
|
Fig1d-S.pdf [125 KiB] HiDef png [174 KiB] Thumbnail [144 KiB] *.C file |
|
|
|
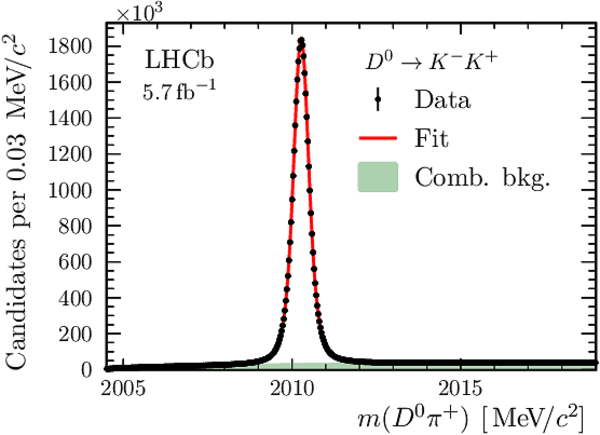
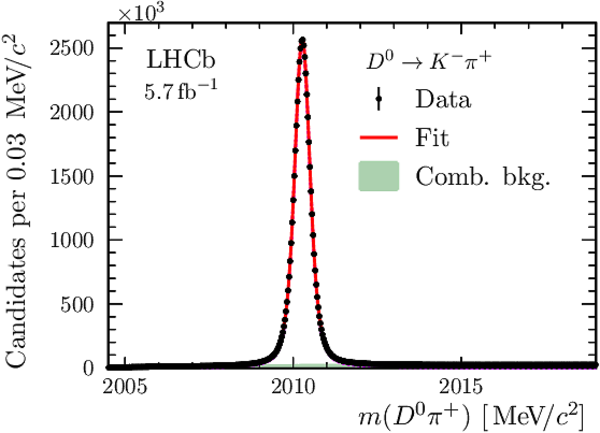
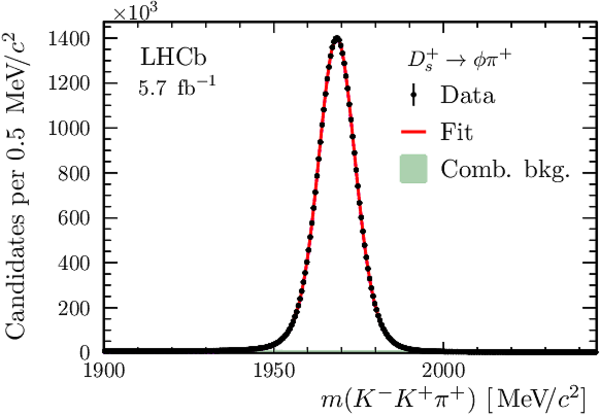
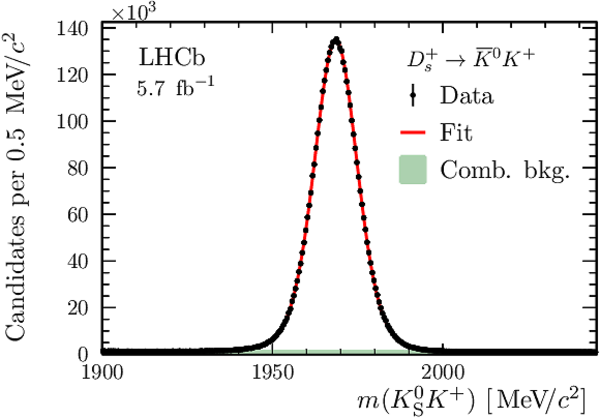
Distributions of the invariant mass for the weighted charm-meson candidates, for the decays (top left) $ D ^{*+}$ $\rightarrow$ $ D ^0$ ( $\rightarrow$ $ K ^-$ $ K ^+$ ) $\pi ^+$ , (top right) $ D ^{*+}$ $\rightarrow$ $ D ^0$ ( $\rightarrow$ $ K ^-$ $\pi ^+$ ) $\pi ^+$ , (bottom left) $ D ^+_ s $ $\rightarrow$ $ K ^-$ $ K ^+$ $\pi ^+$ , and (bottom right) $ D ^+_ s $ $\rightarrow$ $\overline{ K } {}^0$ $ K ^+$ . The data are from the $\mathrm{C}_ D ^+_ s $ calibration procedure. The results of the fits to these distributions are also shown. |
Fig2a-S.pdf [159 KiB] HiDef png [206 KiB] Thumbnail [178 KiB] *.C file |
|
|
Fig2b-S.pdf [177 KiB] HiDef png [193 KiB] Thumbnail [162 KiB] *.C file |
|
|
|
Fig2c-S.pdf [154 KiB] HiDef png [189 KiB] Thumbnail [157 KiB] *.C file |
|
|
|
Fig2d-S.pdf [131 KiB] HiDef png [179 KiB] Thumbnail [150 KiB] *.C file |
|
|
|
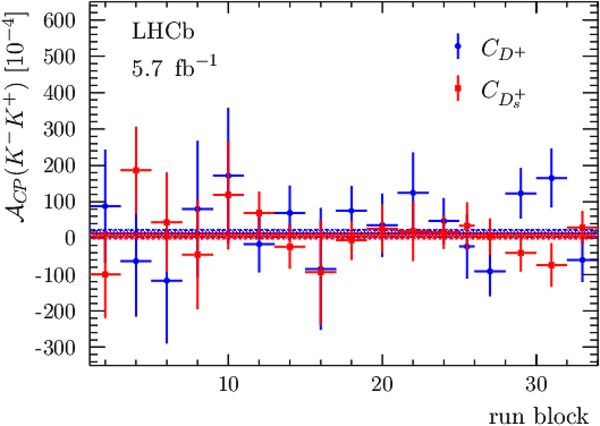
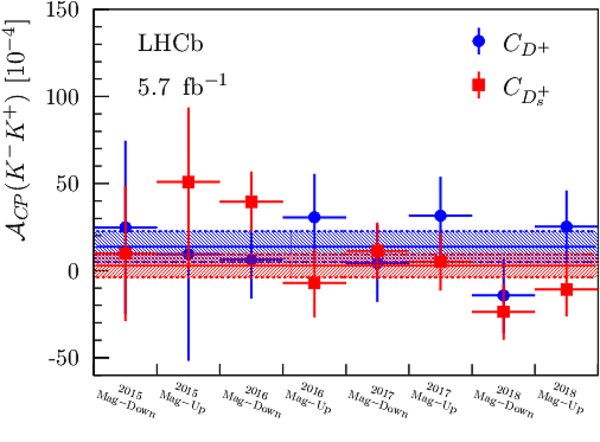
Measurements of $ {\mathcal{A}}^{ C P } ( K ^- K ^+ ) $ in (left) time-ordered data-taking (referred to as run blocks) and (right) year of data-taking and dipole-magnet polarity for the $\mathrm{C}_ D ^+ $ and $\mathrm{C}_ D ^+_ s $ calibration procedures. The uncertainties are statistical only. The horizontal lines are the averaged values for the $\mathrm{C}_ D ^+ $ and $\mathrm{C}_ D ^+_ s $ methods, while the bands represent the one-standard-deviation regions. The labels Mag-Up and Mag-Down refer to the direction of the magnetic field along the positive and negative directions of $y$-axis, respectively. |
Fig3a-S.pdf [81 KiB] HiDef png [228 KiB] Thumbnail [181 KiB] *.C file |
|
|
Fig3b-S.pdf [72 KiB] HiDef png [482 KiB] Thumbnail [255 KiB] *.C file |
|
|
|
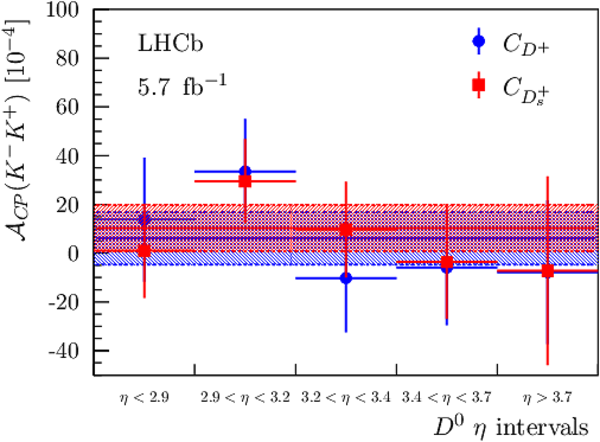
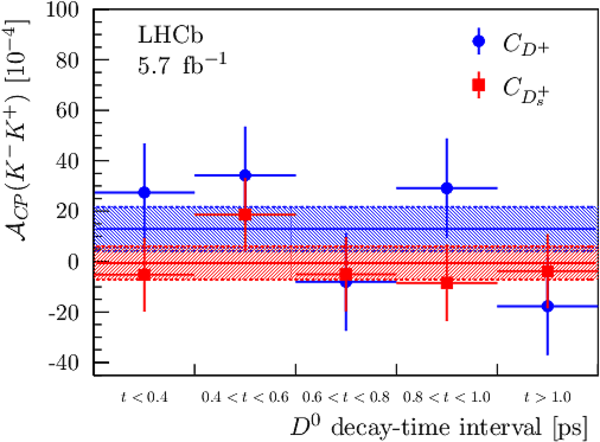
Comparison of the results for $ {\mathcal{A}}^{ C P } ( K ^- K ^+ ) $ per different intervals of $ D ^0$ candidates (left) pseudorapidity and (right) decay time for the $\mathrm{C}_ D ^+ $ and $\mathrm{C}_ D ^+_ s $ calibration procedures. The horizontal lines are the averaged values for the $\mathrm{C}_ D ^+ $ and $\mathrm{C}_ D ^+_ s $ methods, while the bands represent the one-standard-deviation regions. |
Fig4a-S.pdf [72 KiB] HiDef png [680 KiB] Thumbnail [302 KiB] *.C file |
|
|
Fig4b-S.pdf [73 KiB] HiDef png [645 KiB] Thumbnail [321 KiB] *.C file |
|
|
|
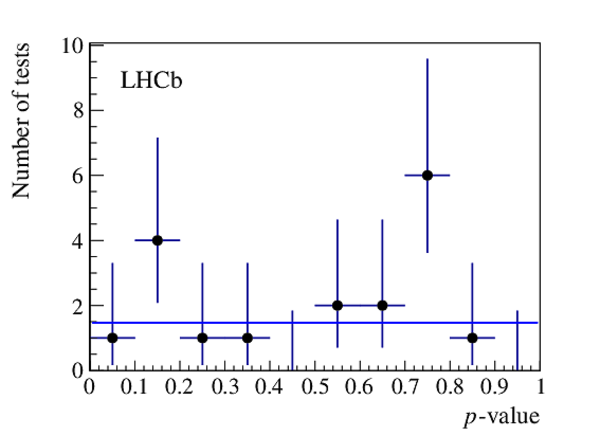
Distribution of the $p$-values resulting from the consistency checks on $ {\mathcal{A}}^{ C P } ( K ^- K ^+ )$ measured in different data subsamples. The blue line represents the expected uniform distribution. |
Fig5-S.pdf [14 KiB] HiDef png [96 KiB] Thumbnail [87 KiB] *.C file |
|
|
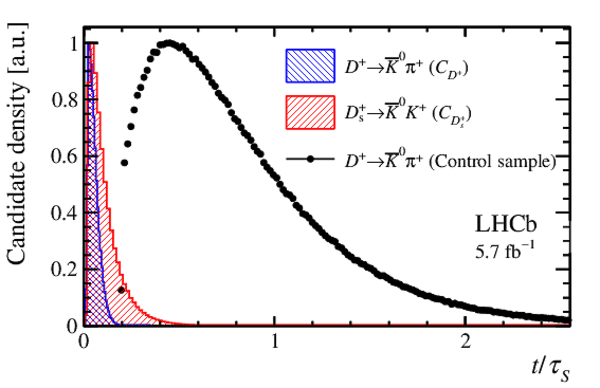
Distributions of the neutral-kaon decay time for background-subtracted and weighted candidates considered in the determination of $ {\mathcal{A}}^{ C P } ( K ^- K ^+ ) $ values. The distributions are normalized to have the maximum equal to unity. The control sample is used to estimate $A(\overline{ K } {}^0 )$ and consists of neutral kaons decaying outside of the vertex detector. |
Fig6-S.pdf [20 KiB] HiDef png [219 KiB] Thumbnail [178 KiB] *.C file |
|
|
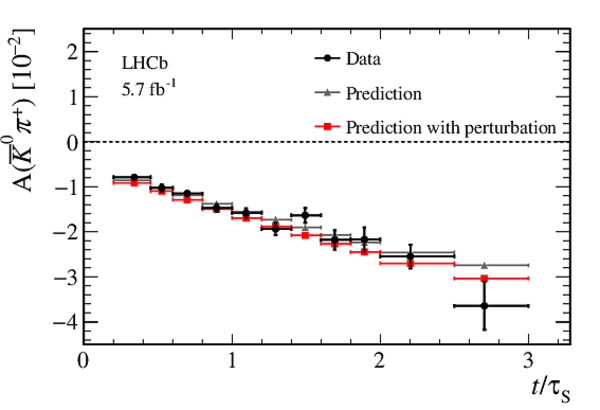
Measured asymmetry in $ D ^+$ $\rightarrow$ $\overline{ K } {}^0$ $\pi ^+$ decays as a function of $\overline{ K } {}^0$ decay time in units of $ K ^0_{\mathrm{S}}$ -meson decay time, in data where the neutral kaon meson decays outside of the vertex detector. The predictions for the neutral kaon asymmetry, from the model with and without an additional linear degree of freedom, are shown as well. An overall shift is applied to the model's predictions to account for unrelated nuisance asymmetries, i.e. $ A_{\rm P} ( D ^+ )$ and $ A_{\rm D} (\pi ^+ )$. |
Fig7-S.pdf [16 KiB] HiDef png [116 KiB] Thumbnail [125 KiB] *.C file |
|
|
Distribution of the $ K ^- K ^+ $ invariant mass, along with the result of the fit describing the expected background components. The vertical lines indicate the interval applied in the selection of $ D ^0$ candidates for the determination of $ {\mathcal{A}}^{ C P } ( K ^- K ^+ ) $. The fit results are used to evaluate the systematic uncertainties related to the peaking background. |
Fig8-S.pdf [68 KiB] HiDef png [583 KiB] Thumbnail [345 KiB] *.C file |
|
|
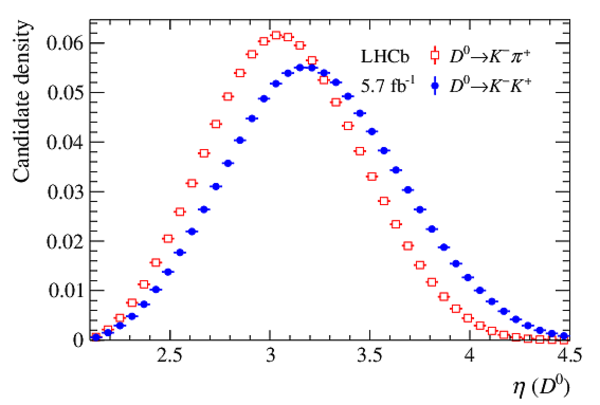
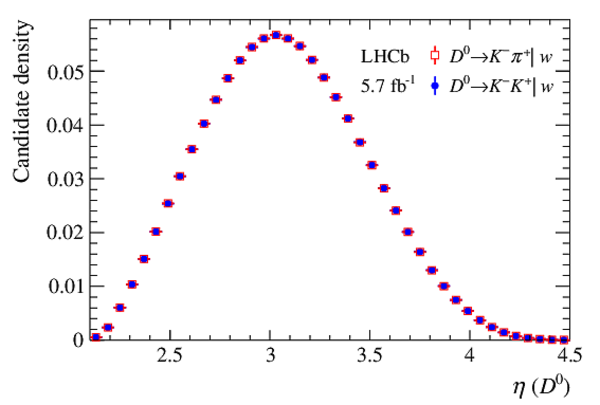
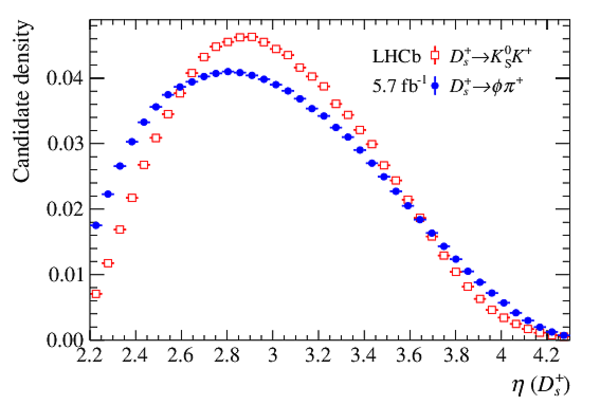
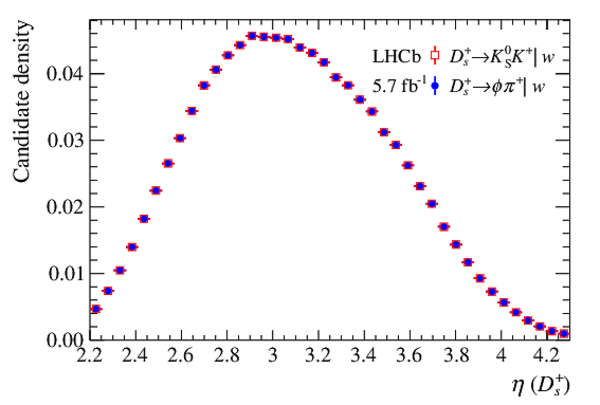
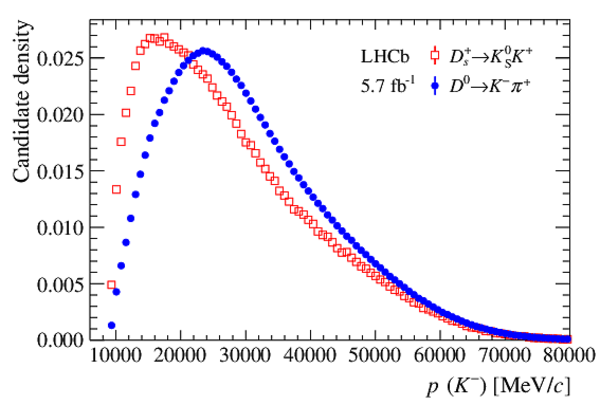
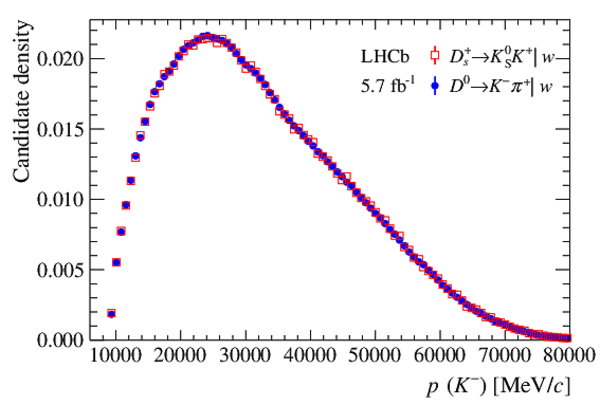
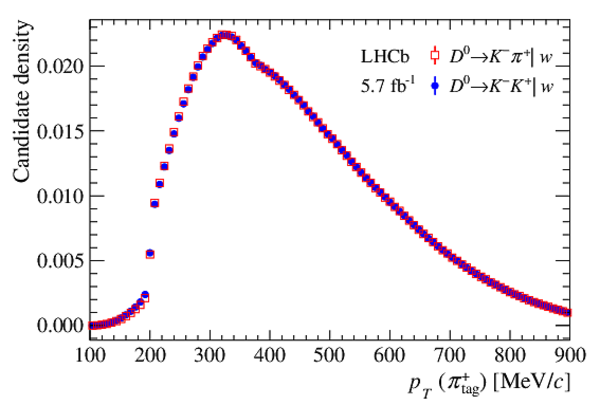
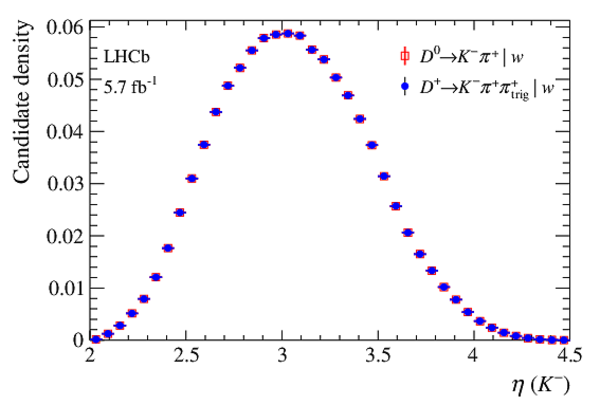
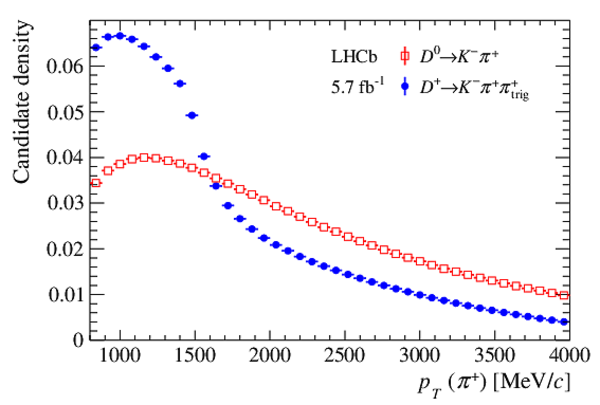
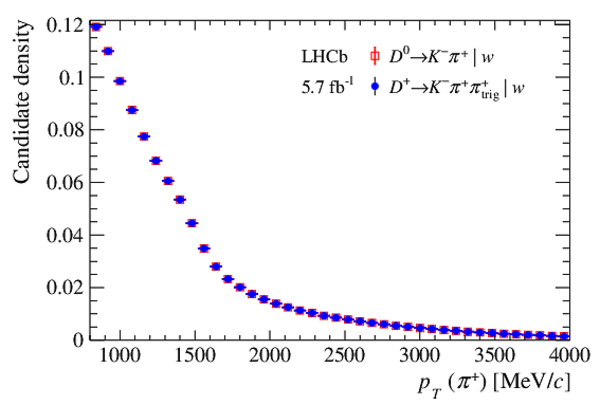
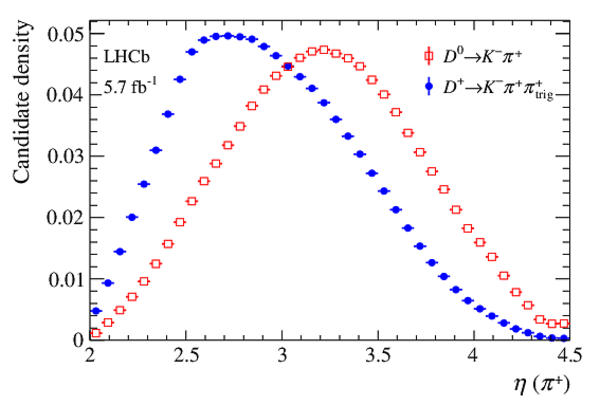
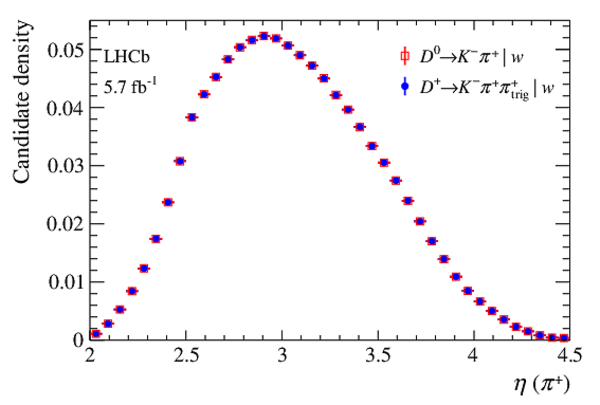
Background-subtracted kinematic distributions for the charm-meson pseudorapidity ($\eta$), the kaon momentum ($p$) and the tagging-pion transverse momentum ( $ p_{\mathrm{T}}$ ) (left column) before and (right column) after the per-candidate $\mathrm{C}_ D ^+_ s $ weighting procedure. The distributions are normalized to unit area. |
Fig9a-S.pdf [17 KiB] HiDef png [163 KiB] Thumbnail [130 KiB] *.C file |
|
|
Fig9b-S.pdf [16 KiB] HiDef png [145 KiB] Thumbnail [116 KiB] *.C file |
|
|
|
Fig9c-S.pdf [17 KiB] HiDef png [171 KiB] Thumbnail [148 KiB] *.C file |
|
|
|
Fig9d-S.pdf [16 KiB] HiDef png [160 KiB] Thumbnail [140 KiB] *.C file |
|
|
|
Fig9e-S.pdf [18 KiB] HiDef png [228 KiB] Thumbnail [184 KiB] *.C file |
|
|
|
Fig9f-S.pdf [17 KiB] HiDef png [230 KiB] Thumbnail [173 KiB] *.C file |
|
|
|
Fig9g-S.pdf [18 KiB] HiDef png [236 KiB] Thumbnail [188 KiB] *.C file |
|
|
|
Fig9h-S.pdf [18 KiB] HiDef png [223 KiB] Thumbnail [171 KiB] *.C file |
|
|
|
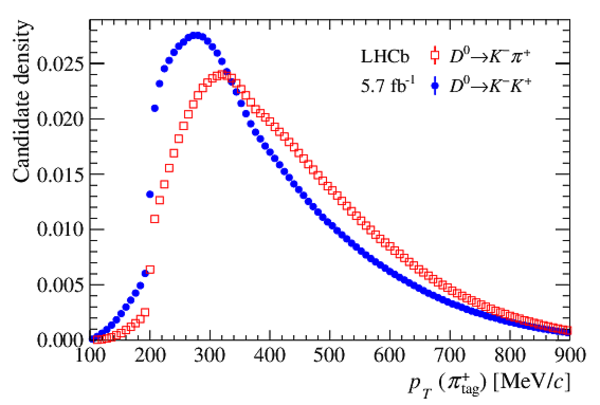
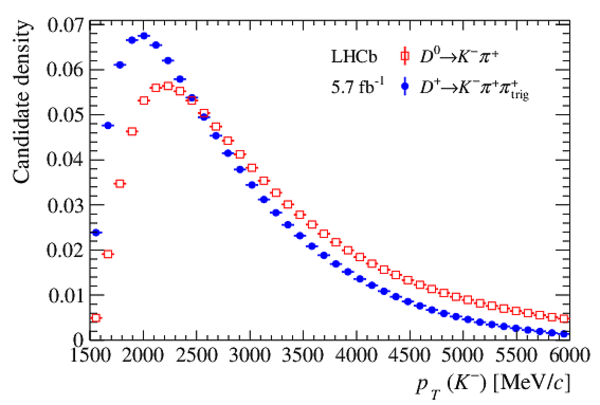
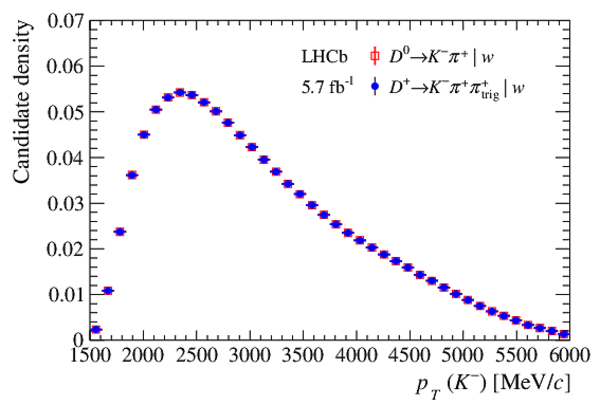
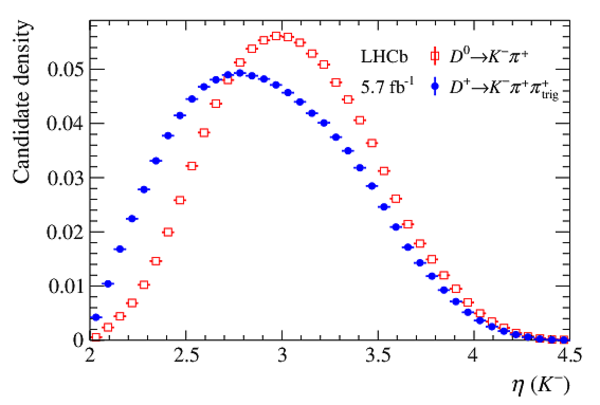
Background-subtracted kinematic distributions for the kaon and pion transverse momentum ($ p_{\mathrm{T}} $) and pseudorapidity ($\eta$) (left column) before and (right column) after the per-candidate $\mathrm{C}_ D ^+ $ weighting procedure. The distributions are normalized to unit area. |
Fig10a-S.pdf [17 KiB] HiDef png [210 KiB] Thumbnail [184 KiB] *.C file |
|
|
Fig10b-S.pdf [17 KiB] HiDef png [204 KiB] Thumbnail [175 KiB] *.C file |
|
|
|
Fig10c-S.pdf [17 KiB] HiDef png [158 KiB] Thumbnail [133 KiB] *.C file |
|
|
|
Fig10d-S.pdf [17 KiB] HiDef png [159 KiB] Thumbnail [129 KiB] *.C file |
|
|
|
Fig10e-S.pdf [17 KiB] HiDef png [193 KiB] Thumbnail [165 KiB] *.C file |
|
|
|
Fig10f-S.pdf [17 KiB] HiDef png [180 KiB] Thumbnail [147 KiB] *.C file |
|
|
|
Fig10g-S.pdf [16 KiB] HiDef png [160 KiB] Thumbnail [136 KiB] *.C file |
|
|
|
Fig10h-S.pdf [16 KiB] HiDef png [147 KiB] Thumbnail [126 KiB] *.C file |
|
|
|
Measurements of $ {\mathcal{A}}^{ C P } ( K ^- K ^+ )$ from various experiments [58,63,64,65,66,67,68]. The presented measurement is highlighted in red. The vertical band corresponds to the average of all measurements previous to the presented, computed by HFLAV [59], where it is assumed that $ C P$ is conserved in mixing and in the interference between decay and mixing. This assumption is necessary when results from different experiments are compared. The inset plot shows the five most precise measurements in a reduced horizontal range. |
Fig11-S.pdf [41 KiB] HiDef png [182 KiB] Thumbnail [137 KiB] *.C file |
|
|
Animated gif made out of all figures. |
PAPER-2022-024.gif Thumbnail |

|
Tables and captions
|
Signal yields and statistical reduction factors arising from the kinematic weighting of the sample for the various decay modes and both calibration procedures. |
Table_1.pdf [69 KiB] HiDef png [55 KiB] Thumbnail [27 KiB] tex code |

|
|
Systematic uncertainties on $ {\mathcal{A}}^{ C P } ( K ^- K ^+ )$ for the two calibration procedures C$_ D ^+ $ and C$_ D ^+_ s $. The total uncertainties are obtained as the sums in quadrature of the individual contributions. Correlations between the systematic uncertainties of the two calibration procedures are also reported. |
Table_2.pdf [55 KiB] HiDef png [64 KiB] Thumbnail [30 KiB] tex code |

|
Supplementary Material [file]
![HiDef png [212 KiB]](Directory_LHCb-PAPER-2022-024/hidef_Fig1.png)
![HiDef png [206 KiB]](Directory_LHCb-PAPER-2022-024/hidef_Fig2.png)
![HiDef png [212 KiB]](Directory_LHCb-PAPER-2022-024/hidef_Fig1a-S.png)
![HiDef png [189 KiB]](Directory_LHCb-PAPER-2022-024/hidef_Fig1b-S.png)
![HiDef png [181 KiB]](Directory_LHCb-PAPER-2022-024/hidef_Fig1c-S.png)
![HiDef png [174 KiB]](Directory_LHCb-PAPER-2022-024/hidef_Fig1d-S.png)
![HiDef png [206 KiB]](Directory_LHCb-PAPER-2022-024/hidef_Fig2a-S.png)
![HiDef png [193 KiB]](Directory_LHCb-PAPER-2022-024/hidef_Fig2b-S.png)
![HiDef png [189 KiB]](Directory_LHCb-PAPER-2022-024/hidef_Fig2c-S.png)
![HiDef png [179 KiB]](Directory_LHCb-PAPER-2022-024/hidef_Fig2d-S.png)
![HiDef png [228 KiB]](Directory_LHCb-PAPER-2022-024/hidef_Fig3a-S.png)
![HiDef png [482 KiB]](Directory_LHCb-PAPER-2022-024/hidef_Fig3b-S.png)
![HiDef png [680 KiB]](Directory_LHCb-PAPER-2022-024/hidef_Fig4a-S.png)
![HiDef png [645 KiB]](Directory_LHCb-PAPER-2022-024/hidef_Fig4b-S.png)
![HiDef png [96 KiB]](Directory_LHCb-PAPER-2022-024/hidef_Fig5-S.png)
![HiDef png [219 KiB]](Directory_LHCb-PAPER-2022-024/hidef_Fig6-S.png)
![HiDef png [116 KiB]](Directory_LHCb-PAPER-2022-024/hidef_Fig7-S.png)
![HiDef png [583 KiB]](Directory_LHCb-PAPER-2022-024/hidef_Fig8-S.png)
![HiDef png [163 KiB]](Directory_LHCb-PAPER-2022-024/hidef_Fig9a-S.png)
![HiDef png [145 KiB]](Directory_LHCb-PAPER-2022-024/hidef_Fig9b-S.png)
![HiDef png [171 KiB]](Directory_LHCb-PAPER-2022-024/hidef_Fig9c-S.png)
![HiDef png [160 KiB]](Directory_LHCb-PAPER-2022-024/hidef_Fig9d-S.png)
![HiDef png [228 KiB]](Directory_LHCb-PAPER-2022-024/hidef_Fig9e-S.png)
![HiDef png [230 KiB]](Directory_LHCb-PAPER-2022-024/hidef_Fig9f-S.png)
![HiDef png [236 KiB]](Directory_LHCb-PAPER-2022-024/hidef_Fig9g-S.png)
![HiDef png [223 KiB]](Directory_LHCb-PAPER-2022-024/hidef_Fig9h-S.png)
![HiDef png [210 KiB]](Directory_LHCb-PAPER-2022-024/hidef_Fig10a-S.png)
![HiDef png [204 KiB]](Directory_LHCb-PAPER-2022-024/hidef_Fig10b-S.png)
![HiDef png [158 KiB]](Directory_LHCb-PAPER-2022-024/hidef_Fig10c-S.png)
![HiDef png [159 KiB]](Directory_LHCb-PAPER-2022-024/hidef_Fig10d-S.png)
![HiDef png [193 KiB]](Directory_LHCb-PAPER-2022-024/hidef_Fig10e-S.png)
![HiDef png [180 KiB]](Directory_LHCb-PAPER-2022-024/hidef_Fig10f-S.png)
![HiDef png [160 KiB]](Directory_LHCb-PAPER-2022-024/hidef_Fig10g-S.png)
![HiDef png [147 KiB]](Directory_LHCb-PAPER-2022-024/hidef_Fig10h-S.png)
![HiDef png [182 KiB]](Directory_LHCb-PAPER-2022-024/hidef_Fig11-S.png)
![HiDef png [55 KiB]](Directory_LHCb-PAPER-2022-024/hidef_Table_1.png)
![HiDef png [64 KiB]](Directory_LHCb-PAPER-2022-024/hidef_Table_2.png)
![HiDef png [208 KiB]](Directory_LHCb-PAPER-2022-024/supplementary/hidef_Fig1-SY.png)
![HiDef png [200 KiB]](Directory_LHCb-PAPER-2022-024/supplementary/hidef_Fig2-SY.png)
![HiDef png [251 KiB]](Directory_LHCb-PAPER-2022-024/supplementary/hidef_Fig3-SY.png)
Created on 13 April 2024.