Study of the $B^{-} \to \Lambda_{c}^{+} \bar{\Lambda}_{c}^{-} K^{-}$ decay
[to restricted-access page]Information
LHCb-PAPER-2022-028
CERN-EP-2022-196
arXiv:2211.00812 [PDF]
(Submitted on 02 Nov 2022)
Phys. Rev. D 108 (2023) 012020
Inspire 2175466
Tools
Abstract
The decay $B^{-} \to \Lambda_{c}^{+} \bar{\Lambda}_{c}^{-} K^{-}$ is studied in proton-proton collisions at a center-of-mass energy of $\sqrt{s}=13$ TeV using data corresponding to an integrated luminosity of 5 $\mathrm{fb}^{-1}$ collected by the LHCb experiment. In the $\Lambda_{c}^+ K^{-}$ system, the $\Xi_{c}(2930)^{0}$ state observed at the BaBar and Belle experiments is resolved into two narrower states, $\Xi_{c}(2923)^{0}$ and $\Xi_{c}(2939)^{0}$, whose masses and widths are measured to be $$ m(\Xi_{c}(2923)^{0}) = 2924.5 \pm 0.4 \pm 1.1 \mathrm{MeV}, \\ m(\Xi_{c}(2939)^{0}) = 2938.5 \pm 0.9 \pm 2.3 \mathrm{MeV}, \\ \Gamma(\Xi_{c}(2923)^{0}) = \phantom{000}4.8 \pm 0.9 \pm 1.5 \mathrm{MeV},\\ \Gamma(\Xi_{c}(2939)^{0}) = \phantom{00}11.0 \pm 1.9 \pm 7.5 \mathrm{MeV}, $$ where the first uncertainties are statistical and the second systematic. The results are consistent with a previous LHCb measurement using a prompt $\Lambda_{c}^{+} K^{-}$ sample. Evidence of a new $\Xi_{c}(2880)^{0}$ state is found with a local significance of $3.8 \sigma$, whose mass and width are measured to be $2881.8 \pm 3.1 \pm 8.5 \mathrm{MeV}$ and $12.4 \pm 5.3 \pm 5.8 \mathrm{MeV}$, respectively. In addition, evidence of a new decay mode $\Xi_{c}(2790)^{0} \to \Lambda_{c}^{+} K^{-}$ is found with a significance of $3.7 \sigma$. The relative branching fraction of $B^{-} \to \Lambda_{c}^{+} \bar{\Lambda}_{c}^{-} K^{-}$ with respect to the $B^{-} \to D^{+} D^{-} K^{-}$ decay is measured to be $2.36 \pm 0.11 \pm 0.22 \pm 0.25$, where the first uncertainty is statistical, the second systematic and the third originates from the branching fractions of charm hadron decays.
Figures and captions
|
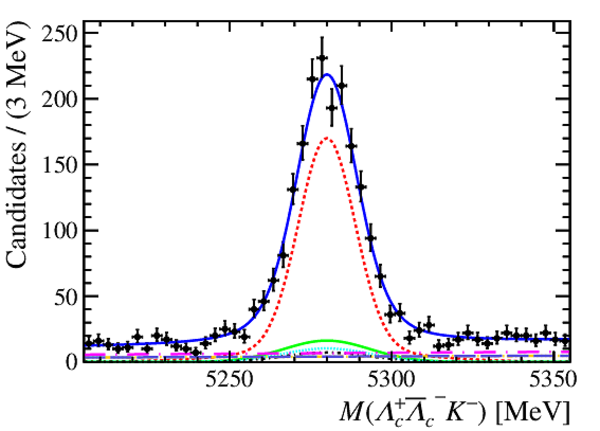
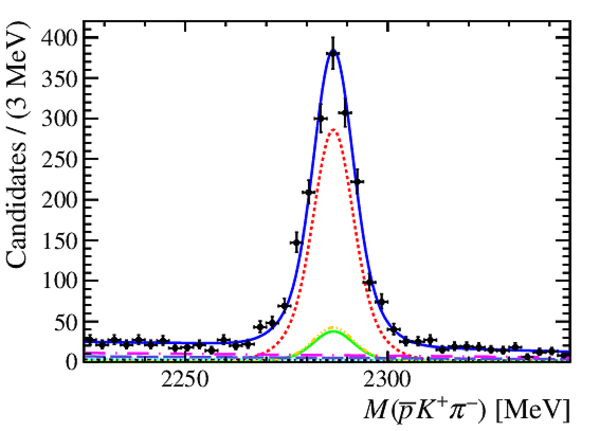
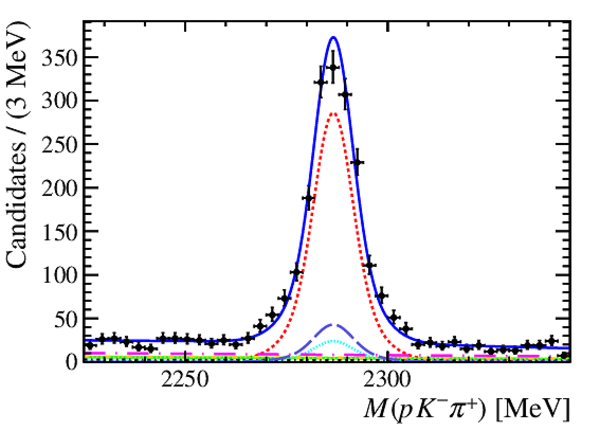
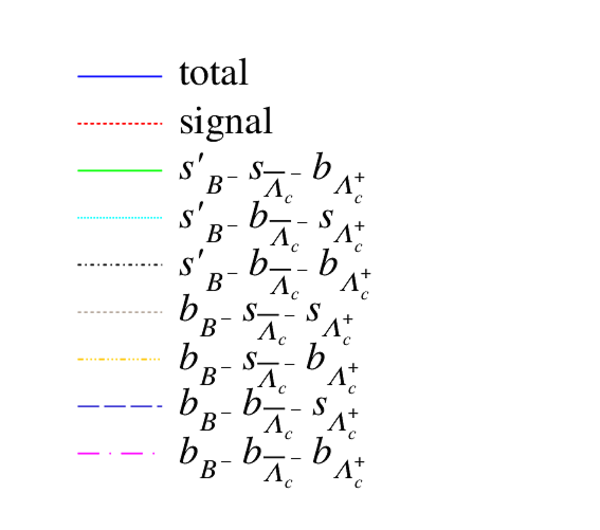
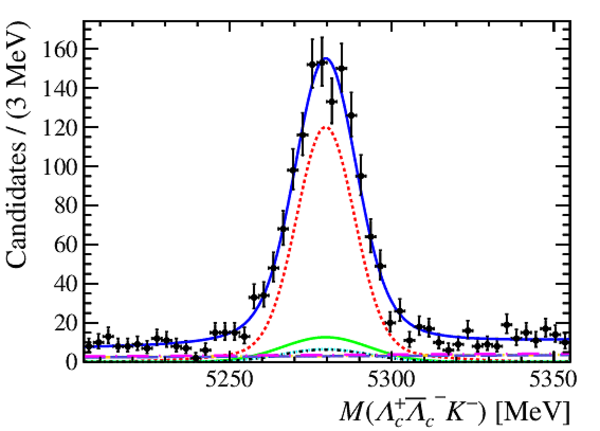
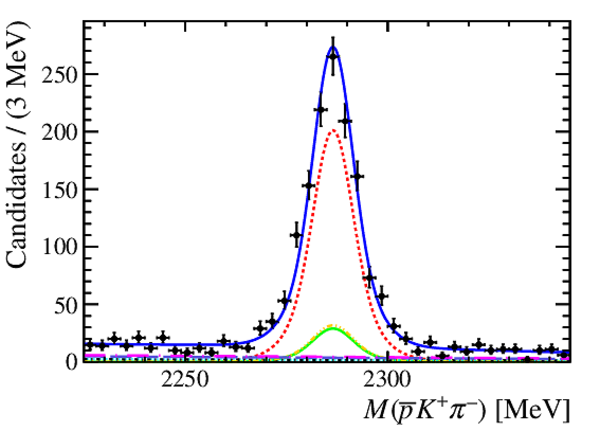
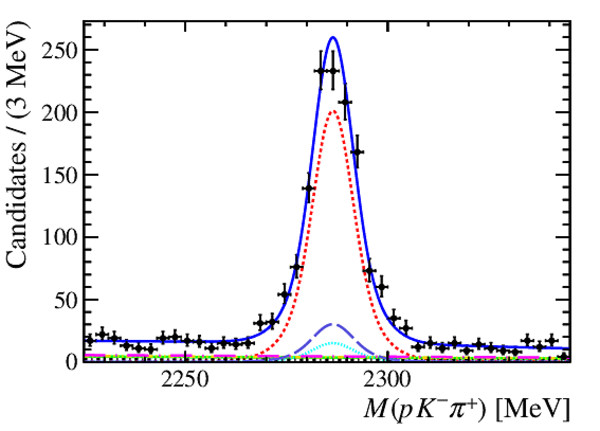
Distributions of (a) $M(\Lambda ^+_ c \overline{ \Lambda} {}^-_ c K ^- )$, (b) $M(\overline p K ^+ \pi ^- )$ and (c) $M( p K ^- \pi ^+ )$ of selected $ B ^- \rightarrow \Lambda ^+_ c \overline{ \Lambda} {}^-_ c K ^- $ candidates. The data points with error bars are shown along with the total fitted shape, which is composed of signal and background components, as shown in the legend. |
Fig1a.pdf [26 KiB] HiDef png [249 KiB] Thumbnail [186 KiB] *.C file |
|
|
Fig1b.pdf [25 KiB] HiDef png [243 KiB] Thumbnail [186 KiB] *.C file |
|
|
|
Fig1c.pdf [26 KiB] HiDef png [247 KiB] Thumbnail [187 KiB] *.C file |
|
|
|
Fig1d.pdf [13 KiB] HiDef png [128 KiB] Thumbnail [117 KiB] *.C file |
|
|
|
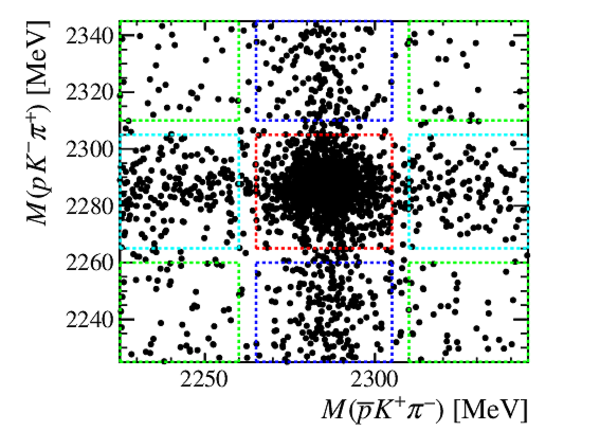
Selected $ B ^- \rightarrow \Lambda ^+_ c \overline{ \Lambda} {}^-_ c K ^- $ candidates in the two-dimensional $M( p K ^- \pi ^+ )$ and $M(\overline p K ^+ \pi ^- )$ spectrum. The red dashed box is the signal region, the dark blue, light blue and green boxes indicate regions dominated by $s_{\overline{ \Lambda} {}^-_ c }b_{\Lambda ^+_ c }$, $b_{\overline{ \Lambda} {}^-_ c }s_{\Lambda ^+_ c }$ and combinatorial background, respectively. |
Fig2.pdf [88 KiB] HiDef png [423 KiB] Thumbnail [378 KiB] *.C file |
|
|
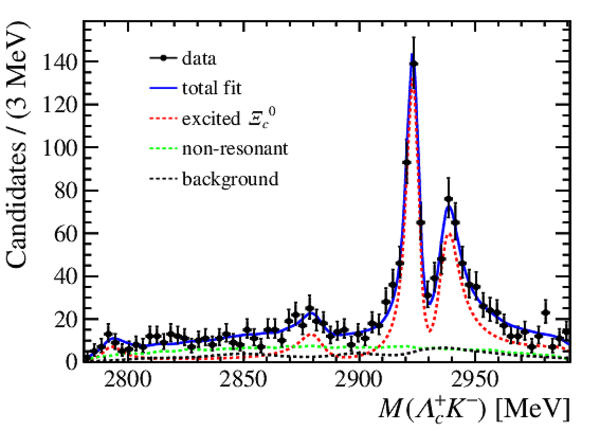
Mass spectrum of the $\Lambda ^+_ c K ^- $ pair from the $ B ^- \rightarrow \Lambda ^+_ c \overline{ \Lambda} {}^-_ c K ^- $ decays. The data points with error bars are shown along with the total fitted shape in blue solid line, which is composed of the components, as shown in the legend. |
Fig3.pdf [30 KiB] HiDef png [292 KiB] Thumbnail [234 KiB] *.C file |
|
|
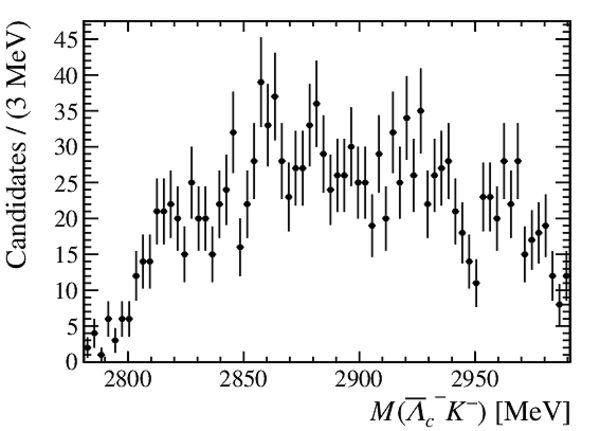
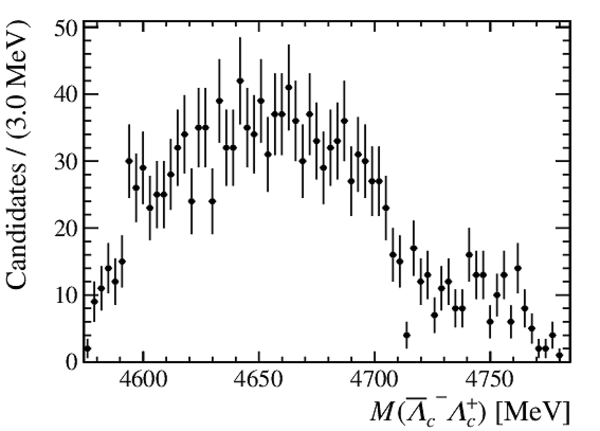
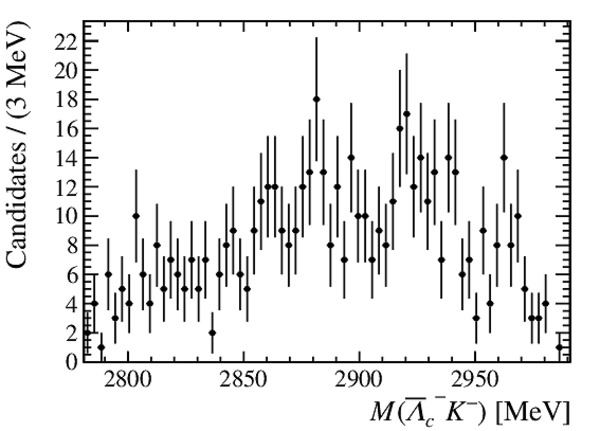
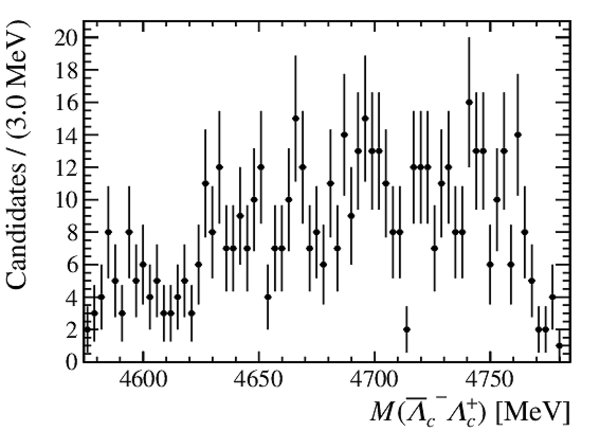
Mass spectrum of (a,c) $\overline{ \Lambda} {}^-_ c K ^- $ and (b,d) $\Lambda ^+_ c \overline{ \Lambda} {}^-_ c $ pairs from (a,b) all the $ B ^- \rightarrow \Lambda ^+_ c \overline{ \Lambda} {}^-_ c K ^- $ candidates and (c,d) after vetoing candidates with $2900 < M(\Lambda ^+_ c K ^- ) < 2970\text{ Me V} $. |
Fig4a.pdf [18 KiB] HiDef png [121 KiB] Thumbnail [70 KiB] *.C file |
|
|
Fig4b.pdf [17 KiB] HiDef png [111 KiB] Thumbnail [63 KiB] *.C file |
|
|
|
Fig4c.pdf [18 KiB] HiDef png [120 KiB] Thumbnail [70 KiB] *.C file |
|
|
|
Fig4d.pdf [17 KiB] HiDef png [119 KiB] Thumbnail [69 KiB] *.C file |
|
|
|
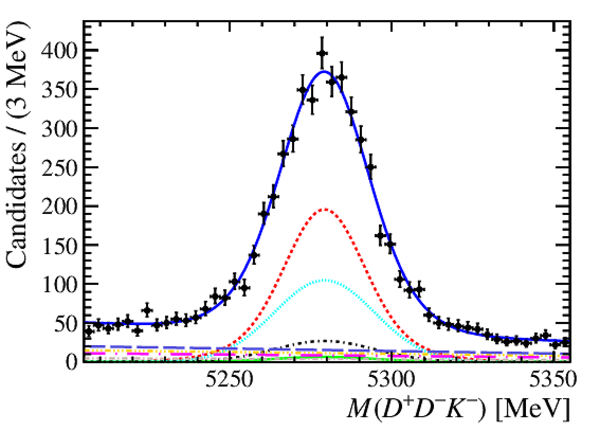
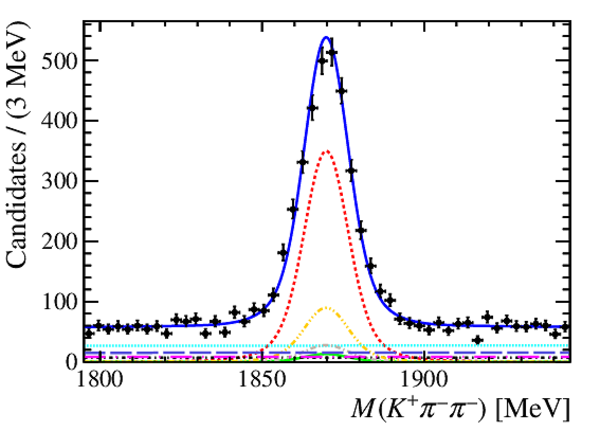
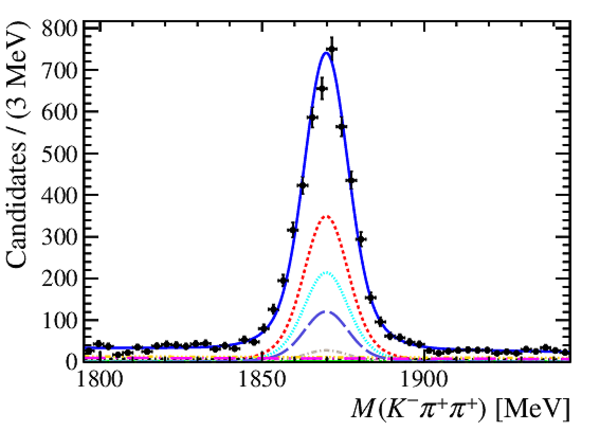
Distributions of (a) $M(\Lambda ^+_ c \overline{ \Lambda} {}^-_ c K ^- )$, (b) $M(\overline p K ^+ \pi ^- )$ and (c) $M( p K ^- \pi ^+ )$ in the $ B ^- \rightarrow \Lambda ^+_ c \overline{ \Lambda} {}^-_ c K ^- $ sample and distributions of (d) $M( D ^- D ^+ K ^- )$, (e) $M( K ^+ \pi ^- \pi ^- )$ and (f) $M( K ^- \pi ^+ \pi ^+ )$ in the $ B ^- \rightarrow D ^+ D ^- K ^- $ sample. All selected events are triggered due to $ B ^- $ candidates. The legend is the same as in Fig. 1, except replacing $\Lambda ^+_ c $ ($\overline{ \Lambda} {}^-_ c $) with $ D ^+ $ ($ D ^- $) for the $ B ^- \rightarrow D ^+ D ^- K ^- $ decay. |
Fig5a.pdf [26 KiB] HiDef png [257 KiB] Thumbnail [199 KiB] *.C file |
|
|
Fig5b.pdf [25 KiB] HiDef png [233 KiB] Thumbnail [172 KiB] *.C file |
|
|
|
Fig5c.pdf [25 KiB] HiDef png [242 KiB] Thumbnail [176 KiB] *.C file |
|
|
|
Fig5d.pdf [28 KiB] HiDef png [285 KiB] Thumbnail [214 KiB] *.C file |
|
|
|
Fig5e.pdf [27 KiB] HiDef png [258 KiB] Thumbnail [196 KiB] *.C file |
|
|
|
Fig5f.pdf [28 KiB] HiDef png [253 KiB] Thumbnail [190 KiB] *.C file |
|
|
|
Animated gif made out of all figures. |
PAPER-2022-028.gif Thumbnail |

|
![HiDef png [249 KiB]](Directory_LHCb-PAPER-2022-028/hidef_Fig1a.png)
![HiDef png [243 KiB]](Directory_LHCb-PAPER-2022-028/hidef_Fig1b.png)
![HiDef png [247 KiB]](Directory_LHCb-PAPER-2022-028/hidef_Fig1c.png)
![HiDef png [128 KiB]](Directory_LHCb-PAPER-2022-028/hidef_Fig1d.png)
![HiDef png [423 KiB]](Directory_LHCb-PAPER-2022-028/hidef_Fig2.png)
![HiDef png [292 KiB]](Directory_LHCb-PAPER-2022-028/hidef_Fig3.png)
![HiDef png [121 KiB]](Directory_LHCb-PAPER-2022-028/hidef_Fig4a.png)
![HiDef png [111 KiB]](Directory_LHCb-PAPER-2022-028/hidef_Fig4b.png)
![HiDef png [120 KiB]](Directory_LHCb-PAPER-2022-028/hidef_Fig4c.png)
![HiDef png [119 KiB]](Directory_LHCb-PAPER-2022-028/hidef_Fig4d.png)
![HiDef png [257 KiB]](Directory_LHCb-PAPER-2022-028/hidef_Fig5a.png)
![HiDef png [233 KiB]](Directory_LHCb-PAPER-2022-028/hidef_Fig5b.png)
![HiDef png [242 KiB]](Directory_LHCb-PAPER-2022-028/hidef_Fig5c.png)
![HiDef png [285 KiB]](Directory_LHCb-PAPER-2022-028/hidef_Fig5d.png)
![HiDef png [258 KiB]](Directory_LHCb-PAPER-2022-028/hidef_Fig5e.png)
![HiDef png [253 KiB]](Directory_LHCb-PAPER-2022-028/hidef_Fig5f.png)
Tables and captions
|
Definitions of the sideband regions, where $m( B ^- )$ and $m( D ^+ )$ represent the known values from Ref [27]. The same sideband region is defined for the $\overline p K ^+ \pi ^- $ combination as for the $ p K ^- \pi ^+ $ combination. The values are in $\text{ Me V}$ . |
Table_1.pdf [67 KiB] HiDef png [53 KiB] Thumbnail [14 KiB] tex code |

|
|
Measured masses, widths and significance of excited $\Xi ^0_ c $ states. |
Table_2.pdf [60 KiB] HiDef png [48 KiB] Thumbnail [25 KiB] tex code |

|
|
Systematic uncertainties on the masses and widths of the $\Xi _ c (2923)^{0}$, $\Xi _ c (2939)^{0}$ and $\Xi _ c (2880)^{0}$ states. Values are given in $\text{ Me V} $. |
Table_3.pdf [55 KiB] HiDef png [71 KiB] Thumbnail [31 KiB] tex code |

|
|
Relative systematic uncertainties of the branching fractions of signal, normalisation channel, and their ratio $R_{\mathcal{B} }$ (in percent). Correlation between the two channels are considered. |
Table_4.pdf [70 KiB] HiDef png [74 KiB] Thumbnail [34 KiB] tex code |

|
![HiDef png [53 KiB]](Directory_LHCb-PAPER-2022-028/hidef_Table_1.png)
![HiDef png [48 KiB]](Directory_LHCb-PAPER-2022-028/hidef_Table_2.png)
![HiDef png [71 KiB]](Directory_LHCb-PAPER-2022-028/hidef_Table_3.png)
![HiDef png [74 KiB]](Directory_LHCb-PAPER-2022-028/hidef_Table_4.png)
Created on 12 April 2024.