Information
LHCb-PAPER-2022-030
CERN-EP-2022-173
arXiv:2209.09840 [PDF]
(Submitted on 20 Sep 2022)
JHEP 07 (2023) 204
Inspire 2154232
Tools
Abstract
A Dalitz plot analysis of the $D_s^+ \to \pi^- \pi^+ \pi^+$ decay is presented. The analysis is based on proton-proton collision data recorded by the LHCb experiment at a centre-of-mass energy of $8$ TeV and corresponding to an integrated luminosity of $1.5 fb^{-1}$. The resonant structure of the decay is obtained using a quasi-model-independent partial-wave analysis, in which the $\pi^+\pi^-$ S-wave amplitude is parameterised as a generic complex function determined by a fit to the data. The S-wave component is found to be dominant, followed by the contribution from spin-2 resonances and a small contribution from spin-1 resonances. The latter includes the first observation of the $D_s^+ \to \omega(782) \pi^+$ channel in the $D_s^+ \to \pi^- \pi^+ \pi^+$ decay. The resonant structures of the $D_s^+ \to \pi^- \pi^+ \pi^+$ and $D^+ \to \pi^- \pi^+ \pi^+$ decays are compared, providing information about the mechanisms for the hadron formation in these decays.
Figures and captions
|
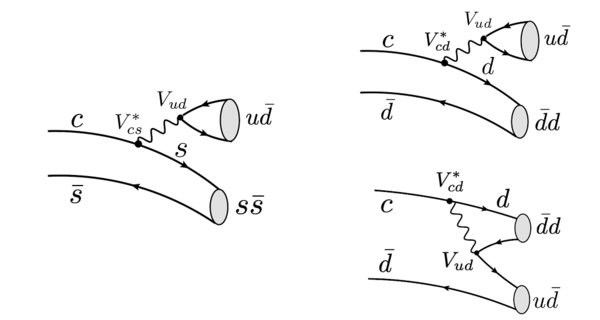
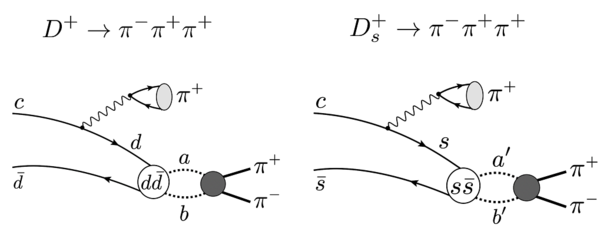
Dominant tree-level diagrams leading to the (left) $D^+_s\rightarrow \pi^-\pi^+\pi^+$ and (right) $ D ^+ \rightarrow \pi ^- \pi ^+ \pi ^+ $ decays. The resonances are produced from an $s\bar s$ pair in the $D^+_s\rightarrow \pi^-\pi^+\pi^+$ decay and from a $d\bar d$ pair in the $ D ^+ \rightarrow \pi ^- \pi ^+ \pi ^+ $ decay. For both decays, the annihilation diagram is suppressed. |
Fig1.pdf [296 KiB] HiDef png [194 KiB] Thumbnail [102 KiB] *.C file |
|
|
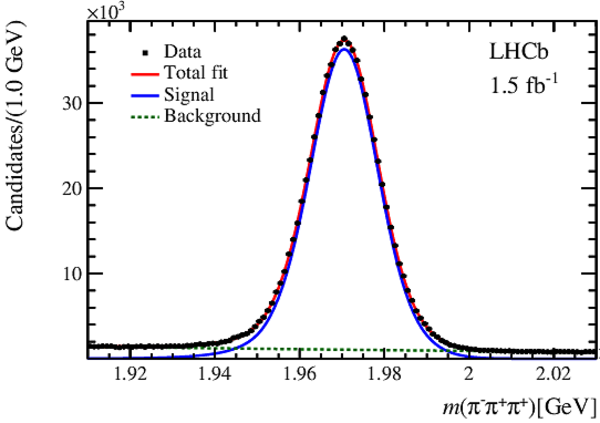
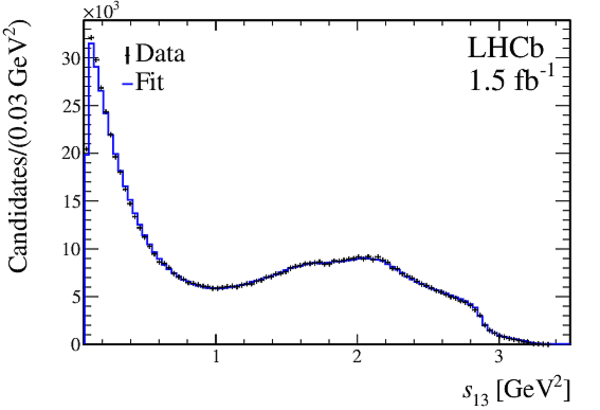
Invariant-mass distribution of $ D ^+_ s \rightarrow \pi ^- \pi ^+ \pi ^+ $ candidates after the final selection, with the fit result superimposed. |
Fig2.pdf [36 KiB] HiDef png [197 KiB] Thumbnail [160 KiB] *.C file |
|
|
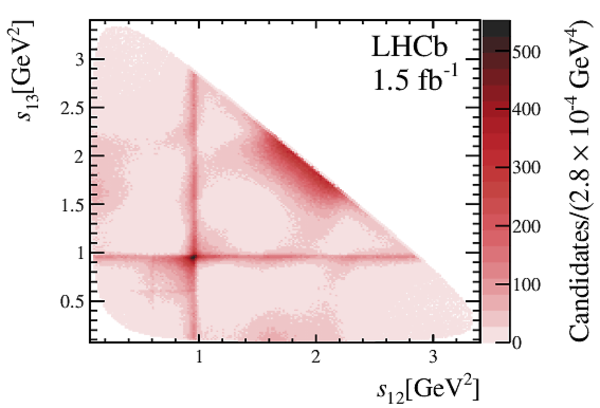
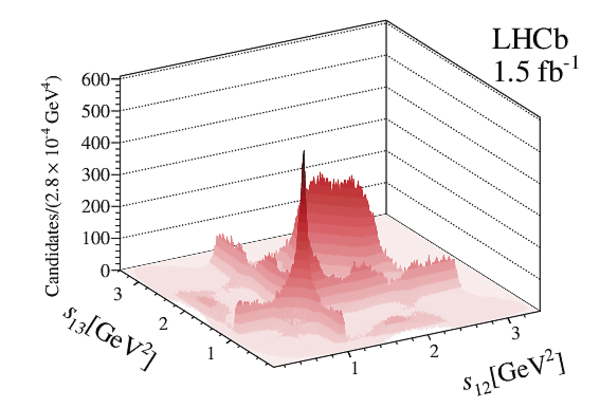
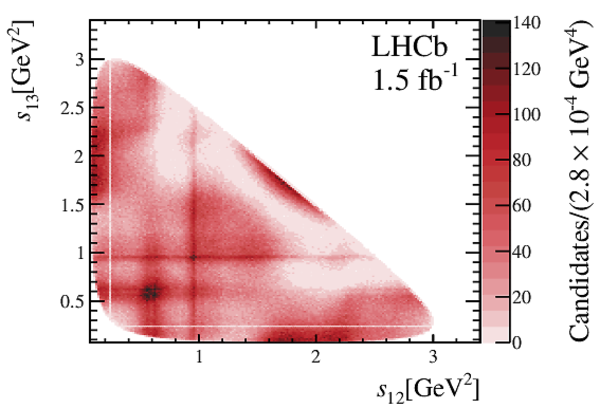
(Top) Dalitz plot from selected $ D ^+_ s \rightarrow \pi ^- \pi ^+ \pi ^+ $ candidates in the signal region. The colour scale indicates the density of candidates. (Bottom) Perspective view of the Dalitz plot. |
Fig3a.pdf [102 KiB] HiDef png [652 KiB] Thumbnail [324 KiB] *.C file |
|
|
Fig3b.pdf [1 MiB] HiDef png [872 KiB] Thumbnail [353 KiB] *.C file |
|
|
|
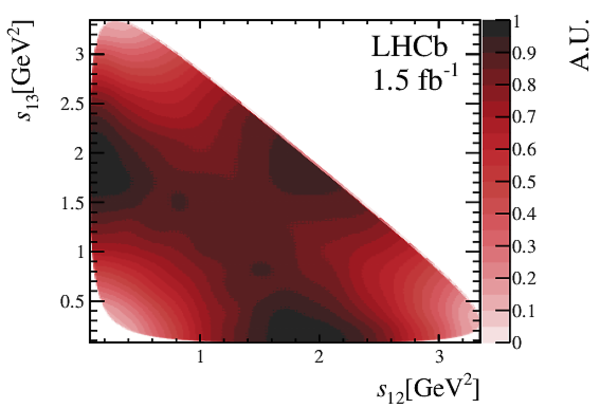
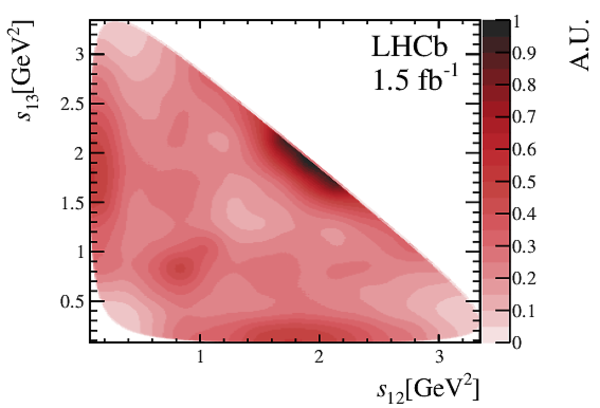
(Left) efficiency variation over the Dalitz plot and (right) background model for $ D ^+_ s \rightarrow \pi ^- \pi ^+ \pi ^+ $ decays. |
Fig4a.pdf [217 KiB] HiDef png [503 KiB] Thumbnail [269 KiB] *.C file |
|
|
Fig4b.pdf [213 KiB] HiDef png [522 KiB] Thumbnail [266 KiB] *.C file |
|
|
|
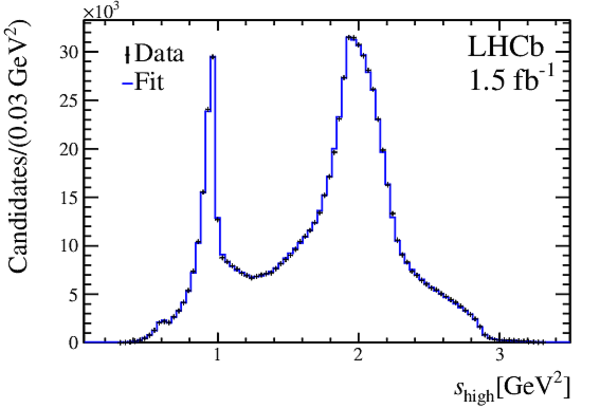
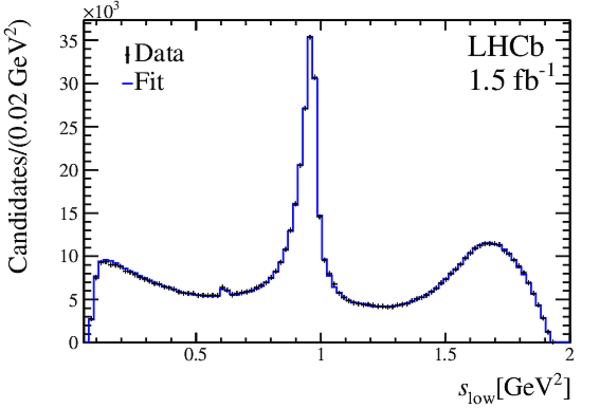
{The folded Dalitz plot projections (left) $s_{high}$ and (right) $s_{low}$}. |
Fig5a.pdf [18 KiB] HiDef png [143 KiB] Thumbnail [127 KiB] *.C file |
|
|
Fig5b.pdf [19 KiB] HiDef png [150 KiB] Thumbnail [134 KiB] *.C file |
|
|
|
(Left) The unfolded Dalitz plot projection $s_{13}$; (right) the folded distribution of the normalised residuals across the Dalitz plot. |
Fig6a.pdf [19 KiB] HiDef png [143 KiB] Thumbnail [124 KiB] *.C file |
|
|
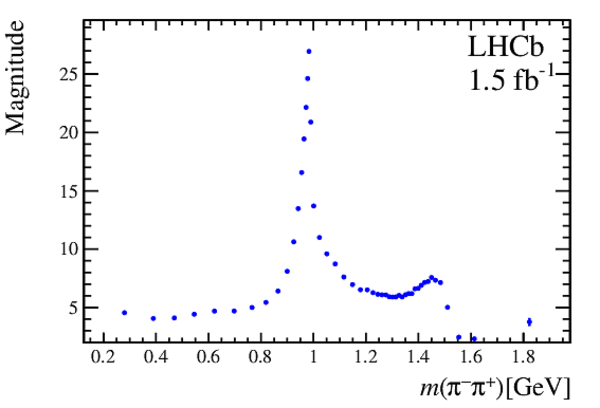
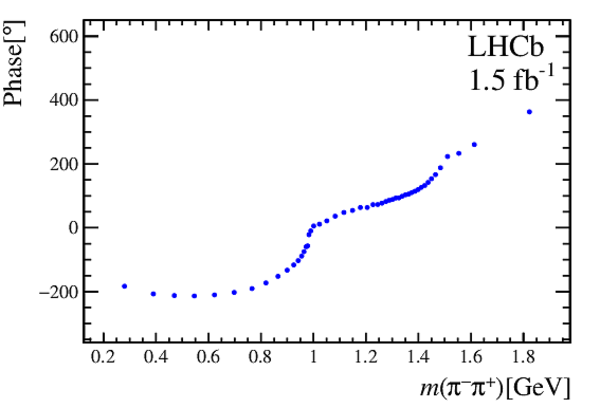
(Left) Magnitude and (right) phase of the S-wave amplitude as a function of $m(\pi^+\pi^-)$. The uncertainties are statistical. |
Fig7a.pdf [15 KiB] HiDef png [100 KiB] Thumbnail [97 KiB] *.C file |
|
|
Fig7b.pdf [15 KiB] HiDef png [99 KiB] Thumbnail [93 KiB] *.C file |
|
|
|
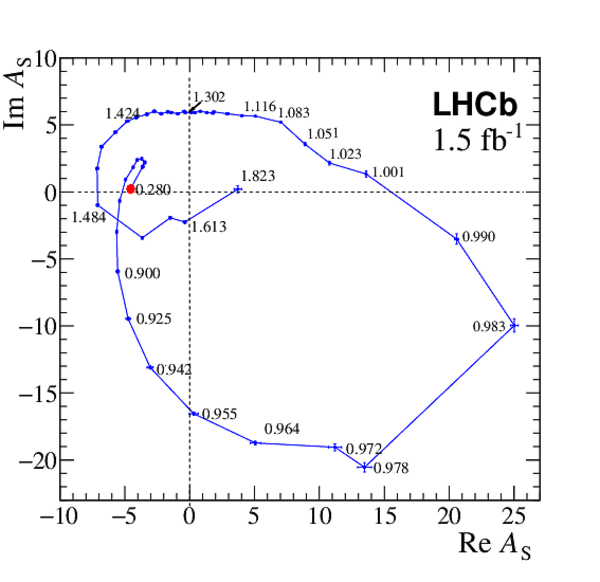
Argand plot of the $\pi^+\pi^-$ S-wave amplitude. The values of $m(\pi^+\pi^-)$ at the edge of each interval are indicated next to the corresponding experimental point. The amplitude starts at the point circled in red and undergoes two counterclockwise circles. |
Fig8.pdf [18 KiB] HiDef png [224 KiB] Thumbnail [184 KiB] *.C file |
|
|
(Left) Dalitz plot of the $ D ^+_ s \rightarrow \pi ^- \pi ^+ \pi ^+ $ and (right) $ D ^+ \rightarrow \pi ^- \pi ^+ \pi ^+ $ decays [4]. The colour scale indicates the density of candidates. |
Fig3a.pdf [102 KiB] HiDef png [652 KiB] Thumbnail [324 KiB] *.C file |
|
|
Fig9b.pdf [98 KiB] HiDef png [1 MiB] Thumbnail [421 KiB] *.C file |
|
|
|
Dominant amplitudes for the $ D ^+ \rightarrow \pi ^- \pi ^+ \pi ^+ $ and $ D ^+_ s \rightarrow \pi ^- \pi ^+ \pi ^+ $ decays. The scalar resonances are produced from rescattering of the two pseudoscalar mesons $ab$ ($a'b'$) formed by a $q\bar q$ pair from the vacuum and the $d\bar d$ ($s\bar s$) pair from the decay of the $c$ quark. |
Fig10.pdf [301 KiB] HiDef png [163 KiB] Thumbnail [86 KiB] *.C file |
|
|
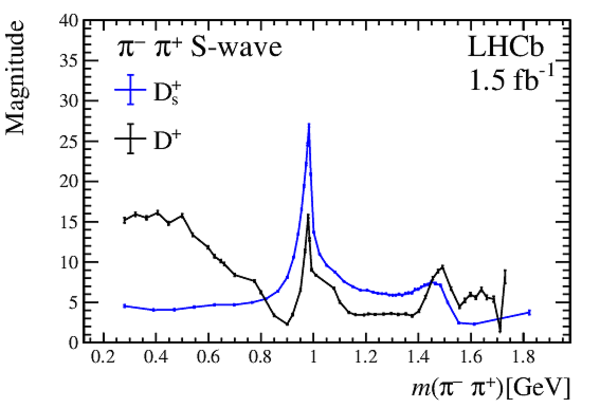
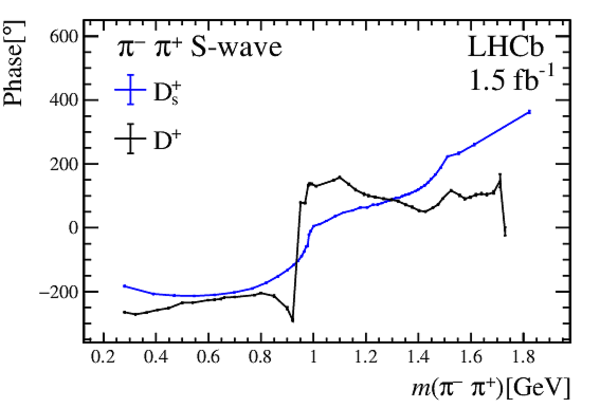
(Left) Magnitude and (right) phase of the $\pi ^-$ $\pi ^+$ S-wave amplitude for the $ D ^+ \rightarrow \pi ^- \pi ^+ \pi ^+ $ (black line) and $ D ^+_ s \rightarrow \pi ^- \pi ^+ \pi ^+ $ decays (blue dot). |
Fig11a.pdf [18 KiB] HiDef png [169 KiB] Thumbnail [160 KiB] *.C file |
|
|
Fig11b.pdf [17 KiB] HiDef png [144 KiB] Thumbnail [132 KiB] *.C file |
|
|
|
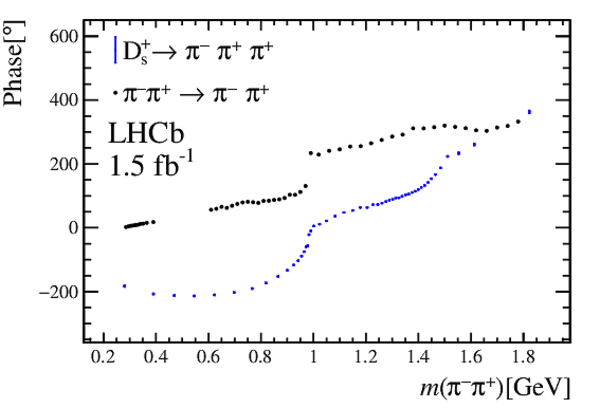
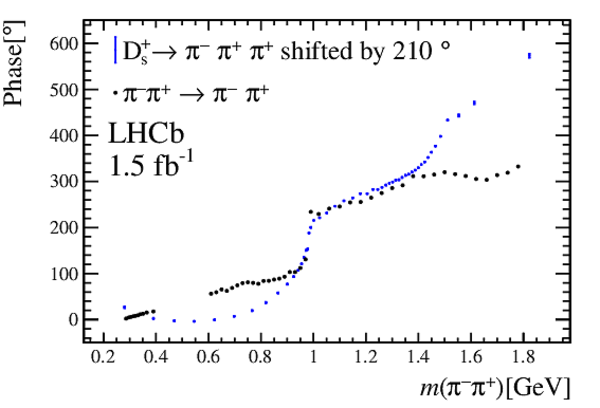
(Left) Comparison of the $\pi^+\pi^-$ S-wave phase from $ D ^+_ s \rightarrow \pi ^- \pi ^+ \pi ^+ $ decays and the phase from $\pi^+\pi^-\rightarrow \pi^+\pi^-$ scattering. Data on $\pi^+\pi^-\rightarrow \pi^+\pi^-$ scattering above 0.6 $\text{ Ge V}$ are from a re-analysis [5] of original data from [34], and below 0.4 $\text{ Ge V}$ are from $K_{e4}$ decays [35]. (Right) The S-wave phase from the $ D ^+_ s \rightarrow \pi ^- \pi ^+ \pi ^+ $ decay is shifted by 210$^{\circ}$. |
Fig12a.pdf [18 KiB] HiDef png [119 KiB] Thumbnail [116 KiB] *.C file |
|
|
Fig12b.pdf [18 KiB] HiDef png [138 KiB] Thumbnail [140 KiB] *.C file |
|
|
|
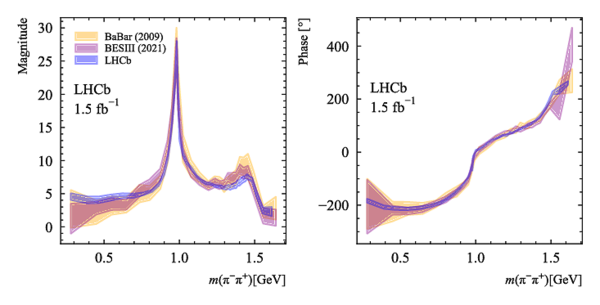
Comparison of $\pi ^+$ $\pi ^-$ S-wave amplitude from the $ D ^+_ s \rightarrow \pi ^- \pi ^+ \pi ^+ $ decay with previous results from BaBar [6] and BESIII [7]. |
Fig13.pdf [28 KiB] HiDef png [298 KiB] Thumbnail [152 KiB] *.C file |
|
|
Animated gif made out of all figures. |
PAPER-2022-030.gif Thumbnail |

|
![HiDef png [194 KiB]](Directory_LHCb-PAPER-2022-030/hidef_Fig1.png)
![HiDef png [197 KiB]](Directory_LHCb-PAPER-2022-030/hidef_Fig2.png)
![HiDef png [652 KiB]](Directory_LHCb-PAPER-2022-030/hidef_Fig3a.png)
![HiDef png [872 KiB]](Directory_LHCb-PAPER-2022-030/hidef_Fig3b.png)
![HiDef png [503 KiB]](Directory_LHCb-PAPER-2022-030/hidef_Fig4a.png)
![HiDef png [522 KiB]](Directory_LHCb-PAPER-2022-030/hidef_Fig4b.png)
![HiDef png [143 KiB]](Directory_LHCb-PAPER-2022-030/hidef_Fig5a.png)
![HiDef png [150 KiB]](Directory_LHCb-PAPER-2022-030/hidef_Fig5b.png)
![HiDef png [143 KiB]](Directory_LHCb-PAPER-2022-030/hidef_Fig6a.png)
![HiDef png [100 KiB]](Directory_LHCb-PAPER-2022-030/hidef_Fig7a.png)
![HiDef png [99 KiB]](Directory_LHCb-PAPER-2022-030/hidef_Fig7b.png)
![HiDef png [224 KiB]](Directory_LHCb-PAPER-2022-030/hidef_Fig8.png)
![HiDef png [1 MiB]](Directory_LHCb-PAPER-2022-030/hidef_Fig9b.png)
![HiDef png [163 KiB]](Directory_LHCb-PAPER-2022-030/hidef_Fig10.png)
![HiDef png [169 KiB]](Directory_LHCb-PAPER-2022-030/hidef_Fig11a.png)
![HiDef png [144 KiB]](Directory_LHCb-PAPER-2022-030/hidef_Fig11b.png)
![HiDef png [119 KiB]](Directory_LHCb-PAPER-2022-030/hidef_Fig12a.png)
![HiDef png [138 KiB]](Directory_LHCb-PAPER-2022-030/hidef_Fig12b.png)
![HiDef png [298 KiB]](Directory_LHCb-PAPER-2022-030/hidef_Fig13.png)
Tables and captions
|
Masses and widths of the resonances used in the fit [2]. Quoted uncertainties are used to estimate systematic uncertainties. |
Table_1.pdf [60 KiB] HiDef png [111 KiB] Thumbnail [40 KiB] tex code |

|
|
Spin-dependent Blatt--Weisskopf barrier factors. The normalisation ensures that the barrier factors are equal to unity at the resonance mass. |
Table_2.pdf [66 KiB] HiDef png [27 KiB] Thumbnail [13 KiB] tex code |

|
|
Results from the default fit. The row "combined" has the combined fit fractions of the $\rho(1450)^0$ and $\rho(1700)^0$ contributions, including the interference between them. The uncertainties are statistical. |
Table_3.pdf [65 KiB] HiDef png [87 KiB] Thumbnail [41 KiB] tex code |

|
|
Results from the default fit. Interference fit fractions (%) between the resonant amplitudes. The uncertainties are statistical. |
Table_4.pdf [59 KiB] HiDef png [98 KiB] Thumbnail [44 KiB] tex code |

|
|
Summary of the systematic uncertainties on the magnitudes and phases of the complex coefficients from the P- and D-wave amplitudes. The column "total exp." is the sum in quadrature of the first four columns. For comparison, the statistical uncertainties are included in the last column. |
Table_5.pdf [55 KiB] HiDef png [97 KiB] Thumbnail [42 KiB] tex code |

|
|
Systematic uncertainties on the fit fractions (%). The combined fit fractions of the $\rho(1450)^{0}\pi^+$ and $\rho(1700)^{0}\pi^+$ are quoted in the row "combined". |
Table_6.pdf [56 KiB] HiDef png [98 KiB] Thumbnail [47 KiB] tex code |

|
|
Final results of the $ D ^+_ s \rightarrow \pi ^- \pi ^+ \pi ^+ $ Dalitz plot fit. The uncertainties are statistical, experimental systematic and associated to the decay amplitude model, respectively. |
Table_7.pdf [64 KiB] HiDef png [132 KiB] Thumbnail [65 KiB] tex code |

|
|
Resonant structure of the $ D ^+_ s \rightarrow \pi ^- \pi ^+ \pi ^+ $ decay from this analysis compared to previous determinations from BaBar [6] and BESIII [7]. The fit fractions are given in per cent. The statistical and systematic uncertainties are added in quadrature. |
Table_8.pdf [62 KiB] HiDef png [90 KiB] Thumbnail [46 KiB] tex code |

|
|
Magnitude and phase of the S-wave amplitude as a function of $\pi ^-$ $\pi ^+$ invariant mass. The uncertainties are statistical, experimental and model, respectively. The $\pi^+\pi^-$ invariant mass is expressed in $\text{ Ge V}$ . |
Table_9.pdf [60 KiB] HiDef png [528 KiB] Thumbnail [288 KiB] tex code |

|
|
Resonant structures of the $ D ^+_ s \rightarrow \pi ^- \pi ^+ \pi ^+ $ and $ D ^+ \rightarrow \pi ^- \pi ^+ \pi ^+ $ [4] decays, expressed fit fractions (%). Uncertainties are only statistical. |
Table_10.pdf [66 KiB] HiDef png [50 KiB] Thumbnail [25 KiB] tex code |

|
![HiDef png [111 KiB]](Directory_LHCb-PAPER-2022-030/hidef_Table_1.png)
![HiDef png [27 KiB]](Directory_LHCb-PAPER-2022-030/hidef_Table_2.png)
![HiDef png [87 KiB]](Directory_LHCb-PAPER-2022-030/hidef_Table_3.png)
![HiDef png [98 KiB]](Directory_LHCb-PAPER-2022-030/hidef_Table_4.png)
![HiDef png [97 KiB]](Directory_LHCb-PAPER-2022-030/hidef_Table_5.png)
![HiDef png [98 KiB]](Directory_LHCb-PAPER-2022-030/hidef_Table_6.png)
![HiDef png [132 KiB]](Directory_LHCb-PAPER-2022-030/hidef_Table_7.png)
![HiDef png [90 KiB]](Directory_LHCb-PAPER-2022-030/hidef_Table_8.png)
![HiDef png [528 KiB]](Directory_LHCb-PAPER-2022-030/hidef_Table_9.png)
![HiDef png [50 KiB]](Directory_LHCb-PAPER-2022-030/hidef_Table_10.png)
Created on 20 April 2024.