Information
LHCb-PAPER-2022-032
CERN-EP-2022-206
arXiv:2211.08847 [PDF]
(Submitted on 16 Nov 2022)
Phys. Rev. Lett. 131 (2023) 091901
Inspire 2691605
Tools
Abstract
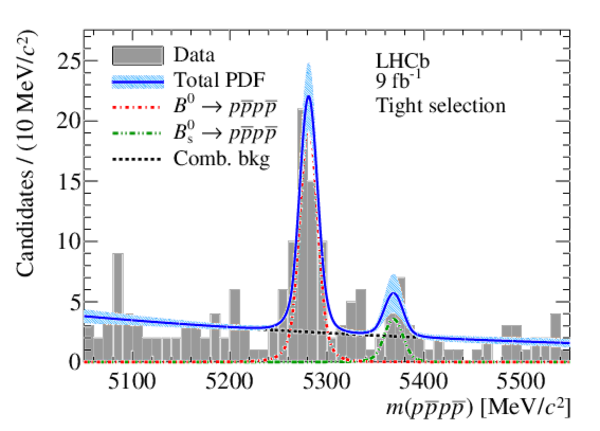
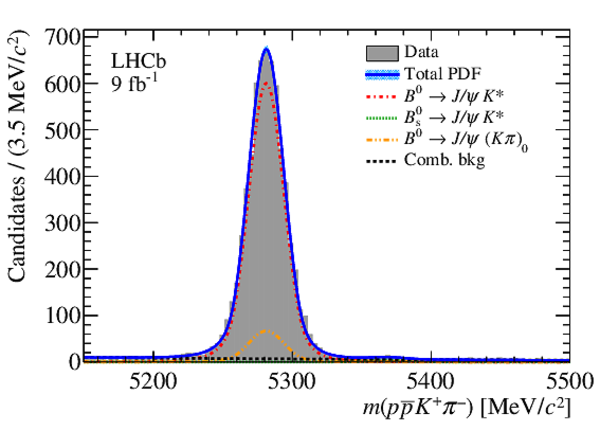
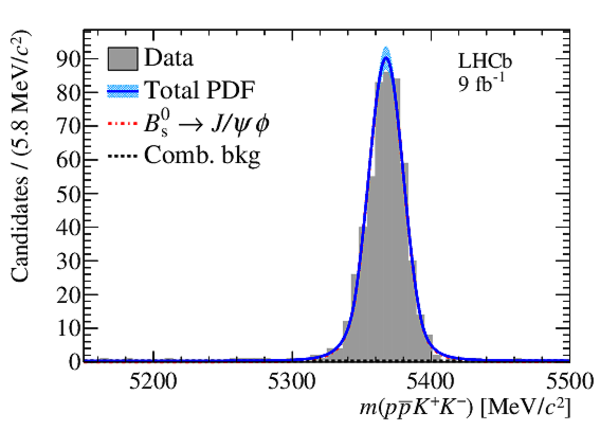
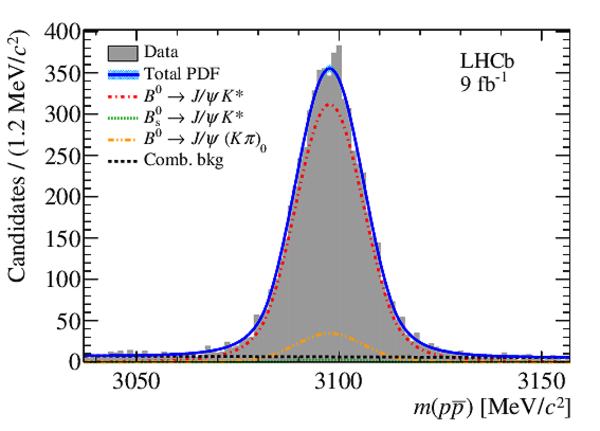
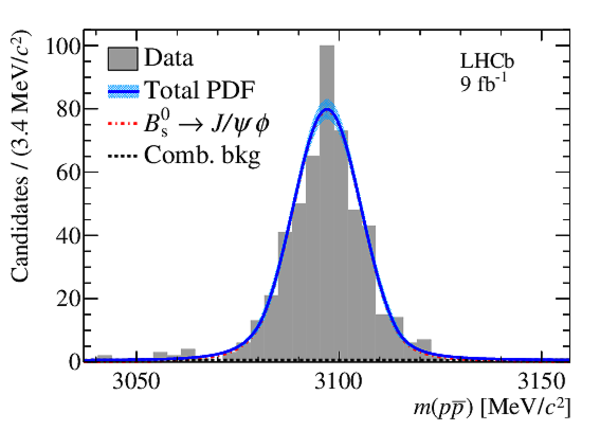
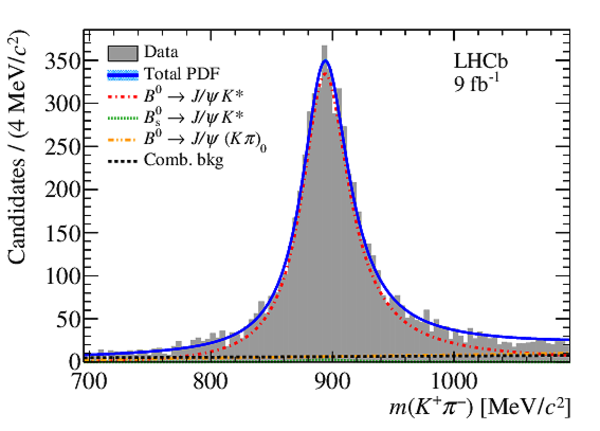
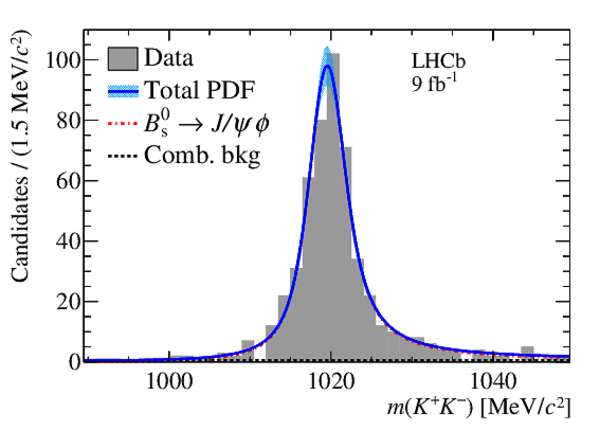
Searches for the rare hadronic decays $B^0 \rightarrow p\bar{p}p\bar{p}$ and $B^0_{s} \rightarrow p\bar{p}p\bar{p}$ are performed using proton-proton collision data recorded by the LHCb experiment and corresponding to an integrated luminosity of 9$\rm{fb}^{-1}$. Significances of $9.3 \sigma$ and $4.0 \sigma$, including statistical and systematic uncertainties, are obtained for the $B^0 \rightarrow p\bar{p}p\bar{p}$ and $B^0_{s} \rightarrow p\bar{p}p\bar{p}$ signals, respectively. The branching fractions are measured relative to the topologically similar normalisation decays $B^0 \rightarrow J/\psi(\rightarrow p\bar{p}) K^{*0}(\rightarrow K^+ \pi^-)$ and $B^0_{s} \rightarrow J/\psi(\rightarrow p\bar{p}) \phi(\rightarrow K^+ K^-)$. The branching fractions are measured to be $ \mathcal{B}(B^0 \rightarrow p\bar{p}p\bar{p}) = ( 2.2 \pm 0.4 \pm 0.1 \pm 0.1 ) \times 10^{-8} $ and $ \mathcal{B}(B^0_{s} \rightarrow p\bar{p}p\bar{p}) = ( 2.3 \pm 1.0 \pm 0.2 \pm 0.1 ) \times 10^{-8}$. In these measurements, the first uncertainty is statistical, the second is systematic and the third one is due to the external branching fraction of the normalisation channel.
Figures and captions
|
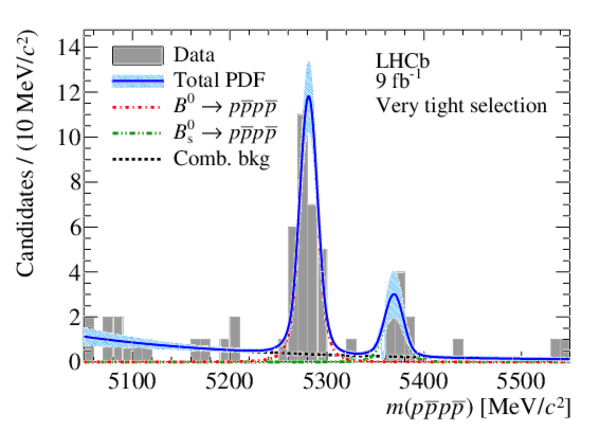
Combined Run 1 plus Run 2 invariant-mass distributions of $ B ^0_{{\scriptscriptstyle (} s {\scriptscriptstyle )}} \rightarrow p \overline p p \overline p $ candidates satisfying (left) the tight and (right) the very tight selection criteria discussed in the text. The fit results (solid blue lines) for these samples are shown together with the fit model components. The hashed cyan band corresponds to the $1 \sigma$ model uncertainty based on the fit covariance matrix. |
Fig1a.pdf [49 KiB] HiDef png [463 KiB] Thumbnail [271 KiB] *.C file |
|
|
Fig1b.pdf [51 KiB] HiDef png [436 KiB] Thumbnail [252 KiB] *.C file |
|
|
|
Animated gif made out of all figures. |
PAPER-2022-032.gif Thumbnail |

|
![HiDef png [463 KiB]](Directory_LHCb-PAPER-2022-032/hidef_Fig1a.png)
![HiDef png [436 KiB]](Directory_LHCb-PAPER-2022-032/hidef_Fig1b.png)
Tables and captions
|
Summary of systematic uncertainties on $\mathcal{B} ( B ^0_{{\scriptscriptstyle (} s {\scriptscriptstyle )}} \rightarrow p \overline p p \overline p )$ relative to the statistical uncertainties in [%]. The total systematic uncertainty is calculated as the quadratic sum of the individual systematic uncertainties. |
Table_1.pdf [64 KiB] HiDef png [77 KiB] Thumbnail [34 KiB] tex code |

|
![HiDef png [77 KiB]](Directory_LHCb-PAPER-2022-032/hidef_Table_1.png)
Supplementary Material [file]
|
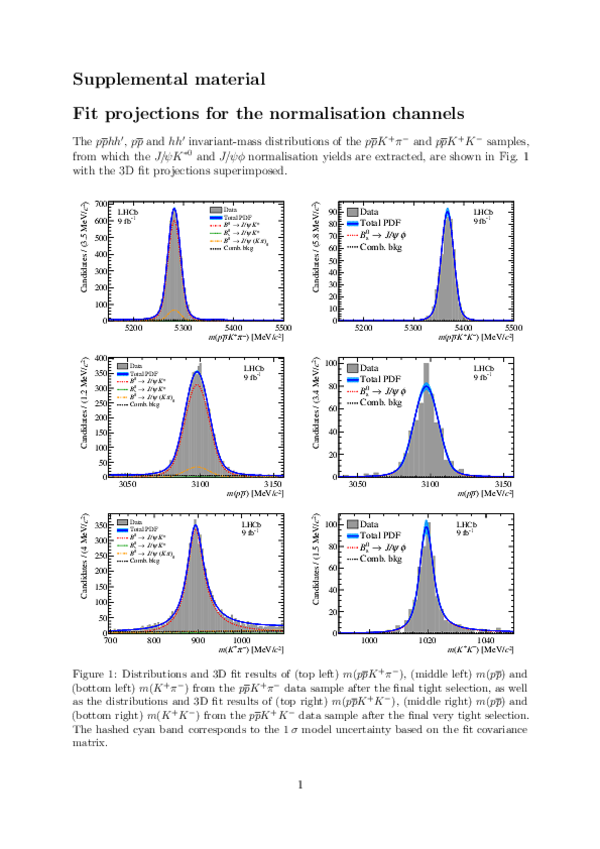
This ZIP file contains supplemetary material for the publication LHCb-PAPER-2022-032. The files are: Supplementary.pdf : An overview of the extra figures *.pdf, *.png, *.eps : The figures in variuous formats |
Fig1a.pdf [32 KiB] HiDef png [306 KiB] Thumbnail [215 KiB] *C file |
|
|
Fig1b.pdf [30 KiB] HiDef png [237 KiB] Thumbnail [197 KiB] *C file |
|
|
|
Fig1c.pdf [30 KiB] HiDef png [330 KiB] Thumbnail [228 KiB] *C file |
|
|
|
Fig1d.pdf [27 KiB] HiDef png [235 KiB] Thumbnail [172 KiB] *C file |
|
|
|
Fig1e.pdf [31 KiB] HiDef png [342 KiB] Thumbnail [238 KiB] *C file |
|
|
|
Fig1f.pdf [28 KiB] HiDef png [240 KiB] Thumbnail [176 KiB] *C file |
|
|
|
Fig2a.pdf [17 KiB] HiDef png [137 KiB] Thumbnail [139 KiB] *C file |
|
|
|
Fig2b.pdf [14 KiB] HiDef png [115 KiB] Thumbnail [111 KiB] *C file |
|
|
|
LHCb-P[..].pdf [316 KiB] HiDef png [711 KiB] Thumbnail [405 KiB] *C file |
|
![HiDef png [306 KiB]](Directory_LHCb-PAPER-2022-032/supplementary/hidef_Fig1a.png)
![HiDef png [237 KiB]](Directory_LHCb-PAPER-2022-032/supplementary/hidef_Fig1b.png)
![HiDef png [330 KiB]](Directory_LHCb-PAPER-2022-032/supplementary/hidef_Fig1c.png)
![HiDef png [235 KiB]](Directory_LHCb-PAPER-2022-032/supplementary/hidef_Fig1d.png)
![HiDef png [342 KiB]](Directory_LHCb-PAPER-2022-032/supplementary/hidef_Fig1e.png)
![HiDef png [240 KiB]](Directory_LHCb-PAPER-2022-032/supplementary/hidef_Fig1f.png)
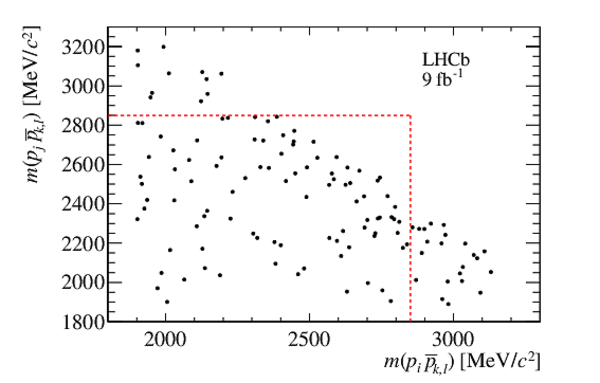
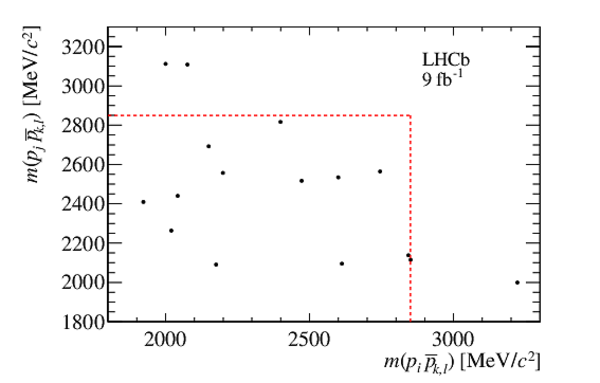
![HiDef png [137 KiB]](Directory_LHCb-PAPER-2022-032/supplementary/hidef_Fig2a.png)
![HiDef png [115 KiB]](Directory_LHCb-PAPER-2022-032/supplementary/hidef_Fig2b.png)
![HiDef png [711 KiB]](Directory_LHCb-PAPER-2022-032/supplementary/hidef_LHCb-PAPER-2022-032-SupplementalMaterial.png)
Created on 20 April 2024.