Evidence of a $J/\psi K_{\rm S}^0$ structure in $B^0 \to J/\psi \phi K_{\rm S}^0$ decays
[to restricted-access page]Information
LHCb-PAPER-2022-040
CERN-EP-2022-258
arXiv:2301.04899 [PDF]
(Submitted on 12 Jan 2023)
Phys. Rev. Lett. 131 (2023) 131901
Inspire 2703387
Tools
Abstract
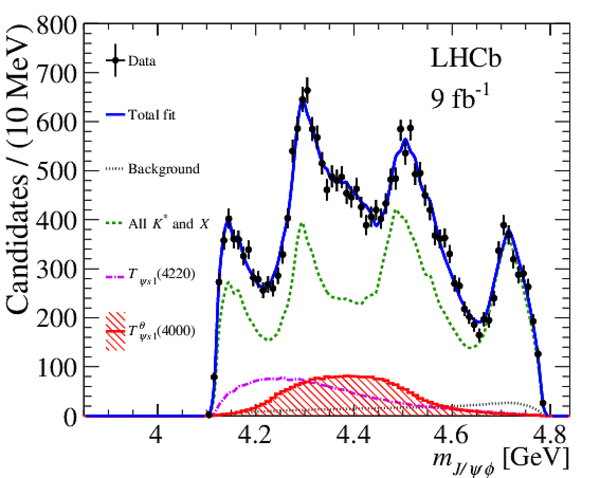
An amplitude analysis of $B^0 \to J/\psi \phi K_S^0$ decays is performed using proton-proton collision data corresponding to an integrated luminosity of 9 ${\rm fb}^{-1}$, collected with the LHCb detector at centre-of-mass energies of 7, 8 and 13 TeV. Evidence with a significance of $4.0$ standard deviations of a structure in the $J/\psi K_S^0$ system, named $T_{\psi s1}^{\theta}(4000)^0$, is seen, with its mass and width measured to be $3991 _{-10}^{+12} ^{+\phantom{0}9}_{-17}$ MeV and $105 _{-25}^{+29} ^{+17}_{-23}$ MeV, respectively, where the first uncertainty is statistical and the second systematic. The $T_{\psi s1}^{\theta}(4000)^0$ state is likely to be the isospin partner of the $T_{\psi s1}^{\theta}(4000)^+$ state, previously observed in the $J/\psi K^+$ system of the $B^+ \to J/\psi \phi K^+$ decay. When isospin symmetry for the charged and neutral $T_{\psi s1}^{\theta}(4000)$ states, is assumed, the signal significance increases to $5.4$ standard deviations.
Figures and captions
|
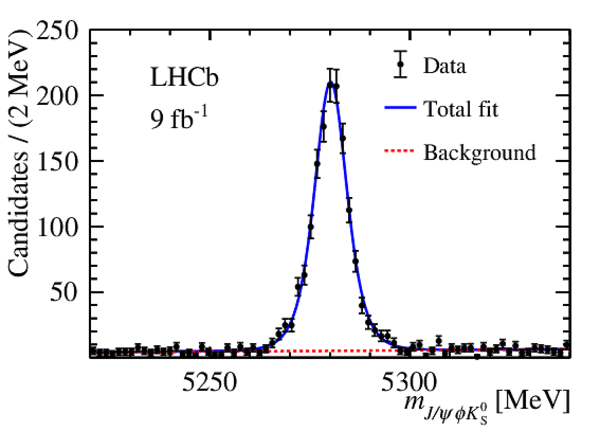
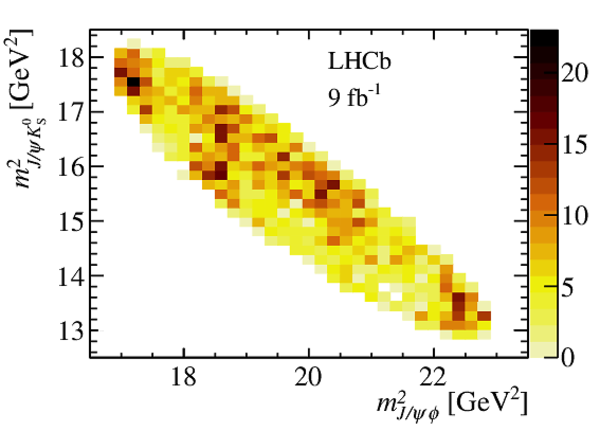
(a) Invariant-mass distribution of selected $ B ^0$ candidates and corresponding fit result. (b) Distribution of $m^2_{ { J \mskip -3mu/\mskip -2mu\psi } K ^0_{\mathrm{S}} }$ versus $m^2_{ { J \mskip -3mu/\mskip -2mu\psi } \phi}$ for candidates in the $\pm$15 $\text{ Me V}$ region around the nominal $ B ^0 $ mass. |
Fig1a.pdf [19 KiB] HiDef png [187 KiB] Thumbnail [160 KiB] *.C file |
|
|
Fig1b.pdf [16 KiB] HiDef png [164 KiB] Thumbnail [164 KiB] *.C file |
|
|
|
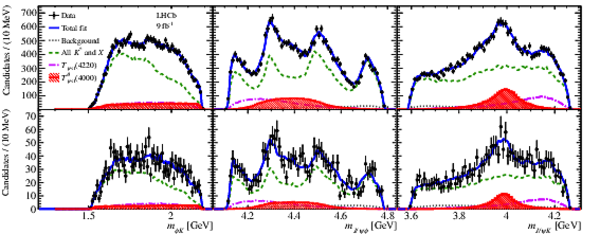
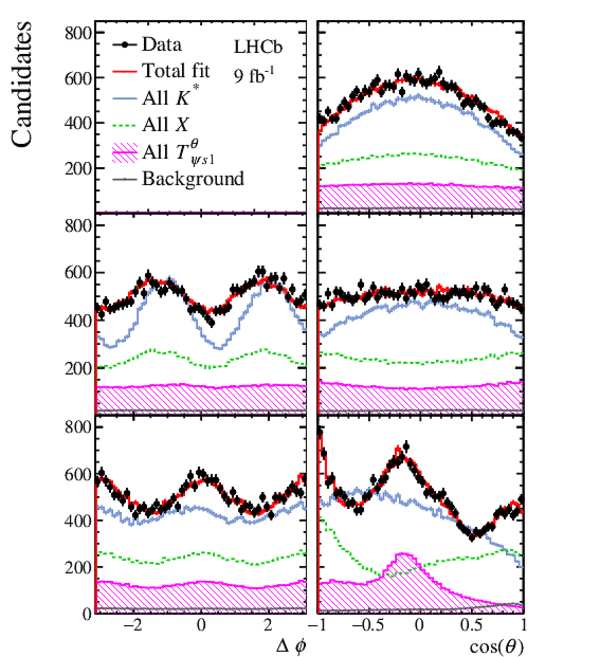
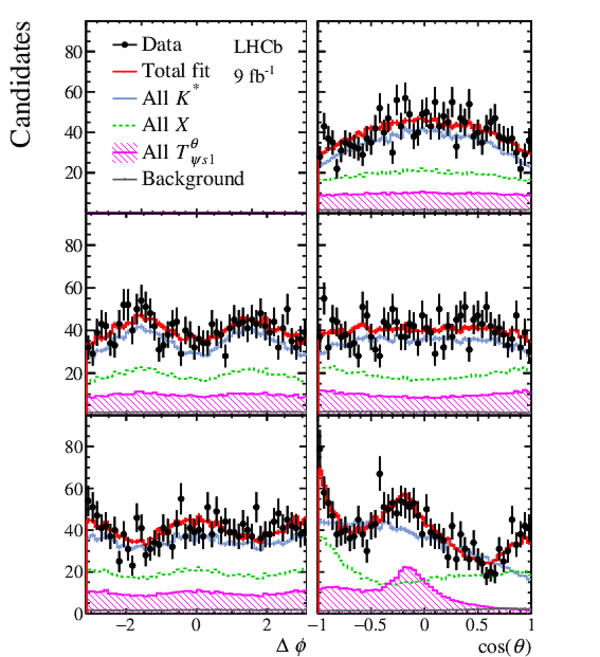
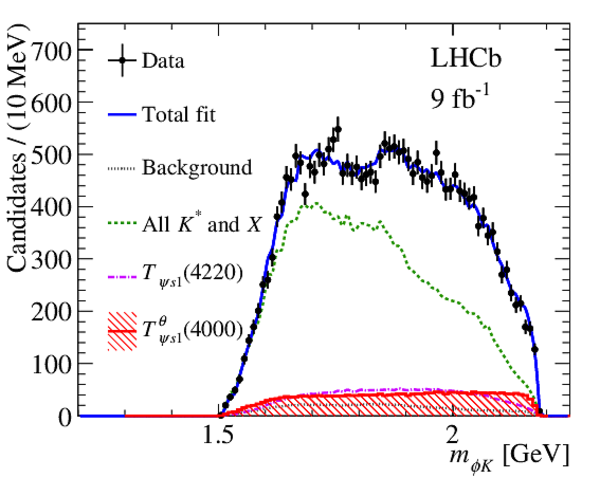
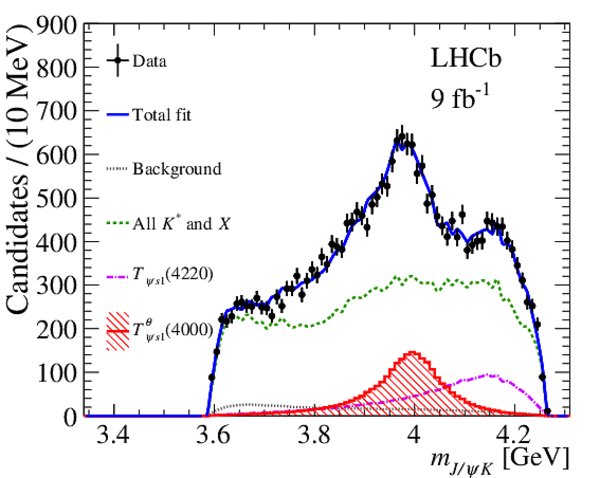
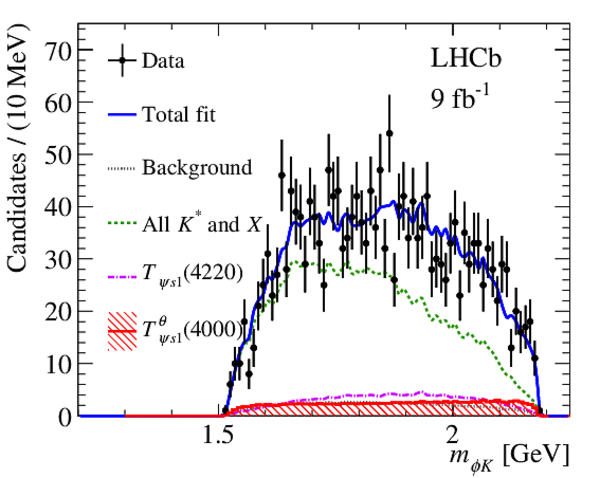
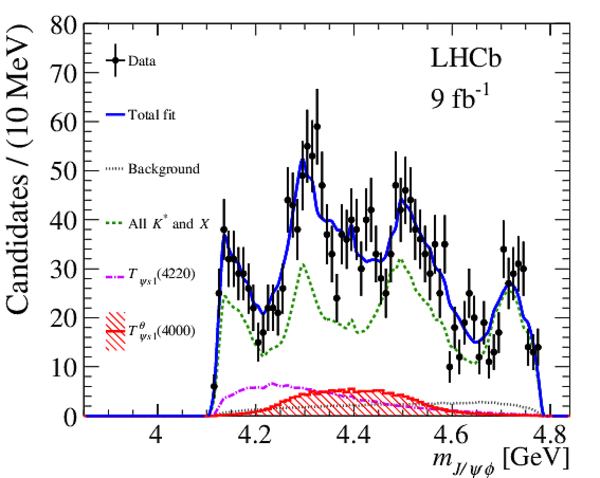
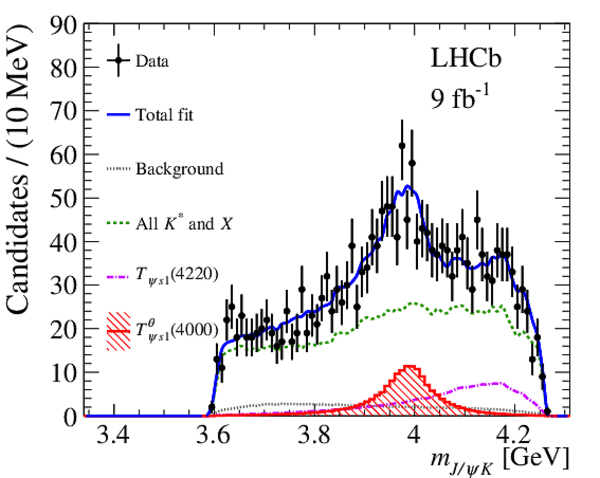
Distributions of (left) $m_{\phi K}$, (middle) $m_{ { J \mskip -3mu/\mskip -2mu\psi } \phi}$, and (right) $m_{ { J \mskip -3mu/\mskip -2mu\psi } K}$, overlaid with the corresponding projections of the default fit model. The upper and lower rows correspond to the $ B ^+ \rightarrow { J \mskip -3mu/\mskip -2mu\psi } \phi K ^+ $ and $ B ^0 \rightarrow { J \mskip -3mu/\mskip -2mu\psi } \phi K ^0_{\mathrm{S}} $ decays, respectively. |
Fig2.pdf [111 KiB] HiDef png [457 KiB] Thumbnail [275 KiB] *.C file |
|
|
Animated gif made out of all figures. |
PAPER-2022-040.gif Thumbnail |

|
Tables and captions
|
Results for the $ T_{\psi s1}^{\theta}(4000)^0$ state from the default model. The first uncertainty is statistical and the second systematic. |
Table_1.pdf [69 KiB] HiDef png [27 KiB] Thumbnail [12 KiB] tex code |

|
|
Systematic uncertainties associated to the mass, width, fit fraction of the $ T_{\psi s1}^{\theta}(4000)^0$ state, and the mass difference between the $ T_{\psi s1}^{\theta}(4000)^0$ and $ T_{\psi s1}^{\theta}(4000)^+$ states. |
Table_2.pdf [106 KiB] HiDef png [125 KiB] Thumbnail [53 KiB] tex code |

|
Supplementary Material [file]
![HiDef png [187 KiB]](Directory_LHCb-PAPER-2022-040/hidef_Fig1a.png)
![HiDef png [164 KiB]](Directory_LHCb-PAPER-2022-040/hidef_Fig1b.png)
![HiDef png [457 KiB]](Directory_LHCb-PAPER-2022-040/hidef_Fig2.png)
![HiDef png [27 KiB]](Directory_LHCb-PAPER-2022-040/hidef_Table_1.png)
![HiDef png [125 KiB]](Directory_LHCb-PAPER-2022-040/hidef_Table_2.png)
![HiDef png [727 KiB]](Directory_LHCb-PAPER-2022-040/supplementary/hidef_Fig4.png)
![HiDef png [737 KiB]](Directory_LHCb-PAPER-2022-040/supplementary/hidef_Fig5.png)
![HiDef png [334 KiB]](Directory_LHCb-PAPER-2022-040/supplementary/hidef_Fig6a.png)
![HiDef png [377 KiB]](Directory_LHCb-PAPER-2022-040/supplementary/hidef_Fig6b.png)
![HiDef png [345 KiB]](Directory_LHCb-PAPER-2022-040/supplementary/hidef_Fig6c.png)
![HiDef png [322 KiB]](Directory_LHCb-PAPER-2022-040/supplementary/hidef_Fig6d.png)
![HiDef png [350 KiB]](Directory_LHCb-PAPER-2022-040/supplementary/hidef_Fig6e.png)
![HiDef png [323 KiB]](Directory_LHCb-PAPER-2022-040/supplementary/hidef_Fig6f.png)
Created on 19 April 2024.