Search for $\it{CP}$ violation in $D_{(s)}^{+}\rightarrow K^{-}K^{+}K^{+}$ decays
[to restricted-access page]Information
LHCb-PAPER-2022-042
CERN-EP-2023-010
arXiv:2303.04062 [PDF]
(Submitted on 07 Mar 2023)
JHEP 07 (2023) 067
Inspire 2639012
Tools
Abstract
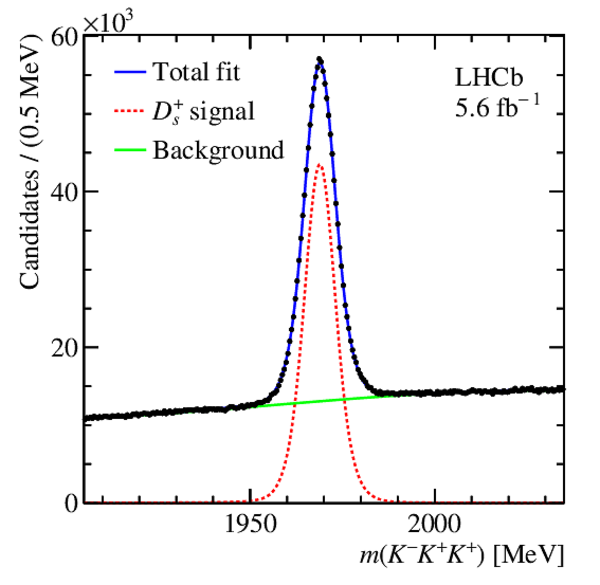
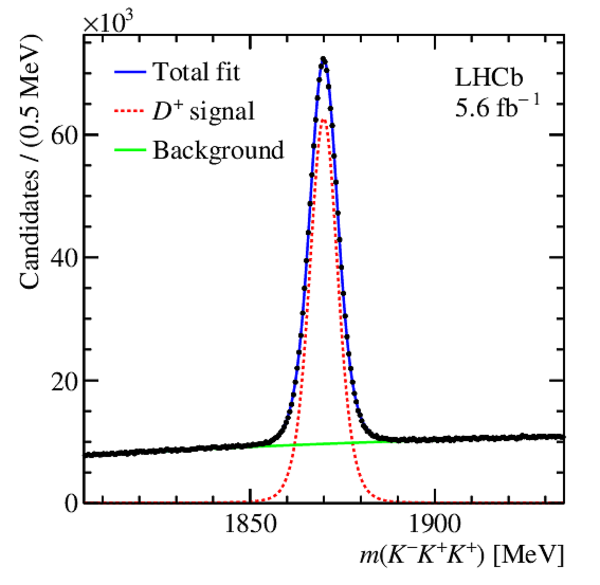
A search for direct $\it{CP}$ violation in the Cabibbo-suppressed decay $D_{s}^{+}\rightarrow K^{-}K^{+}K^{+}$ and in the doubly Cabibbo-suppressed decay $D^{+}\rightarrow K^{-}K^{+}K^{+}$ is reported. The analysis is performed with data collected by the LHCb experiment in proton-proton collisions at a centre-of-mass energy of 13 TeV corresponding to an integrated luminosity of 5.6 $\textrm{fb}^{-1}$. The search is conducted by comparing the $D^+_{(s)}$ and $D^-_{(s)}$ Dalitz-plot distributions through a model-independent binned technique, based on fits to the $K^{-}K^{+}K^{+}$ invariant-mass distributions, with a total of 0.97 (1.27) million $D_{s}^{+}$ ($D^{+}$) signal candidates. The results are given as $p$-values for the hypothesis of $\it{CP}$ conservation and are found to be 13.3 for the $D_{s}^{+}\rightarrow K^{-}K^{+}K^{+}$ decay and 31.6 for the $D^{+}\rightarrow K^{-}K^{+}K^{+}$ decay. No evidence for $\it{CP}$ violation is observed in these decays.
Figures and captions
|
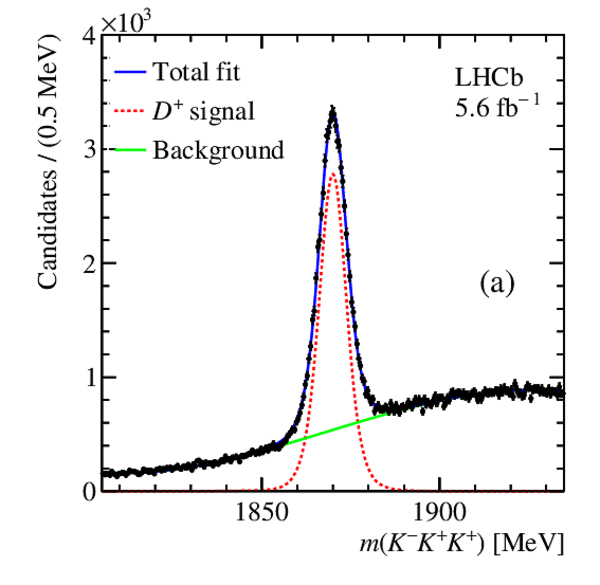
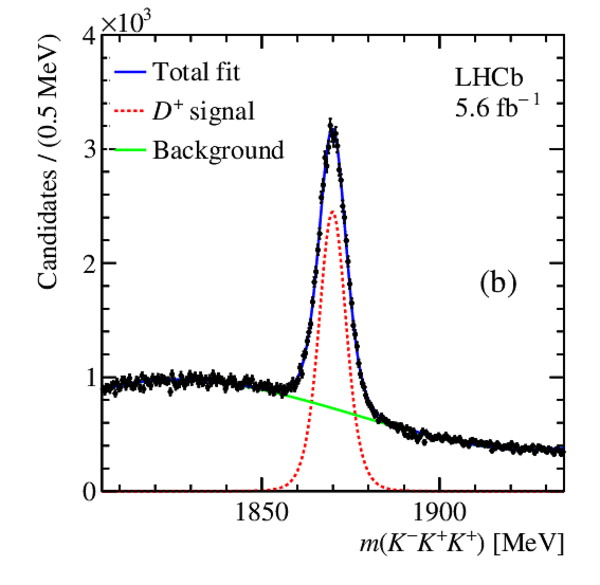
Invariant-mass distributions for (left) $ D ^+_ s \rightarrow K ^- K ^+ K ^+ $ and (right) $ D ^+ \rightarrow K ^- K ^+ K ^+ $ candidates. The data are shown as points with the fit overlaid. |
Fig1a.pdf [71 KiB] HiDef png [221 KiB] Thumbnail [177 KiB] *.C file |
|
|
Fig1b.pdf [71 KiB] HiDef png [226 KiB] Thumbnail [180 KiB] *.C file |
|
|
|
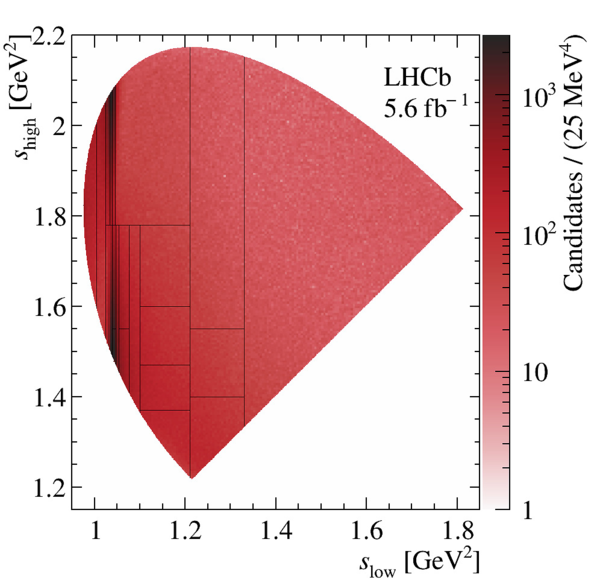
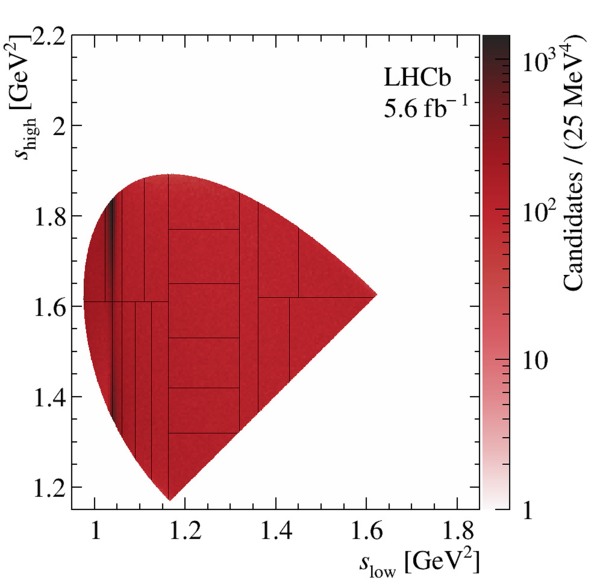
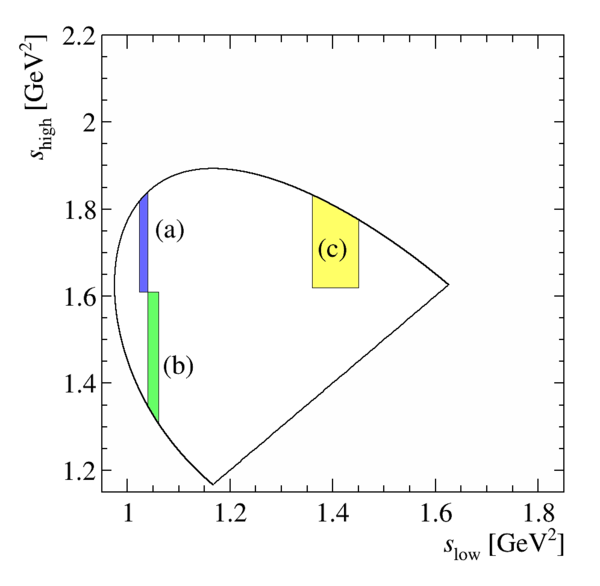
Dalitz plot distribution of (left) $ D ^+_ s \rightarrow K ^- K ^+ K ^+ $ and (right) $ D ^+ \rightarrow K ^- K ^+ K ^+ $ candidates, within a $ K ^- K ^+ K ^+ $ mass region comprising 95% of the total amount of signal candidates. The binning scheme with 21 bins is overlaid in each case. The Dalitz plots are displayed within the same ranges for $s_{\rm low}$ and $s_{\rm high}$ for a better comparison. |
Fig2a.pdf [112 KiB] HiDef png [3 MiB] Thumbnail [746 KiB] *.C file |
|
|
Fig2b.pdf [87 KiB] HiDef png [1 MiB] Thumbnail [505 KiB] *.C file |
|
|
|
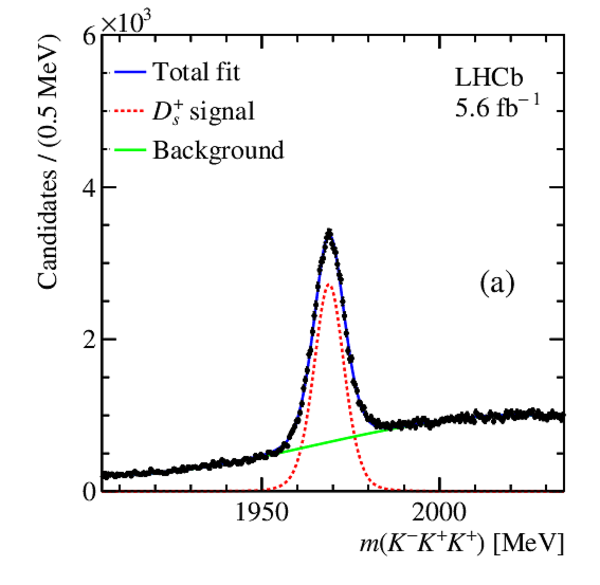
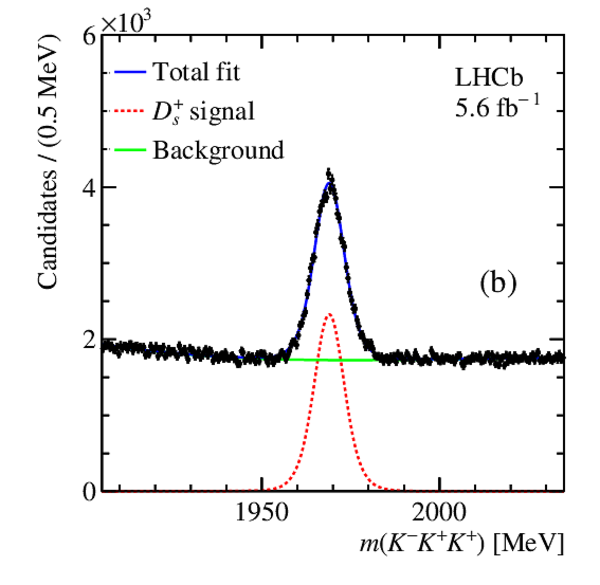
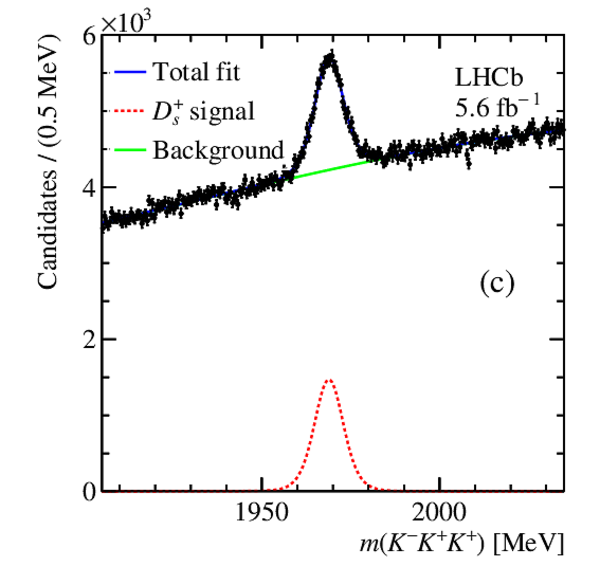
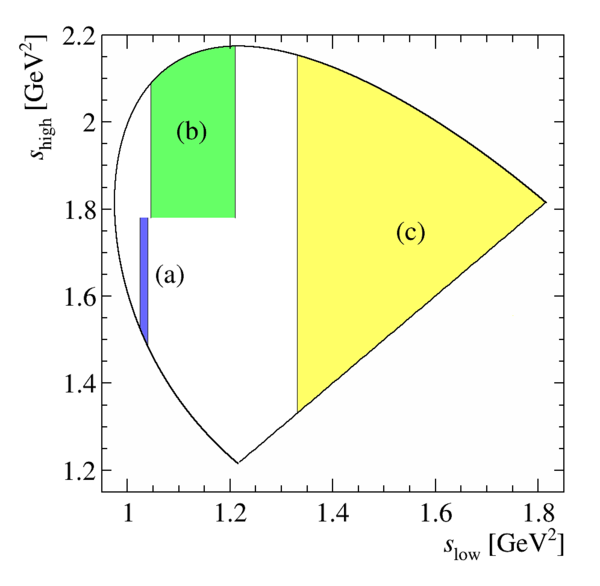
Mass distributions for the $ D ^+_ s $ candidates in three representative Dalitz plot bins (a,b,c), defined in the lower right subfigure. |
Fig3a.pdf [66 KiB] HiDef png [201 KiB] Thumbnail [168 KiB] *.C file |
|
|
Fig3b.pdf [66 KiB] HiDef png [208 KiB] Thumbnail [173 KiB] *.C file |
|
|
|
Fig3c.pdf [66 KiB] HiDef png [218 KiB] Thumbnail [185 KiB] *.C file |
|
|
|
Fig3d.pdf [51 KiB] HiDef png [234 KiB] Thumbnail [112 KiB] *.C file |
|
|
|
Mass distributions for the $ D ^+ $ candidates in three representative Dalitz plot bins (a,b,c), defined in the lower right subfigure. |
Fig4a.pdf [66 KiB] HiDef png [230 KiB] Thumbnail [188 KiB] *.C file |
|
|
Fig4b.pdf [66 KiB] HiDef png [229 KiB] Thumbnail [190 KiB] *.C file |
|
|
|
Fig4d.pdf [45 KiB] HiDef png [187 KiB] Thumbnail [99 KiB] *.C file |
|
[Failure to get the plot] |
|
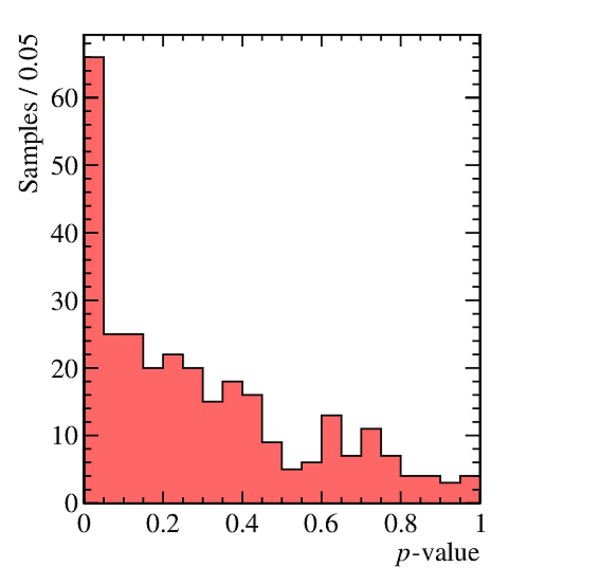
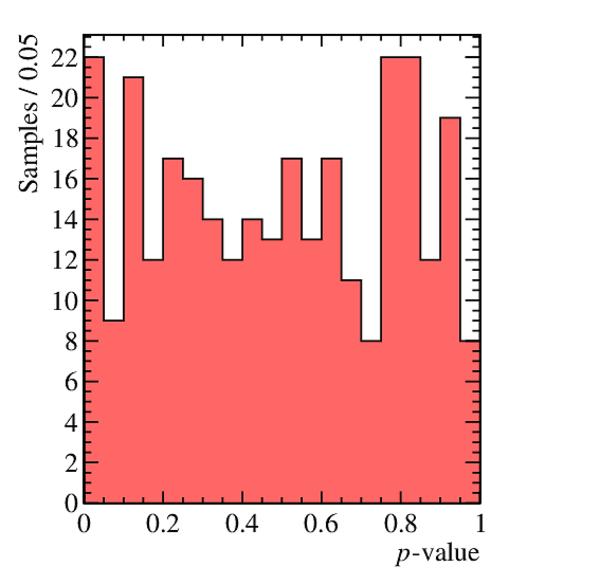
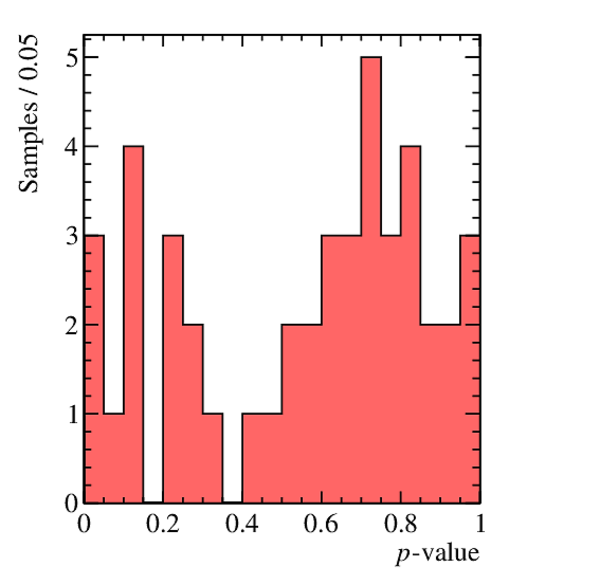
Distributions of the p-values for (left) the original Miranda method and for (right) the fit-per-bin method using 300 $ D ^+_ s \rightarrow K ^- K ^+ K ^+ $ pseudoexperiments. |
Fig5a.pdf [13 KiB] HiDef png [108 KiB] Thumbnail [103 KiB] *.C file |
|
|
Fig5b.pdf [13 KiB] HiDef png [128 KiB] Thumbnail [117 KiB] *.C file |
|
|
|
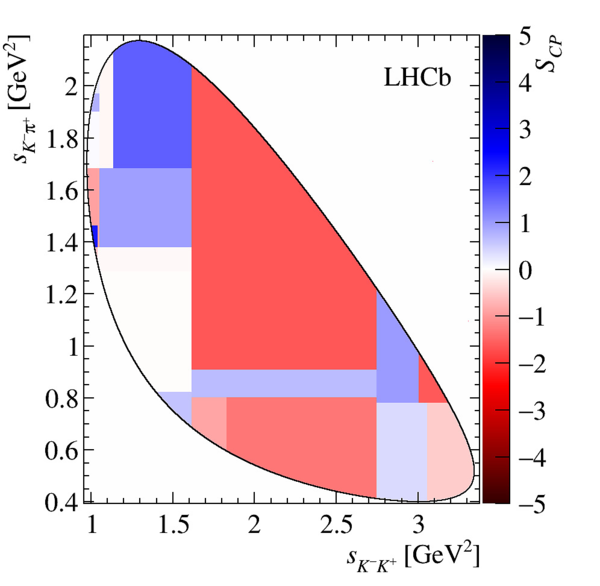
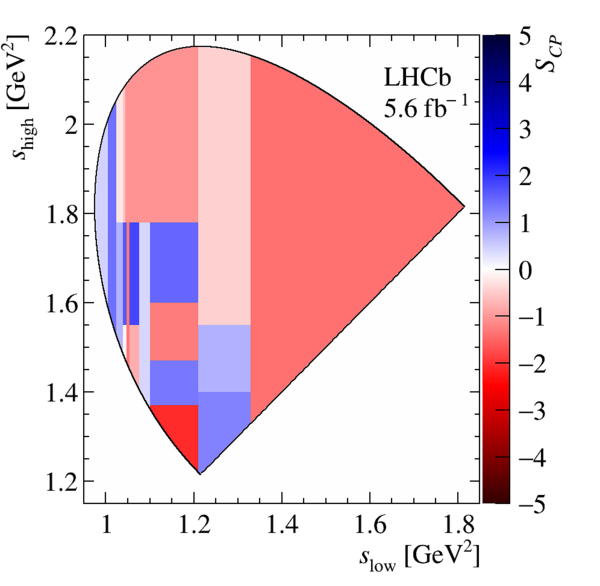
Left: Values of $\mathcal{S}_{ C P }$ for one subset of $ D ^+_ s \rightarrow K ^- K ^+ \pi ^+ $ data with $ D ^+_ s \rightarrow K ^- K ^+ K ^+ $ selection criteria. Right: Overall p-value distribution for the 45 $ D ^+_ s \rightarrow K ^- K ^+ \pi ^+ $ subsets using the scheme of 21 adaptive bins. |
Fig6a.pdf [59 KiB] HiDef png [787 KiB] Thumbnail [269 KiB] *.C file |
|
|
Fig6b.pdf [13 KiB] HiDef png [100 KiB] Thumbnail [93 KiB] *.C file |
|
|
|
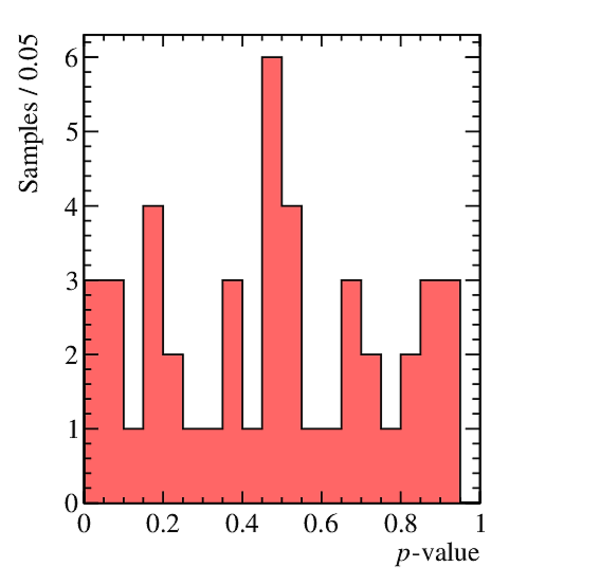
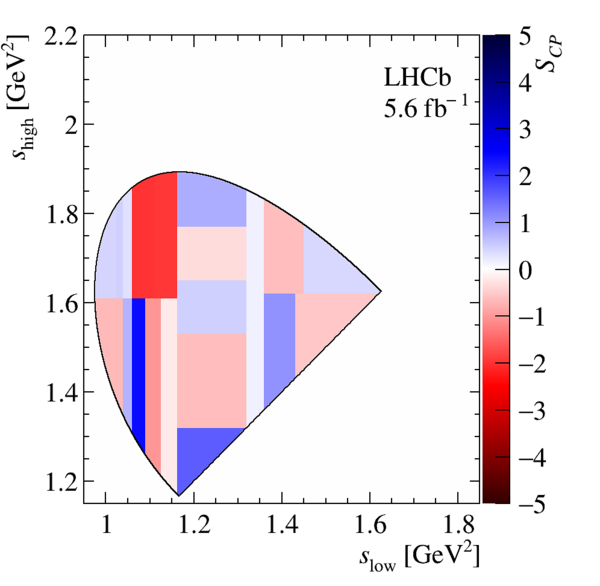
Left: Values of $\mathcal{S}_{ C P }$ distribution for one subset of $ D ^+ \rightarrow K ^- \pi ^+ \pi ^+ $ data with $ D ^+_ s \rightarrow K ^- K ^+ K ^+ $ selection criteria. Right: Overall p-value distribution for the 85 $ D ^+ \rightarrow K ^- \pi ^+ \pi ^+ $ subsets using the scheme of 21 adaptive bins. |
Fig7a.pdf [58 KiB] HiDef png [765 KiB] Thumbnail [257 KiB] *.C file |
|
|
Fig7b.pdf [13 KiB] HiDef png [100 KiB] Thumbnail [88 KiB] *.C file |
|
|
|
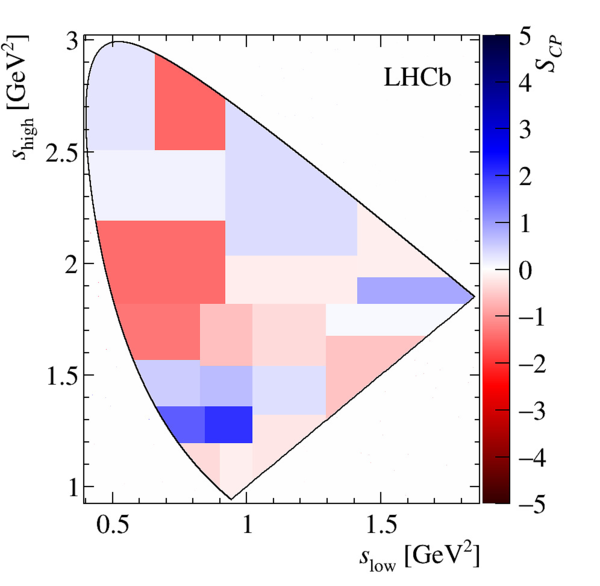
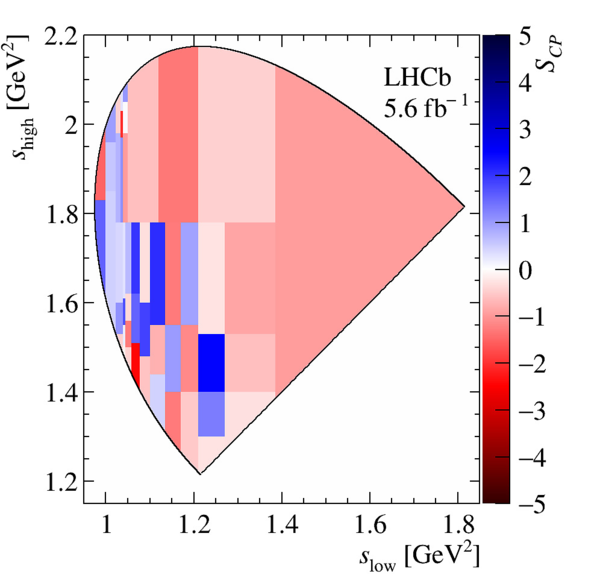
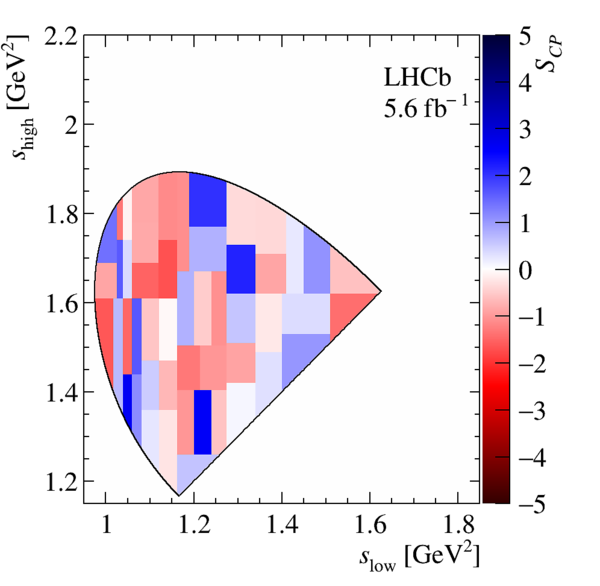
$\mathcal{S}_{ C P }$ values across the Dalitz plot for (left) $ D ^+_ s \rightarrow K ^- K ^+ K ^+ $ and (right) $ D ^+ \rightarrow K ^- K ^+ K ^+ $ signal candidates using 21 bins. |
Fig8a.pdf [61 KiB] HiDef png [320 KiB] Thumbnail [150 KiB] *.C file |
|
|
Fig8b.pdf [58 KiB] HiDef png [293 KiB] Thumbnail [140 KiB] *.C file |
|
|
|
$\mathcal{S}_{ C P }$ values across the Dalitz plot for (left) $ D ^+_ s \rightarrow K ^- K ^+ K ^+ $ and (right) {\mbox $ D ^+ \rightarrow K ^- K ^+ K ^+ $ } signal candidates for the alternative binning scheme with 50 bins. |
Fig9a.pdf [63 KiB] HiDef png [789 KiB] Thumbnail [264 KiB] *.C file |
|
|
Fig9b.pdf [60 KiB] HiDef png [305 KiB] Thumbnail [145 KiB] *.C file |
|
|
|
Animated gif made out of all figures. |
PAPER-2022-042.gif Thumbnail |

|
![HiDef png [221 KiB]](Directory_LHCb-PAPER-2022-042/hidef_Fig1a.png)
![HiDef png [226 KiB]](Directory_LHCb-PAPER-2022-042/hidef_Fig1b.png)
![HiDef png [3 MiB]](Directory_LHCb-PAPER-2022-042/hidef_Fig2a.png)
![HiDef png [1 MiB]](Directory_LHCb-PAPER-2022-042/hidef_Fig2b.png)
![HiDef png [201 KiB]](Directory_LHCb-PAPER-2022-042/hidef_Fig3a.png)
![HiDef png [208 KiB]](Directory_LHCb-PAPER-2022-042/hidef_Fig3b.png)
![HiDef png [218 KiB]](Directory_LHCb-PAPER-2022-042/hidef_Fig3c.png)
![HiDef png [234 KiB]](Directory_LHCb-PAPER-2022-042/hidef_Fig3d.png)
![HiDef png [230 KiB]](Directory_LHCb-PAPER-2022-042/hidef_Fig4a.png)
![HiDef png [229 KiB]](Directory_LHCb-PAPER-2022-042/hidef_Fig4b.png)
![HiDef png [187 KiB]](Directory_LHCb-PAPER-2022-042/hidef_Fig4d.png)
![HiDef png [108 KiB]](Directory_LHCb-PAPER-2022-042/hidef_Fig5a.png)
![HiDef png [128 KiB]](Directory_LHCb-PAPER-2022-042/hidef_Fig5b.png)
![HiDef png [787 KiB]](Directory_LHCb-PAPER-2022-042/hidef_Fig6a.png)
![HiDef png [100 KiB]](Directory_LHCb-PAPER-2022-042/hidef_Fig6b.png)
![HiDef png [765 KiB]](Directory_LHCb-PAPER-2022-042/hidef_Fig7a.png)
![HiDef png [100 KiB]](Directory_LHCb-PAPER-2022-042/hidef_Fig7b.png)
![HiDef png [320 KiB]](Directory_LHCb-PAPER-2022-042/hidef_Fig8a.png)
![HiDef png [293 KiB]](Directory_LHCb-PAPER-2022-042/hidef_Fig8b.png)
![HiDef png [789 KiB]](Directory_LHCb-PAPER-2022-042/hidef_Fig9a.png)
![HiDef png [305 KiB]](Directory_LHCb-PAPER-2022-042/hidef_Fig9b.png)
Tables and captions
|
Dalitz-integrated $ D ^+_{( s )} $ and $ D ^-_{( s )} $ signal yields and resulting values of $\alpha$. |
Table_1.pdf [71 KiB] HiDef png [44 KiB] Thumbnail [23 KiB] tex code |

|
![HiDef png [44 KiB]](Directory_LHCb-PAPER-2022-042/hidef_Table_1.png)
Created on 13 April 2024.