Information
LHCb-PAPER-2022-050
CERN-EP-2023-007
arXiv:2302.08262 [PDF]
(Submitted on 16 Feb 2023)
Phys. Rev. Lett. 131 (2023) 151801
Inspire 2633007
Tools
Abstract
The branching fraction of the rare decay $\Lambda_{b}^{0}\to \Lambda(1520) \mu^{+}\mu^{-}$ is measured for the first time, in the squared dimuon mass intervals, $q^2$, excluding the $J/\psi$ and $\psi(2S)$ regions. The data sample analyzed was collected by the LHCb experiment at center-of-mass energies of 7, 8, and 13 TeV, corresponding to a total integrated luminosity of $9\ \mathrm{fb}^{-1}$. The result in the highest $q^{2}$ interval, $q^{2} >15.0\ \mathrm{GeV}^2/c^4$, where theoretical predictions have the smallest model dependence, agrees with the predictions.
Figures and captions
|
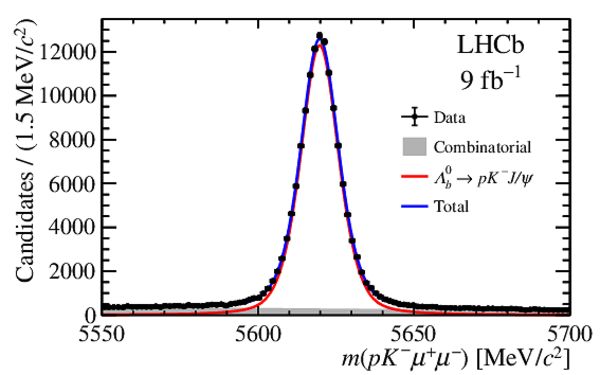
Mass distribution for the (left) $\Lambda ^0_ b \rightarrow p K ^- J/\psi $ and (right) $\Lambda ^0_ b \rightarrow p K ^- \mu ^+\mu ^- $ , integrated over the considered $ q^2$ intervals. Fit results are overlaid. |
Fig1a.pdf [36 KiB] HiDef png [207 KiB] Thumbnail [174 KiB] *.C file |
|
|
Fig1b.pdf [21 KiB] HiDef png [230 KiB] Thumbnail [191 KiB] *.C file |

|
|
|
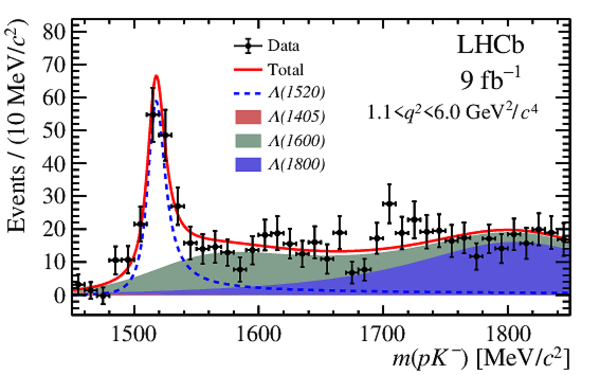
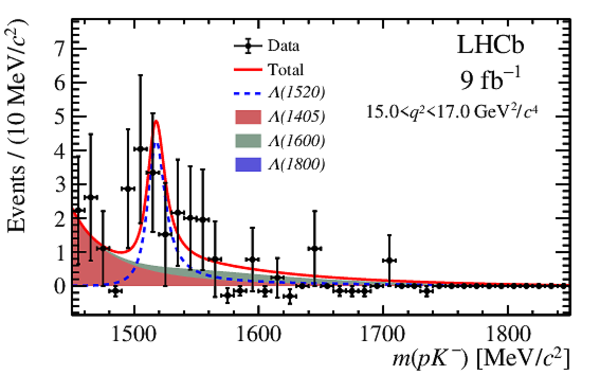
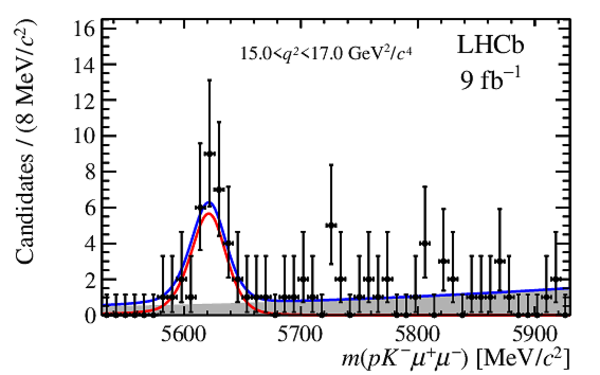
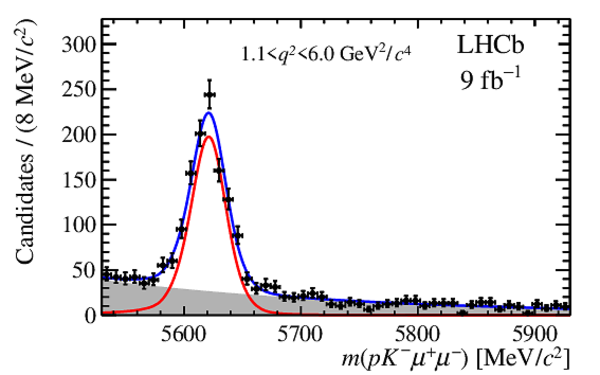
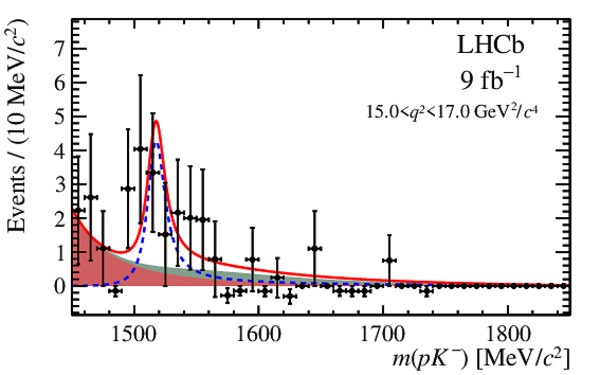
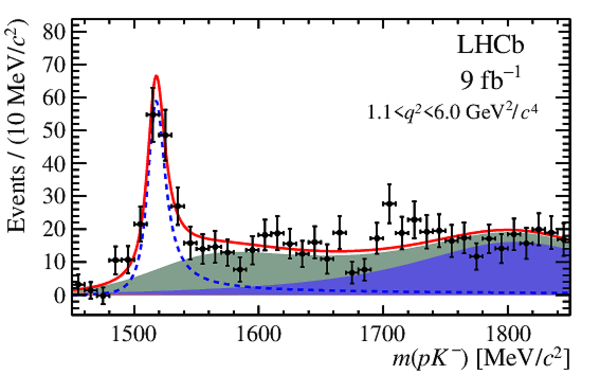
Distribution of the $ p K ^- $ mass, after background subtraction, for $\Lambda ^0_ b \rightarrow \Lambda(1520) \mu ^+\mu ^- $ signal candidates in the (left) $1.1< q^2 <6.0\text{ Ge V} ^2 /c^4 $ and (right) $15.0< q^2 <17.0\text{ Ge V} ^2 /c^4 $ regions. Fit results are overlaid. |
Fig2a.pdf [22 KiB] HiDef png [311 KiB] Thumbnail [247 KiB] *.C file |
|
|
Fig2b.pdf [20 KiB] HiDef png [247 KiB] Thumbnail [201 KiB] *.C file |
|
|
|
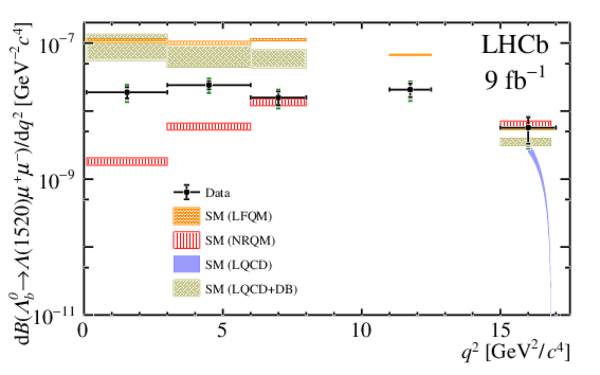
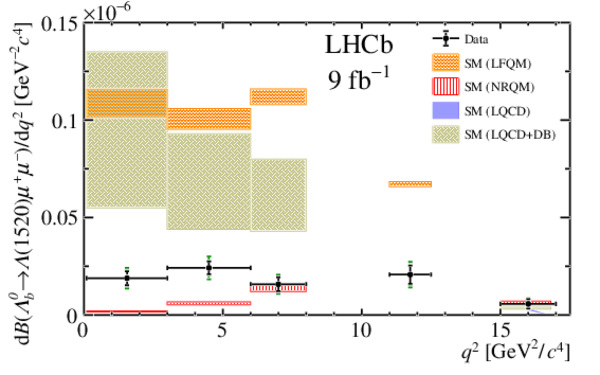
Differential branching fraction of the $\Lambda ^0_ b \rightarrow \Lambda(1520) \mu ^+\mu ^- $ decay in intervals of $ q^2$ . The error bars in black, gray and green represent the measured results with statistical, systematic and $\mathcal{B}(\Lambda ^0_ b \rightarrow p K ^- J/\psi )$ uncertainties taken into account. Also shown are the SM predictions using the form factors calculated with the nonrelativistic quark model (NRQM) [62], light-front quark model (LFQM) [63], joint lattice QCD and dispersive bound (LQCD+DB) [64] and lattice QCD (LQCD) [65]. Note that the LQCD prediction is only available for $ q^2 $ above $16\text{ Ge V} ^2 /c^4 $, and the trend instead of a rate average is shown. These theoretical predictions as well as evaluation of the corresponding uncertainties should be revisited given their significant differences. |
Fig3.pdf [16 KiB] HiDef png [309 KiB] Thumbnail [180 KiB] *.C file |
|
|
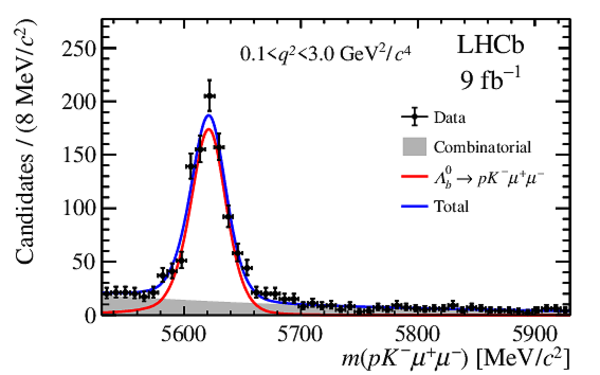
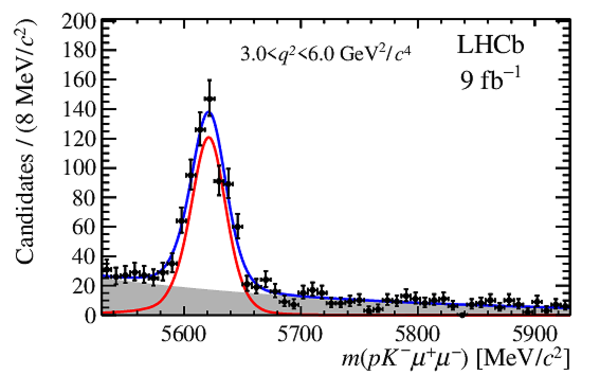
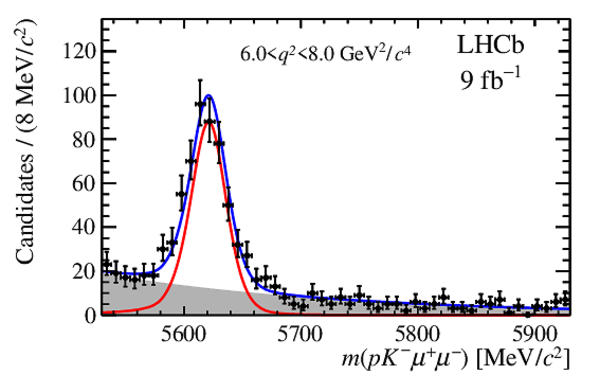
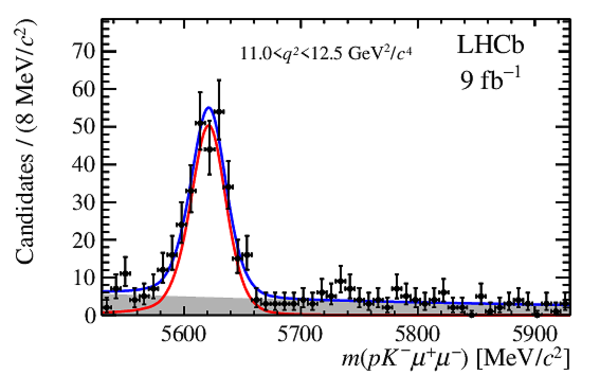
Mass distributions of the $\Lambda ^0_ b \rightarrow p K ^- \mu ^+\mu ^- $ signal candidates in different $ q^2$ intervals. The data are overlaid with the fit projections. |
Fig4a.pdf [21 KiB] HiDef png [224 KiB] Thumbnail [190 KiB] *.C file |
|
|
Fig4b.pdf [21 KiB] HiDef png [235 KiB] Thumbnail [204 KiB] *.C file |
|
|
|
Fig4c.pdf [21 KiB] HiDef png [228 KiB] Thumbnail [191 KiB] *.C file |
|
|
|
Fig4d.pdf [21 KiB] HiDef png [227 KiB] Thumbnail [195 KiB] *.C file |
|
|
|
Fig4e.pdf [20 KiB] HiDef png [211 KiB] Thumbnail [186 KiB] *.C file |
|
|
|
Fig4f.pdf [21 KiB] HiDef png [216 KiB] Thumbnail [185 KiB] *.C file |
|
|
|
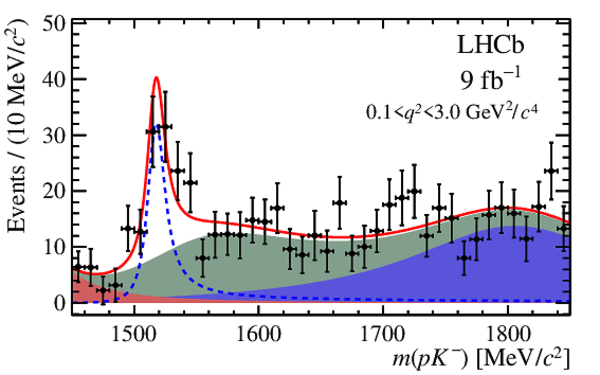
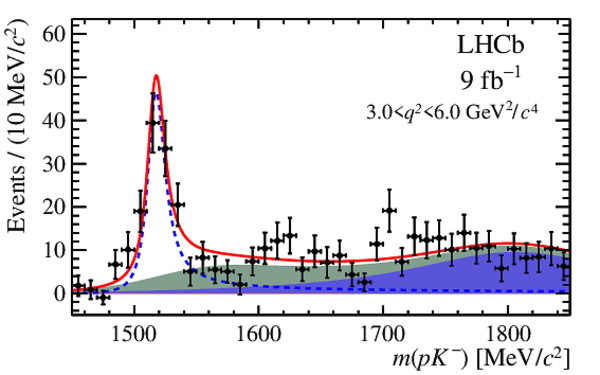
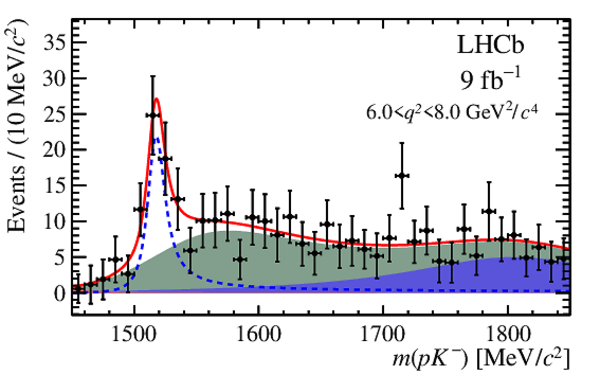
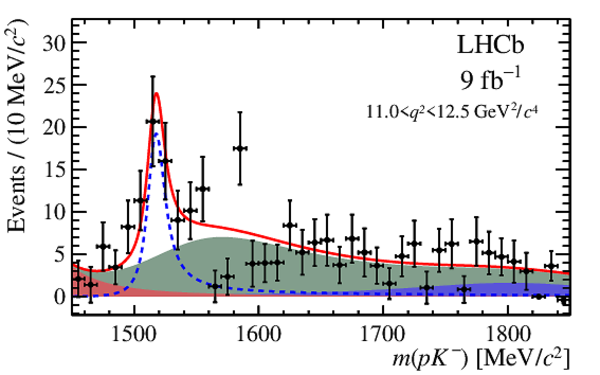
Distribution of $ p K ^- $ mass, after background subtraction, for the $\Lambda ^0_ b \rightarrow \Lambda(1520) \mu ^+\mu ^- $ signal candidates in intervals of $ q^2$ . Distributions are overlaid with the fit projections. |
Fig5a.pdf [21 KiB] HiDef png [295 KiB] Thumbnail [226 KiB] *.C file |
|
|
Fig5b.pdf [21 KiB] HiDef png [272 KiB] Thumbnail [210 KiB] *.C file |
|
|
|
Fig5c.pdf [21 KiB] HiDef png [279 KiB] Thumbnail [221 KiB] *.C file |
|
|
|
Fig5d.pdf [21 KiB] HiDef png [277 KiB] Thumbnail [211 KiB] *.C file |
|
|
|
Fig5e.pdf [20 KiB] HiDef png [220 KiB] Thumbnail [176 KiB] *.C file |
|
|
|
Fig5f.pdf [21 KiB] HiDef png [285 KiB] Thumbnail [223 KiB] *.C file |
|
|
|
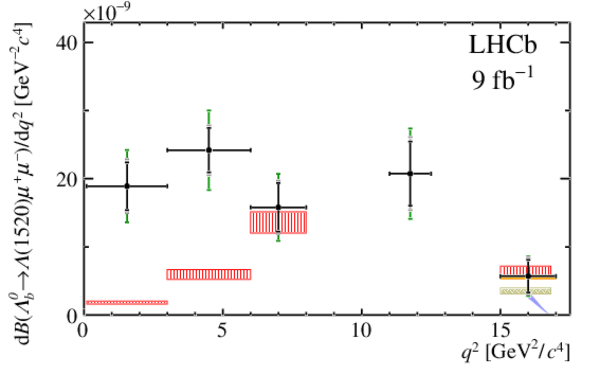
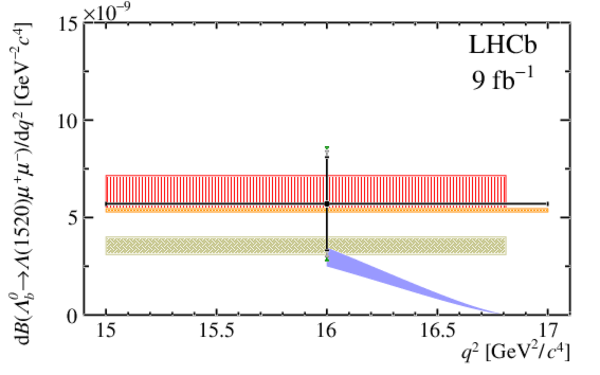
Comparison between data and SM predictions. Note that the LQCD prediction is only available for $ q^2 $ above $16\text{ Ge V} ^2 /c^4 $, and the trend instead of a rate average is shown. |
Fig6a.pdf [16 KiB] HiDef png [731 KiB] Thumbnail [313 KiB] *.C file |
|
|
Fig6b.pdf [15 KiB] HiDef png [138 KiB] Thumbnail [104 KiB] *.C file |
|
|
|
Fig6c.pdf [15 KiB] HiDef png [300 KiB] Thumbnail [158 KiB] *.C file |
|
|
|
Animated gif made out of all figures. |
PAPER-2022-050.gif Thumbnail |

|
![HiDef png [207 KiB]](Directory_LHCb-PAPER-2022-050/hidef_Fig1a.png)
![HiDef png [230 KiB]](Directory_LHCb-PAPER-2022-050/hidef_Fig1b.png)
![HiDef png [311 KiB]](Directory_LHCb-PAPER-2022-050/hidef_Fig2a.png)
![HiDef png [247 KiB]](Directory_LHCb-PAPER-2022-050/hidef_Fig2b.png)
![HiDef png [309 KiB]](Directory_LHCb-PAPER-2022-050/hidef_Fig3.png)
![HiDef png [224 KiB]](Directory_LHCb-PAPER-2022-050/hidef_Fig4a.png)
![HiDef png [235 KiB]](Directory_LHCb-PAPER-2022-050/hidef_Fig4b.png)
![HiDef png [228 KiB]](Directory_LHCb-PAPER-2022-050/hidef_Fig4c.png)
![HiDef png [227 KiB]](Directory_LHCb-PAPER-2022-050/hidef_Fig4d.png)
![HiDef png [211 KiB]](Directory_LHCb-PAPER-2022-050/hidef_Fig4e.png)
![HiDef png [216 KiB]](Directory_LHCb-PAPER-2022-050/hidef_Fig4f.png)
![HiDef png [295 KiB]](Directory_LHCb-PAPER-2022-050/hidef_Fig5a.png)
![HiDef png [272 KiB]](Directory_LHCb-PAPER-2022-050/hidef_Fig5b.png)
![HiDef png [279 KiB]](Directory_LHCb-PAPER-2022-050/hidef_Fig5c.png)
![HiDef png [277 KiB]](Directory_LHCb-PAPER-2022-050/hidef_Fig5d.png)
![HiDef png [220 KiB]](Directory_LHCb-PAPER-2022-050/hidef_Fig5e.png)
![HiDef png [285 KiB]](Directory_LHCb-PAPER-2022-050/hidef_Fig5f.png)
![HiDef png [731 KiB]](Directory_LHCb-PAPER-2022-050/hidef_Fig6a.png)
![HiDef png [138 KiB]](Directory_LHCb-PAPER-2022-050/hidef_Fig6b.png)
![HiDef png [300 KiB]](Directory_LHCb-PAPER-2022-050/hidef_Fig6c.png)
Tables and captions
|
Relative systematic uncertainties [in %] of the differential branching fraction ratio measurement. The total uncertainty is obtained as the quadratic sum of the individual contributions. |
Table_1.pdf [73 KiB] HiDef png [70 KiB] Thumbnail [31 KiB] tex code |

|
|
Signal yields and the absolute differential branching fraction, in bins of $ q^2 $, for the $\Lambda ^0_ b \rightarrow \Lambda(1520) \mu ^+\mu ^- $ decay. The first uncertainty is statistical, the second systematic, and the third due to the uncertainty on the $\Lambda ^0_ b \rightarrow p K ^- J/\psi $ and $ { J \mskip -3mu/\mskip -2mu\psi } \rightarrow \mu^+\mu^-$ branching fractions. |
Table_2.pdf [84 KiB] HiDef png [52 KiB] Thumbnail [25 KiB] tex code |

|
![HiDef png [70 KiB]](Directory_LHCb-PAPER-2022-050/hidef_Table_1.png)
![HiDef png [52 KiB]](Directory_LHCb-PAPER-2022-050/hidef_Table_2.png)
Created on 13 April 2024.