Measurement of the mass difference and relative production rate of the $\Omega^-_b$ and $\Xi^-_b$ baryons
[to restricted-access page]Information
LHCb-PAPER-2022-053
CERN-EP-2023-086
arXiv:2305.15329 [PDF]
(Submitted on 24 May 2023)
Phys. Rev. D108 (2023) 052008
Inspire 2662328
Tools
Abstract
The mass difference between the $\Omega^-_b$ and $\Xi^-_b$ baryons is measured using proton-proton collision data collected by the LHCb experiment, corresponding to an integrated luminosity of $9 \text{fb}^{-1}$, and is found to be \begin{equation} m(\Omega^-_b)- m(\Xi^-_b) = 248.54 \pm 0.51 \text{(stat)} \pm 0.38 \text{(syst)} \text{MeV}/c^2. \end{equation} The mass of the $\Omega^-_b$ baryon is measured to be \begin{equation} m(\Omega^-_b)= 6045.9 \pm 0.5 \text{(stat)} \pm 0.6 \text{(syst)} \text{MeV}/c^2. \end{equation} This is the most precise determination of the $\Omega^-_b$ mass to date. In addition, the production rate of $\Omega^-_b$ baryons relative to that of $\Xi^-_b$ baryons is measured for the first time in $pp$ collisions, using an LHCb dataset collected at a center-of-mass energy of $13 \text{TeV}$ and corresponding to an integrated luminosity of $6 \text{fb}^{-1}$. Reconstructing beauty baryons in the kinematic region $2 < \eta < 6$ and $p_T < 20 \text{GeV}/c$ with their decays to a $J/\psi$ meson and a hyperon, the ratio \begin{equation} \frac{f_{\Omega^-_b}}{f_{\Xi^-_b}}\times\frac{\mathcal{B}(\Omega^-_b \to J/\psi \Omega^-)}{\mathcal{B}(\Xi^-_b \to J/\psi \Xi^-)} = 0.120 \pm 0.008 \text{(stat)} \pm 0.008 \text{(syst)}, \end{equation} is obtained, where $f_{\Omega^-_b}$ and $f_{\Xi^-_b}$ are the fragmentation fractions of $b$ quarks into $\Omega^-_b$ and $\Xi^-_b$ baryons, respectively, and $\mathcal{B}$ represents the branching fractions of their respective decays.
Figures and captions
|
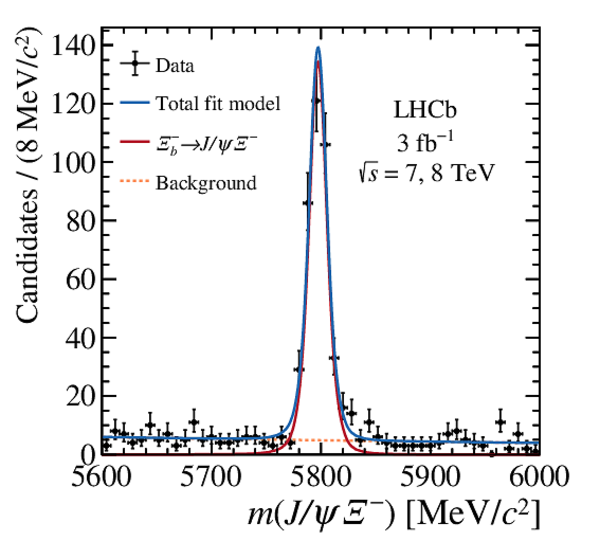
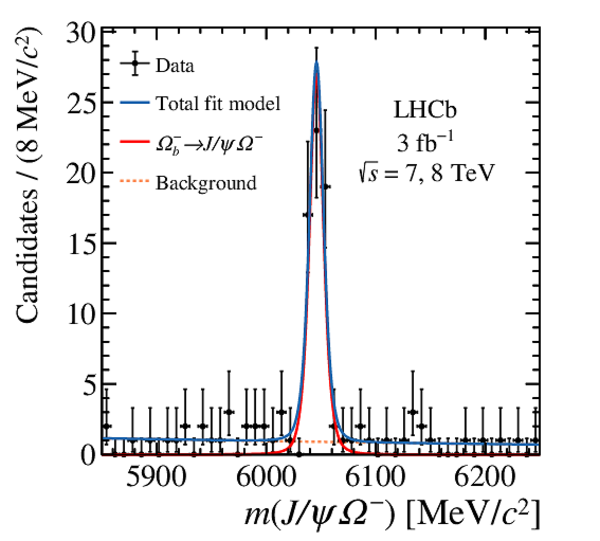
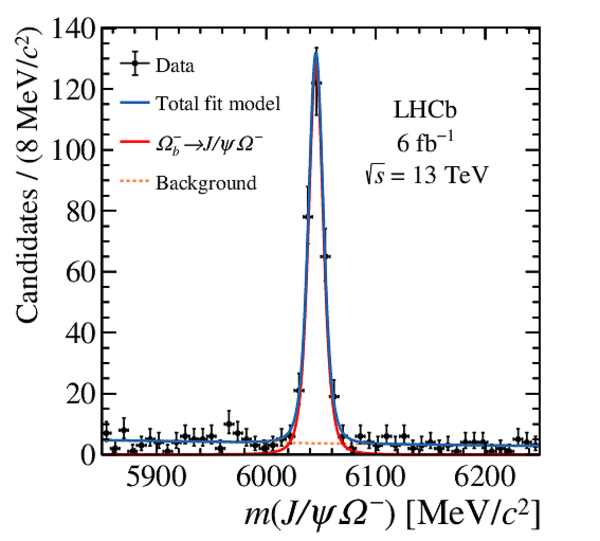
Invariant-mass distributions in the (top row) $\Xi ^-_b \rightarrow { J \mskip -3mu/\mskip -2mu\psi } \Xi ^-$ and (bottom row) $\Omega ^-_b \rightarrow { J \mskip -3mu/\mskip -2mu\psi } \Omega ^- $ datasets, in the (left column) Run 1 and (right column) Run 2 data-taking periods. The results of the simultaneous fit used for the mass-difference measurement are overlaid. |
Fig1a.pdf [20 KiB] HiDef png [347 KiB] Thumbnail [254 KiB] *.C file |
|
|
Fig1b.pdf [20 KiB] HiDef png [349 KiB] Thumbnail [251 KiB] *.C file |

|
|
|
Fig1c.pdf [20 KiB] HiDef png [323 KiB] Thumbnail [240 KiB] *.C file |
|
|
|
Fig1d.pdf [20 KiB] HiDef png [323 KiB] Thumbnail [239 KiB] *.C file |
|
|
|
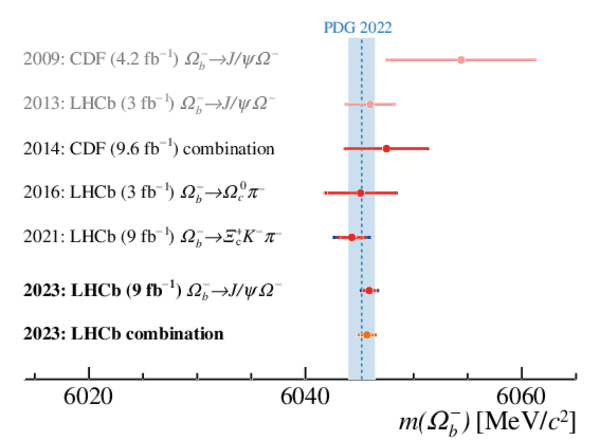
Overview of the $\Omega ^-_ b $ mass measurements to date (red points) [3,4,5,6,7], with corresponding statistical and systematic uncertainties marked in red and blue, respectively, as well as the current world average by the PDG [1] (light-blue band). The superseded measurements are shown with lighter colors. The measurement by the DØ experiment [2] of $6165 \pm 22\text{ Me V /}c^2 $ is not shown, because it is inconsistent with all others and falls outside the range of this plot. The new LHCb combination is presented in orange, where the total uncertainty is shown. |
Fig2.pdf [14 KiB] HiDef png [265 KiB] Thumbnail [194 KiB] *.C file |
|
|
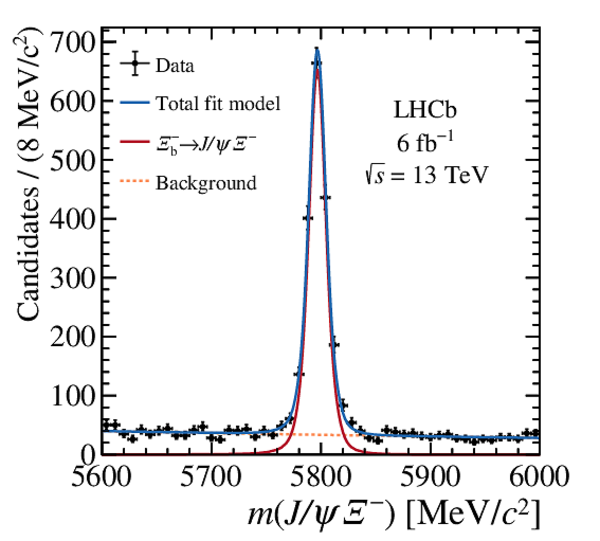
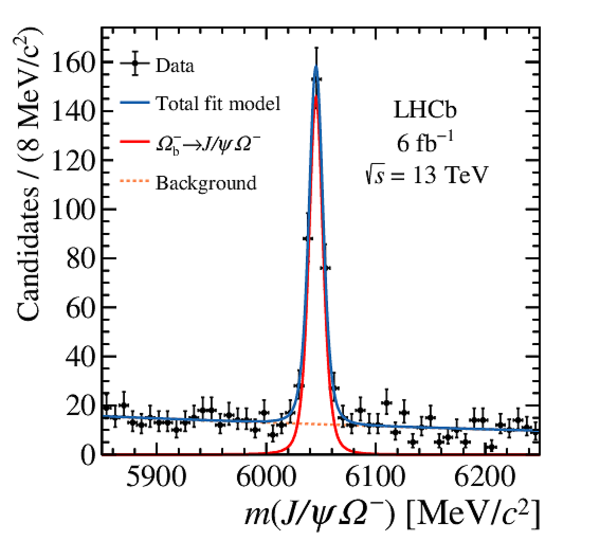
Invariant-mass distributions in the (left) $\Xi ^-_b \rightarrow { J \mskip -3mu/\mskip -2mu\psi } \Xi ^-$ and (right) $\Omega ^-_b \rightarrow { J \mskip -3mu/\mskip -2mu\psi } \Omega ^- $ Run 2 datasets with the results of the simultaneous fit overlaid used for the relative production estimation. In the $\Omega ^-_b \rightarrow { J \mskip -3mu/\mskip -2mu\psi } \Omega ^- $ dataset a $\Xi ^-$ mass veto is applied rather than the kaon identification requirement. |
Fig3a.pdf [20 KiB] HiDef png [349 KiB] Thumbnail [251 KiB] *.C file |
|
|
Fig3b.pdf [20 KiB] HiDef png [339 KiB] Thumbnail [257 KiB] *.C file |
|
|
|
Animated gif made out of all figures. |
PAPER-2022-053.gif Thumbnail |

|
![HiDef png [347 KiB]](Directory_LHCb-PAPER-2022-053/hidef_Fig1a.png)
![HiDef png [349 KiB]](Directory_LHCb-PAPER-2022-053/hidef_Fig1b.png)
![HiDef png [323 KiB]](Directory_LHCb-PAPER-2022-053/hidef_Fig1c.png)
![HiDef png [323 KiB]](Directory_LHCb-PAPER-2022-053/hidef_Fig1d.png)
![HiDef png [265 KiB]](Directory_LHCb-PAPER-2022-053/hidef_Fig2.png)
![HiDef png [349 KiB]](Directory_LHCb-PAPER-2022-053/hidef_Fig3a.png)
![HiDef png [339 KiB]](Directory_LHCb-PAPER-2022-053/hidef_Fig3b.png)
Tables and captions
|
Obtained values of signal yields from the fit to data. |
Table_1.pdf [60 KiB] HiDef png [58 KiB] Thumbnail [27 KiB] tex code |

|
|
Systematic uncertainties on the mass-difference measurement. The total systematic uncertainty is obtained by summing all sources in quadrature. |
Table_2.pdf [63 KiB] HiDef png [70 KiB] Thumbnail [31 KiB] tex code |

|
|
Efficiencies obtained from the simulated samples of $\Omega ^-_b \rightarrow { J \mskip -3mu/\mskip -2mu\psi } \Omega ^- $ and $\Xi ^-_b \rightarrow { J \mskip -3mu/\mskip -2mu\psi } \Xi ^-$ decays in Run 2, used to extract the ratio $R$. The uncertainties shown in this table only account for the size of the simulated samples. |
Table_3.pdf [67 KiB] HiDef png [61 KiB] Thumbnail [28 KiB] tex code |

|
|
Relative systematic uncertainties on $R$. |
Table_4.pdf [48 KiB] HiDef png [95 KiB] Thumbnail [41 KiB] tex code |

|
![HiDef png [58 KiB]](Directory_LHCb-PAPER-2022-053/hidef_Table_1.png)
![HiDef png [70 KiB]](Directory_LHCb-PAPER-2022-053/hidef_Table_2.png)
![HiDef png [61 KiB]](Directory_LHCb-PAPER-2022-053/hidef_Table_3.png)
![HiDef png [95 KiB]](Directory_LHCb-PAPER-2022-053/hidef_Table_4.png)
Created on 26 April 2024.