Search for prompt production of pentaquarks in open charm hadron final states
[to restricted-access page]Information
LHCb-PAPER-2023-018
CERN-EP-2024-071
arXiv:2404.07131 [PDF]
(Submitted on 10 Apr 2024)
PRD
Inspire 2775803
Tools
Abstract
A search for hidden-charm pentaquark states decaying to a range of $\Sigma_{c}\bar{D}$ and $\Lambda_{c}\bar{D}$ final states, as well as doubly-charmed pentaquark states to $\Sigma_{c}D$ and $\Lambda_{c}^{+}D$, is made using samples of proton-proton collision data corresponding to an integrated luminosity of $5.7fb^{-1}$ recorded by the LHCb detector at $\sqrt{s} = 13Te V$. Since no significant signals are found, upper limits are set on the pentaquark yields relative to that of the $\Lambda_{c}^{+}$ baryon in the $\Lambda_{c}^{+}\to pK^{-}\pi^{+}$ decay mode. The known pentaquark states are also investigated, and their signal yields are found to be consistent with zero in all cases.
Figures and captions
|
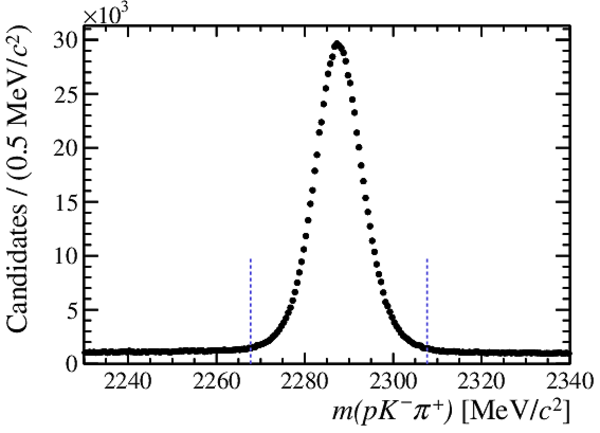
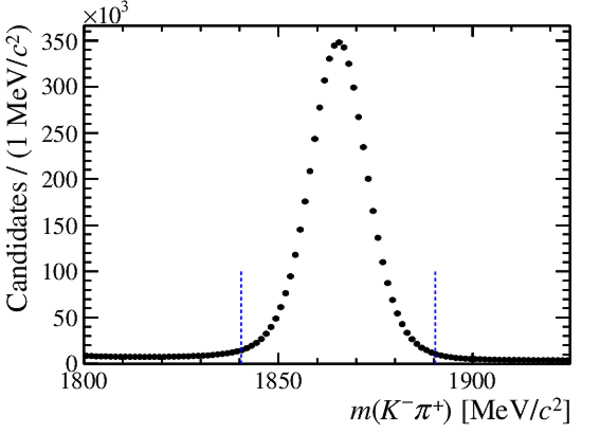
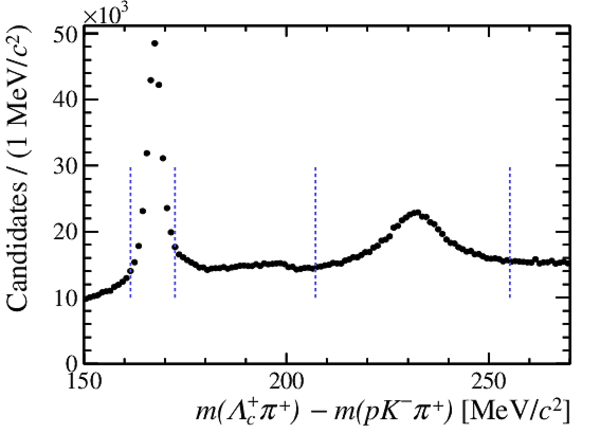
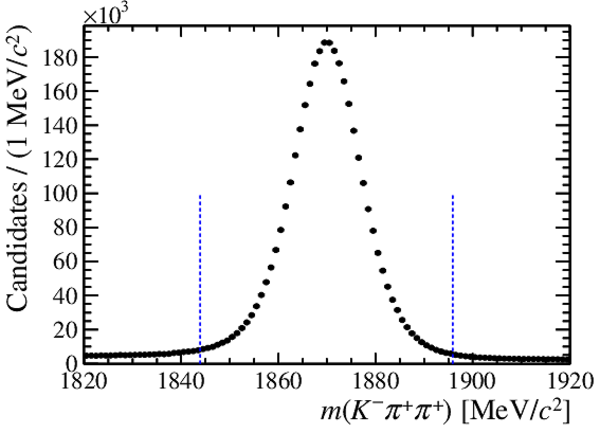
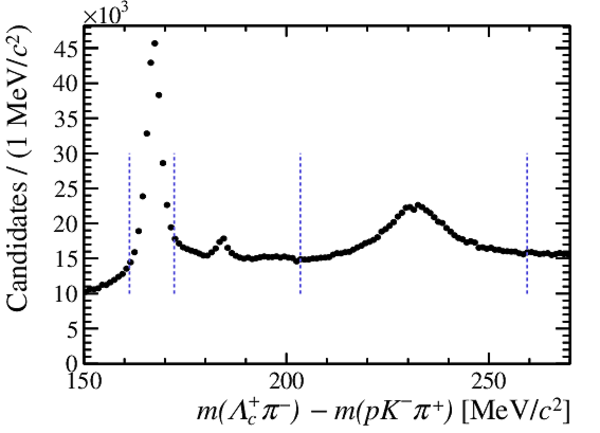
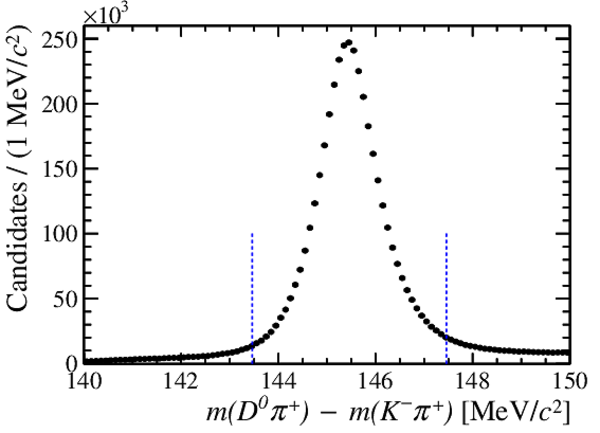
Invariant mass distributions of the (a) $\Lambda ^+_ c \rightarrow p K ^- \pi ^+ $ , (b) $ D ^0 \rightarrow K ^- \pi ^+ $ , (c) $\Sigma _ c ^{(*)++} \rightarrow \Lambda ^+_ c \pi ^+ $ , (d) $ D ^+ \rightarrow K ^- \pi ^+ \pi ^+ $ , (e) $\Sigma _ c ^{(*)0} \rightarrow \Lambda ^+_ c \pi ^- $ and (f) $ D ^{*+} \rightarrow D ^0 \pi ^+ $ decays. Note that in (c), (e) and (f) the mass of the charm hadron is subtracted from the mass distribution to minimise detector resolution effects. In (e) a contribution can also be seen at around $185\text{ Me V /}c^2 $ from the fully reconstructed $\Xi ^0_ c \rightarrow \Lambda ^+_ c \pi ^- $ decay. The blue dashed lines show the chosen signal windows around the peaks. |
Fig1a.pdf [55 KiB] HiDef png [148 KiB] Thumbnail [152 KiB] *.C file |
|
|
Fig1b.pdf [23 KiB] HiDef png [133 KiB] Thumbnail [138 KiB] *.C file |
|
|
|
Fig1c.pdf [25 KiB] HiDef png [144 KiB] Thumbnail [138 KiB] *.C file |
|
|
|
Fig1d.pdf [24 KiB] HiDef png [158 KiB] Thumbnail [163 KiB] *.C file |
|
|
|
Fig1e.pdf [26 KiB] HiDef png [156 KiB] Thumbnail [159 KiB] *.C file |
|
|
|
Fig1f.pdf [23 KiB] HiDef png [138 KiB] Thumbnail [142 KiB] *.C file |
|
|
|
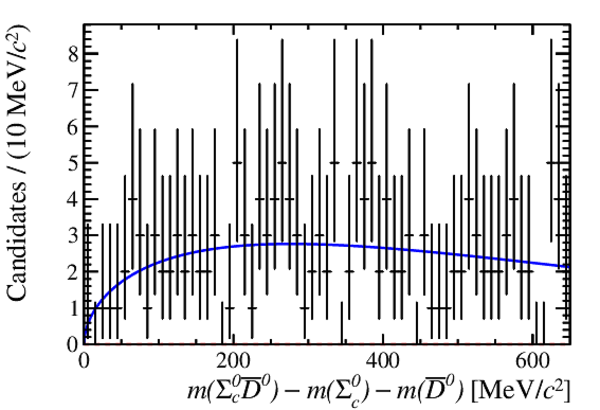
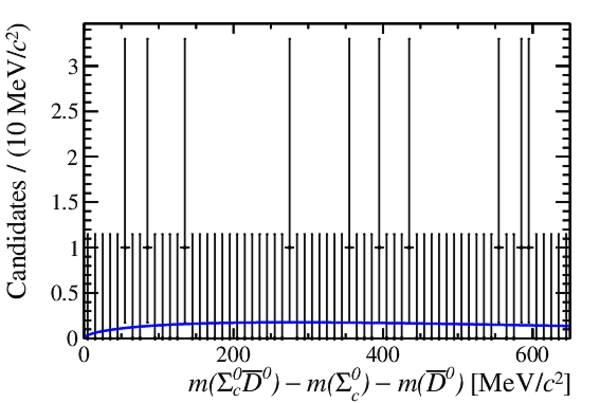
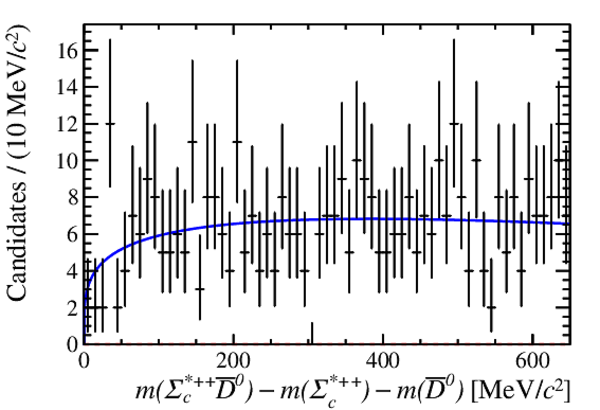
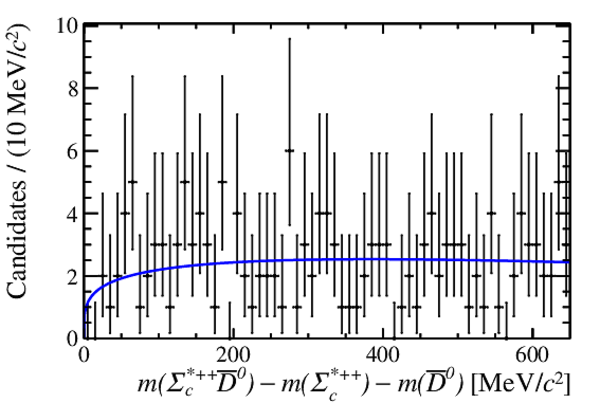
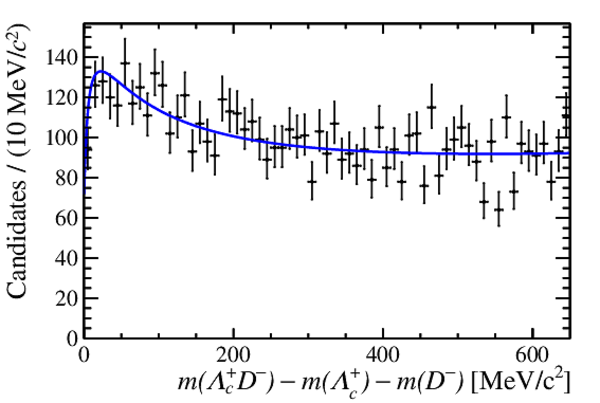
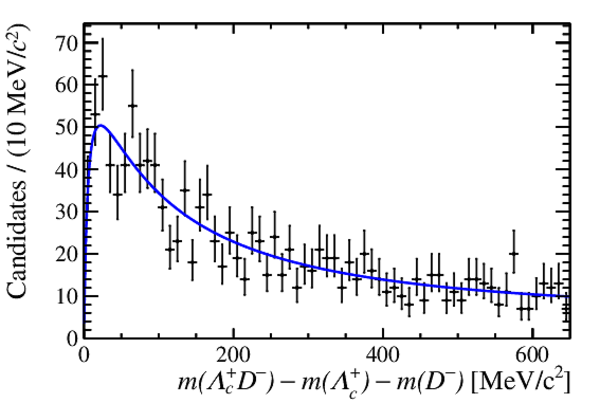
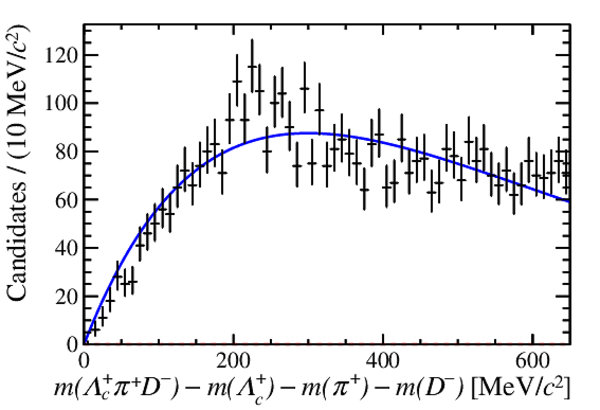
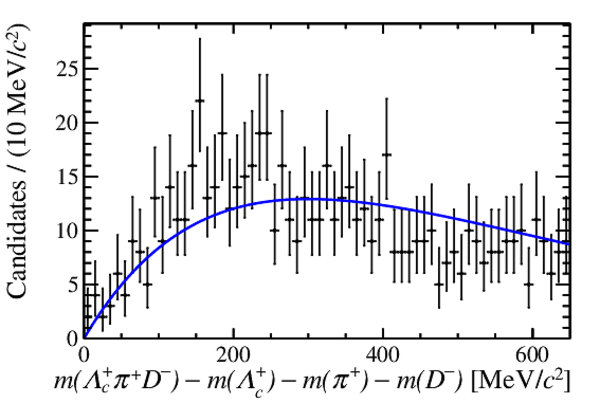
Distributions of the $Q$\hspace{0pt}-\hspace{0pt}value spectra for the $\Sigma _ c ^{0}$ $\overline{ D } {}^0$ (a) signal and (b) background regions, for the $\Sigma _ c ^{*++}$ $\overline{ D } {}^0$ (c) signal and (d) background regions, the $\Lambda ^+_ c $ $ D ^-$ (e) signal and (f) background regions and the $\Lambda ^+_ c $ $\pi ^+$ $ D ^-$ (g) signal and (h) background regions. The fits for the background-only hypotheses are overlaid. |
Fig2a.pdf [21 KiB] HiDef png [192 KiB] Thumbnail [168 KiB] *.C file |
|
|
Fig2b.pdf [18 KiB] HiDef png [167 KiB] Thumbnail [147 KiB] *.C file |
|
|
|
Fig2c.pdf [21 KiB] HiDef png [187 KiB] Thumbnail [171 KiB] *.C file |
|
|
|
Fig2d.pdf [20 KiB] HiDef png [178 KiB] Thumbnail [161 KiB] *.C file |
|
|
|
Fig2e.pdf [21 KiB] HiDef png [179 KiB] Thumbnail [171 KiB] *.C file |
|
|
|
Fig2f.pdf [21 KiB] HiDef png [187 KiB] Thumbnail [170 KiB] *.C file |
|
|
|
Fig2g.pdf [21 KiB] HiDef png [187 KiB] Thumbnail [172 KiB] *.C file |
|
|
|
Fig2h.pdf [20 KiB] HiDef png [185 KiB] Thumbnail [173 KiB] *.C file |
|
|
|
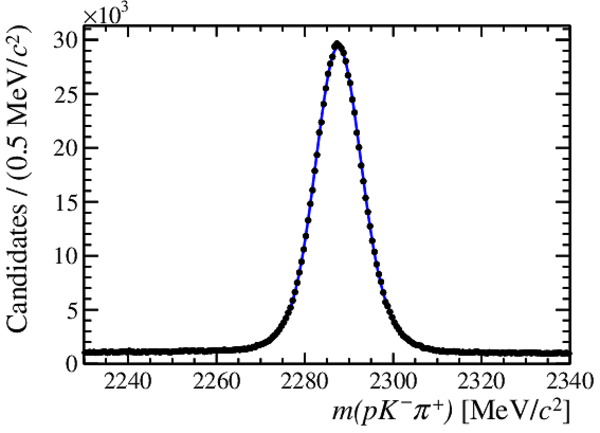
Invariant mass distribution of the $\Lambda ^+_ c \rightarrow p K ^- \pi ^+ $ decay. The fit results are overlaid. |
Fig3.pdf [57 KiB] HiDef png [156 KiB] Thumbnail [151 KiB] *.C file |
|
|
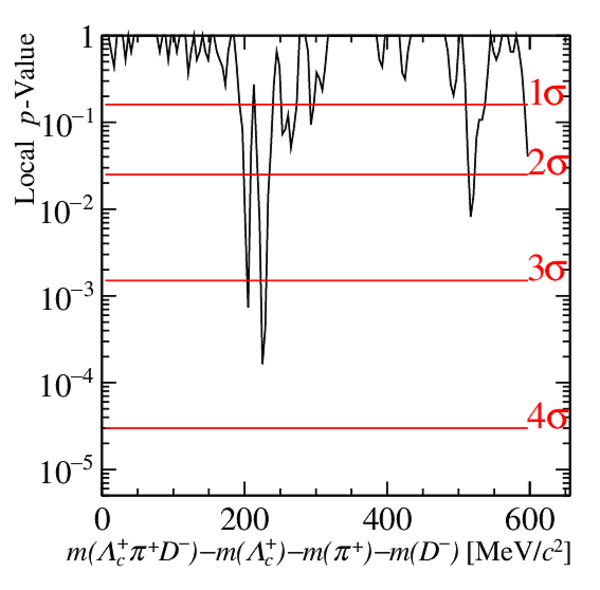
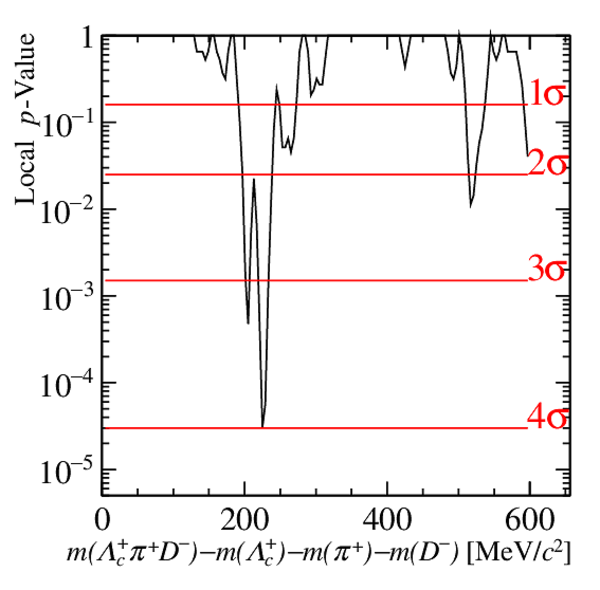
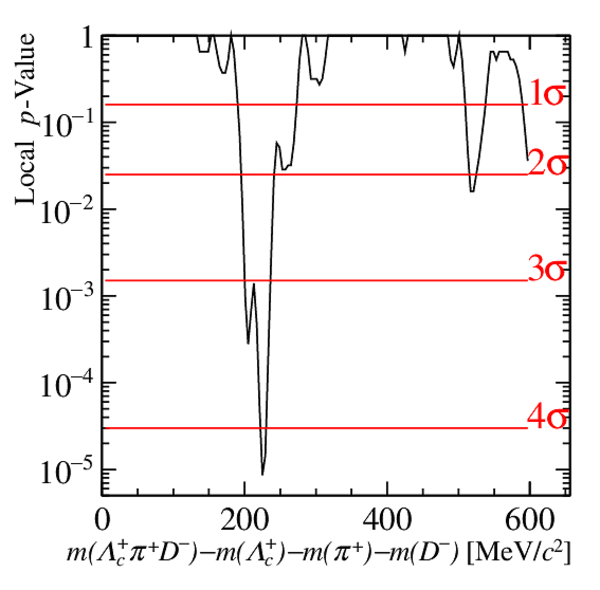
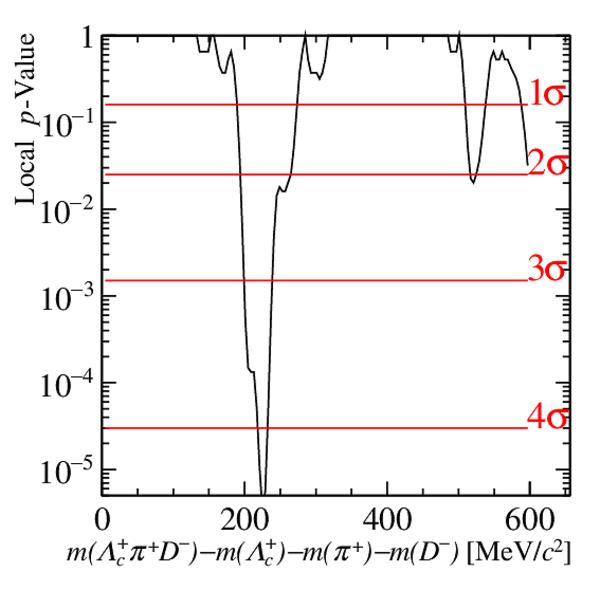
Local $p$\hspace{0pt}-\hspace{0pt}value distributions for the $\Lambda ^+_ c $ $\pi ^+$ $ D ^-$ mode with different signal models: (a) Gaussian function, (b) Voigtian function with 5 $\text{ Me V /}c^2$ width, (c) Voigtian function with 10 $\text{ Me V /}c^2$ width, and (d) Voigtian function with 15 $\text{ Me V /}c^2$ width. The red lines correspond to the levels of local significance. |
Fig4a.pdf [15 KiB] HiDef png [231 KiB] Thumbnail [209 KiB] *.C file |
|
|
Fig4b.pdf [15 KiB] HiDef png [211 KiB] Thumbnail [193 KiB] *.C file |
|
|
|
Fig4c.pdf [15 KiB] HiDef png [200 KiB] Thumbnail [187 KiB] *.C file |
|
|
|
Fig4d.pdf [15 KiB] HiDef png [194 KiB] Thumbnail [183 KiB] *.C file |
|
|
|
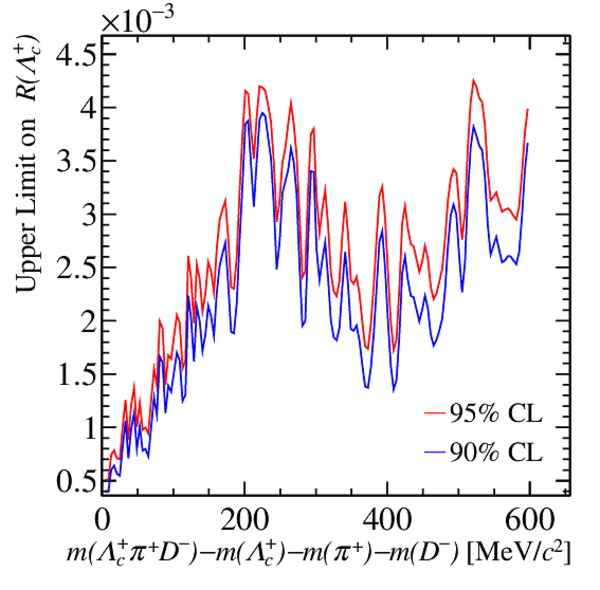
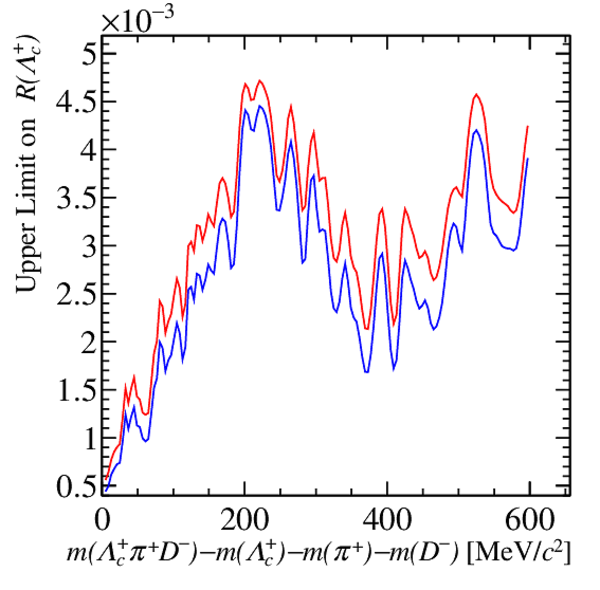
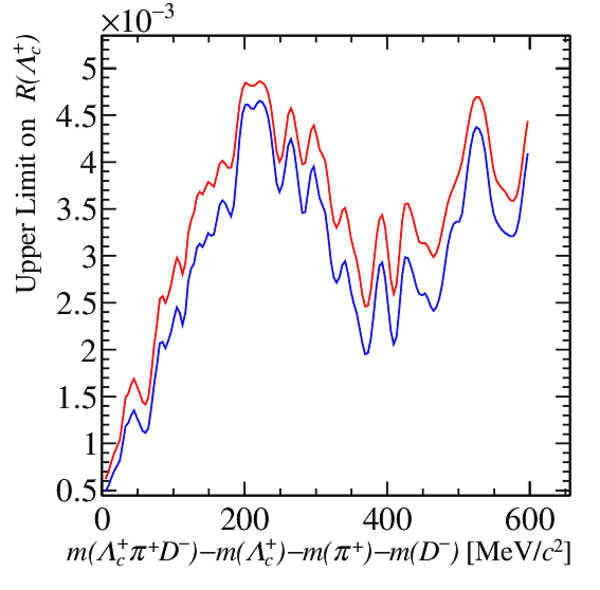
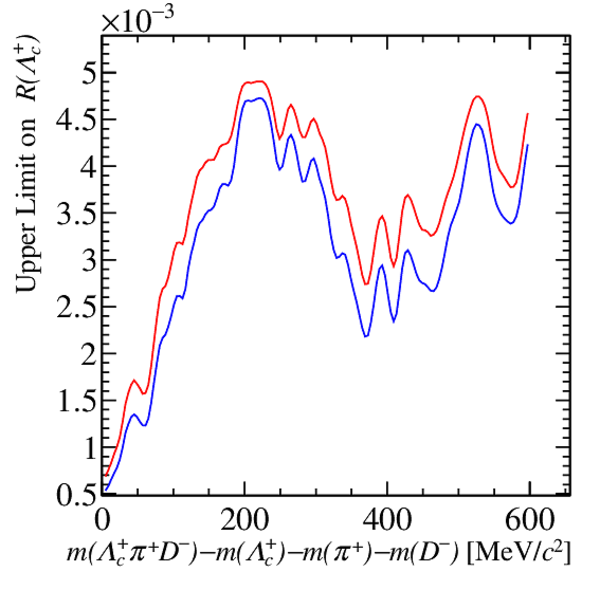
Upper limits on $R({\Lambda ^+_ c })$ distribution, at 90% and 95% CL, for the $\Lambda ^+_ c $ $\pi ^+$ $ D ^-$ mode with different signal models: (a) Gaussian function, (b) Voigtian function with $5\text{ Me V /}c^2 $ width, (c) Voigtian function with $10\text{ Me V /}c^2 $ width, and (d) Voigtian function with $15\text{ Me V /}c^2 $ width. |
Fig5a.pdf [16 KiB] HiDef png [481 KiB] Thumbnail [304 KiB] *.C file |
|
|
Fig5b.pdf [16 KiB] HiDef png [359 KiB] Thumbnail [255 KiB] *.C file |
|
|
|
Fig5c.pdf [16 KiB] HiDef png [301 KiB] Thumbnail [233 KiB] *.C file |
|
|
|
Fig5d.pdf [16 KiB] HiDef png [271 KiB] Thumbnail [218 KiB] *.C file |
|
|
|
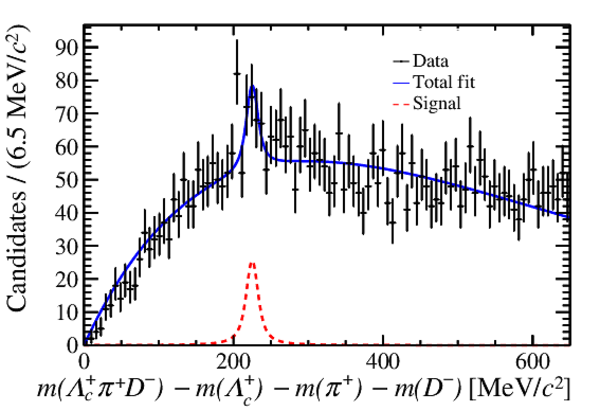
Distribution of the Q-value in the $\Lambda ^+_ c $ $\pi ^+$ $ D ^-$ channel, where the most significant signal is seen. The fit result is overlaid. |
Fig6.pdf [34 KiB] HiDef png [239 KiB] Thumbnail [220 KiB] *.C file |
|
|
Animated gif made out of all figures. |
PAPER-2023-018.gif Thumbnail |

|
![HiDef png [148 KiB]](Directory_LHCb-PAPER-2023-018/hidef_Fig1a.png)
![HiDef png [133 KiB]](Directory_LHCb-PAPER-2023-018/hidef_Fig1b.png)
![HiDef png [144 KiB]](Directory_LHCb-PAPER-2023-018/hidef_Fig1c.png)
![HiDef png [158 KiB]](Directory_LHCb-PAPER-2023-018/hidef_Fig1d.png)
![HiDef png [156 KiB]](Directory_LHCb-PAPER-2023-018/hidef_Fig1e.png)
![HiDef png [138 KiB]](Directory_LHCb-PAPER-2023-018/hidef_Fig1f.png)
![HiDef png [192 KiB]](Directory_LHCb-PAPER-2023-018/hidef_Fig2a.png)
![HiDef png [167 KiB]](Directory_LHCb-PAPER-2023-018/hidef_Fig2b.png)
![HiDef png [187 KiB]](Directory_LHCb-PAPER-2023-018/hidef_Fig2c.png)
![HiDef png [178 KiB]](Directory_LHCb-PAPER-2023-018/hidef_Fig2d.png)
![HiDef png [179 KiB]](Directory_LHCb-PAPER-2023-018/hidef_Fig2e.png)
![HiDef png [187 KiB]](Directory_LHCb-PAPER-2023-018/hidef_Fig2f.png)
![HiDef png [187 KiB]](Directory_LHCb-PAPER-2023-018/hidef_Fig2g.png)
![HiDef png [185 KiB]](Directory_LHCb-PAPER-2023-018/hidef_Fig2h.png)
![HiDef png [156 KiB]](Directory_LHCb-PAPER-2023-018/hidef_Fig3.png)
![HiDef png [231 KiB]](Directory_LHCb-PAPER-2023-018/hidef_Fig4a.png)
![HiDef png [211 KiB]](Directory_LHCb-PAPER-2023-018/hidef_Fig4b.png)
![HiDef png [200 KiB]](Directory_LHCb-PAPER-2023-018/hidef_Fig4c.png)
![HiDef png [194 KiB]](Directory_LHCb-PAPER-2023-018/hidef_Fig4d.png)
![HiDef png [481 KiB]](Directory_LHCb-PAPER-2023-018/hidef_Fig5a.png)
![HiDef png [359 KiB]](Directory_LHCb-PAPER-2023-018/hidef_Fig5b.png)
![HiDef png [301 KiB]](Directory_LHCb-PAPER-2023-018/hidef_Fig5c.png)
![HiDef png [271 KiB]](Directory_LHCb-PAPER-2023-018/hidef_Fig5d.png)
![HiDef png [239 KiB]](Directory_LHCb-PAPER-2023-018/hidef_Fig6.png)
Tables and captions
|
All possible combinations of $\Sigma _ c $ or $\Lambda ^+_ c $ baryons with $ D ^{(*)}$ mesons to produce the isospin multiplet. Combinations of $\Lambda ^+_ c $ baryons, pions and $ D $ mesons are also considered. From each $\Sigma _ c $ $ D $ combination the corresponding $\Lambda ^+_ c $ $\pi $ $ D $ combination can be derived. The charge of the corresponding pentaquark state is given, along with the isospin, hypercharge and charm quantum numbers. The last column indicates whether a mode has an upper limit set in this paper. The combinations are split by the charm value. |
Table_1.pdf [76 KiB] HiDef png [167 KiB] Thumbnail [88 KiB] tex code |

|
|
Range of values of each systematic uncertainty contribution and the total combination for the different signal modes. |
Table_2.pdf [56 KiB] HiDef png [111 KiB] Thumbnail [50 KiB] tex code |

|
|
Upper limits on $R({\Lambda ^+_ c })$ at $90\%$ and $95\%$ CL for the modes with the same total charge as the known pentaquark states, and with hidden-charm quark content. The local $p$\hspace{0pt}-\hspace{0pt}value and significance are listed as well as the signal yield, where the error on the signal yield is statistical only. |
Table_3.pdf [73 KiB] HiDef png [148 KiB] Thumbnail [71 KiB] tex code |

|
![HiDef png [167 KiB]](Directory_LHCb-PAPER-2023-018/hidef_Table_1.png)
![HiDef png [111 KiB]](Directory_LHCb-PAPER-2023-018/hidef_Table_2.png)
![HiDef png [148 KiB]](Directory_LHCb-PAPER-2023-018/hidef_Table_3.png)
Created on 26 April 2024.