A model-independent measurement of the CKM angle γ in partially reconstructed B±→D∗h± decays with D→K0Sh+h−(h=π,K)
[to restricted-access page]Information
LHCb-PAPER-2023-029
CERN-EP-2023-241
arXiv:2311.10434 [PDF]
(Submitted on 17 Nov 2023)
JHEP 02 (2024) 118
Inspire 2724083
Tools
Abstract
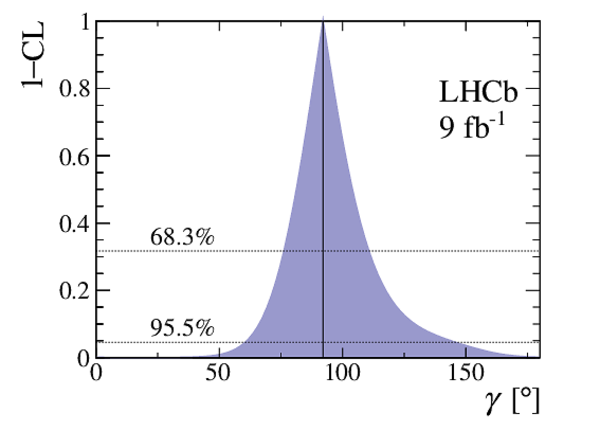
A measurement of CP-violating observables in B±→D∗K± and B±→D∗π± decays is made where the photon or neutral pion from the D∗→Dγ or D∗→Dπ0 decay is not reconstructed. The D meson is reconstructed in the self-conjugate decay modes, D→K0Sπ+π− or D→K0SK+K−. The distribution of signal yields in the D decay phase space is analysed in a model-independent way. The measurement uses a data sample collected in proton-proton collisions at centre-of-mass energies of 7, 8, and 13 TeV, corresponding to a total integrated luminosity of approximately 9 fb−1. The B±→D∗K± and B±→D∗π± CP-violating observables are interpreted in terms of hadronic parameters and the CKM angle γ, resulting in a measurement of γ=(92+21−17)∘. The total uncertainty includes the statistical and systematic uncertainties, and the uncertainty due to external strong-phase inputs.
Figures and captions
|
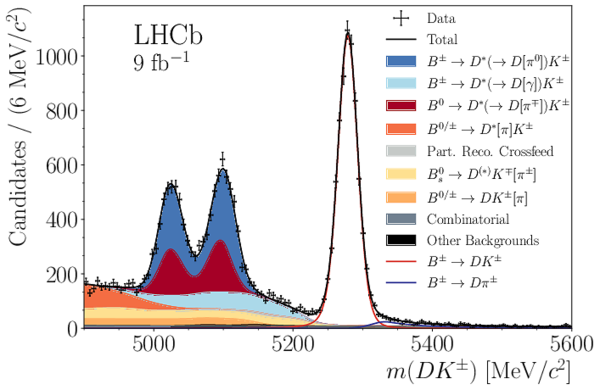
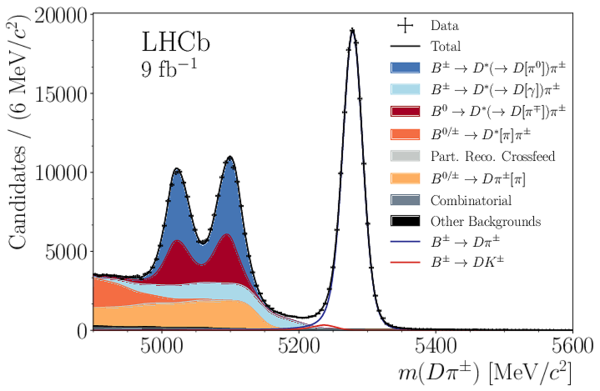
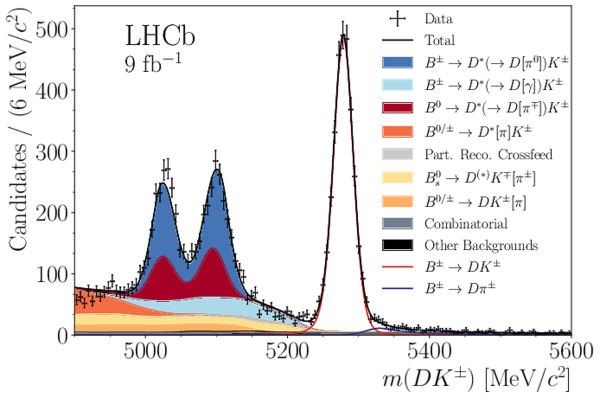
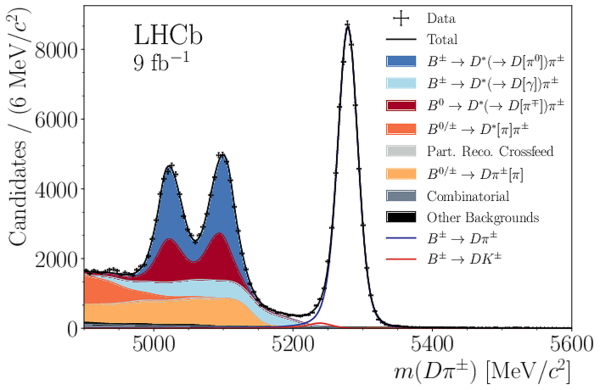
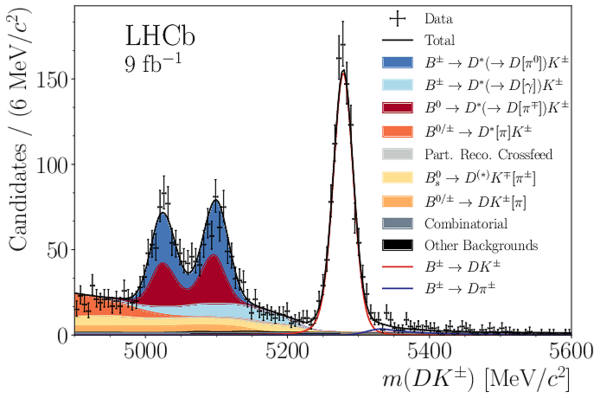
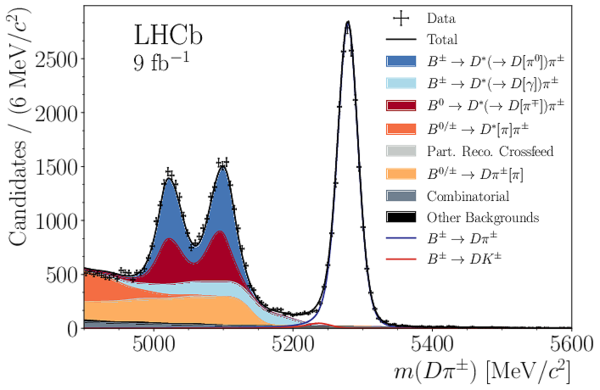
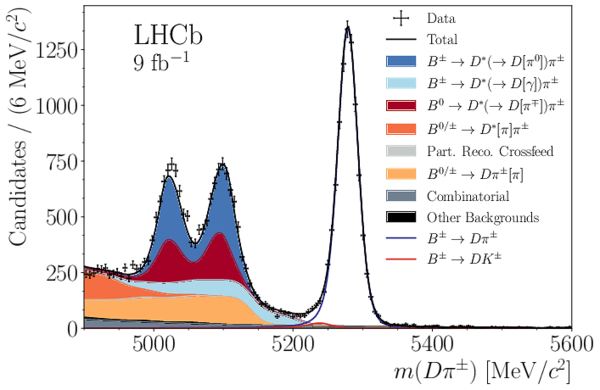
Mass distributions for (left) DK samples and (right) Dπ samples, with D→K0Sπ+π− decays reconstructed with a (top) downstream K0S candidate and a (bottom) long K0S candidate. The projections of the fit results are overlaid. In the legend, particles in square brackets are not reconstructed. |
Fig1a.pdf [196 KiB] HiDef png [459 KiB] Thumbnail [214 KiB] *.C file |
|
|
Fig1b.pdf [194 KiB] HiDef png [404 KiB] Thumbnail [190 KiB] *.C file |
|
|
|
Fig1c.pdf [195 KiB] HiDef png [486 KiB] Thumbnail [221 KiB] *.C file |
|
|
|
Fig1d.pdf [194 KiB] HiDef png [415 KiB] Thumbnail [196 KiB] *.C file |
|
|
|
Mass distributions for (left) DK samples and (right) Dπ samples, with D→K0SK+K− decays reconstructed with a (top) downstream K0S candidate and a (bottom) long K0S candidate. The projections of the fit results are overlaid. In the legend, particles in square brackets are not reconstructed. |
Fig2a.pdf [194 KiB] HiDef png [473 KiB] Thumbnail [218 KiB] *.C file |
|
|
Fig2b.pdf [194 KiB] HiDef png [427 KiB] Thumbnail [200 KiB] *.C file |
|
|
|
Fig2c.pdf [193 KiB] HiDef png [490 KiB] Thumbnail [231 KiB] *.C file |

|
|
|
Fig2d.pdf [193 KiB] HiDef png [431 KiB] Thumbnail [202 KiB] *.C file |
|
|
|
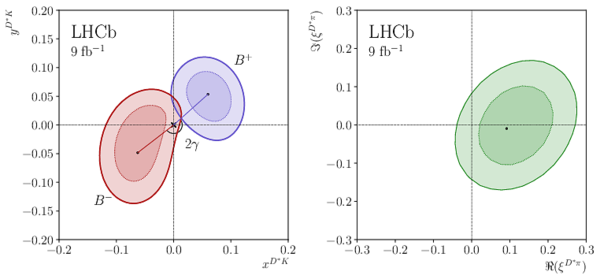
Contours at 68.3% and 95.5% confidence levels indicated by the darker and lighter regions, respectively, for (left, red) (xD∗K−,yD∗K−) which is labelled B− and (left, purple) (xD∗K+,yD∗K+) which is labelled B+, and (right) (ℜ(ξD∗π),ℑ(ξD∗π)), including only statistical uncertainty. The black points indicate the central values. |
Fig3.pdf [196 KiB] HiDef png [248 KiB] Thumbnail [117 KiB] *.C file |
|
|
Confidence intervals at 68.3% and 95.5% for the CKM angle γ . |
Fig4.pdf [14 KiB] HiDef png [208 KiB] Thumbnail [115 KiB] *.C file |
|
|
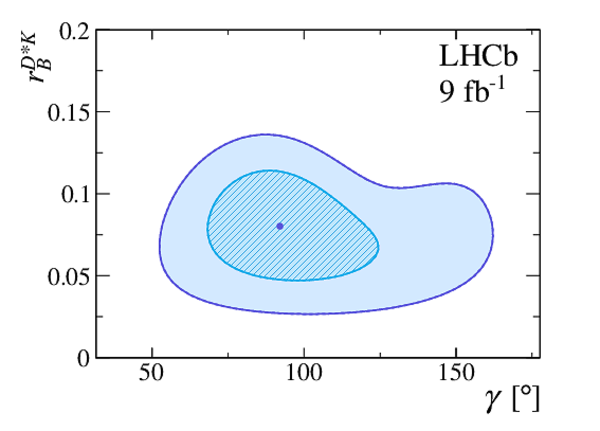
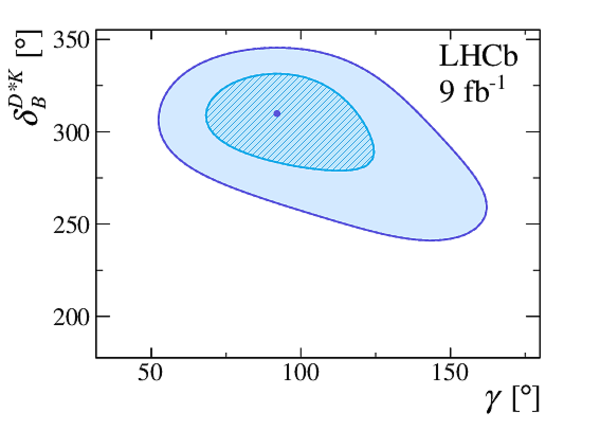
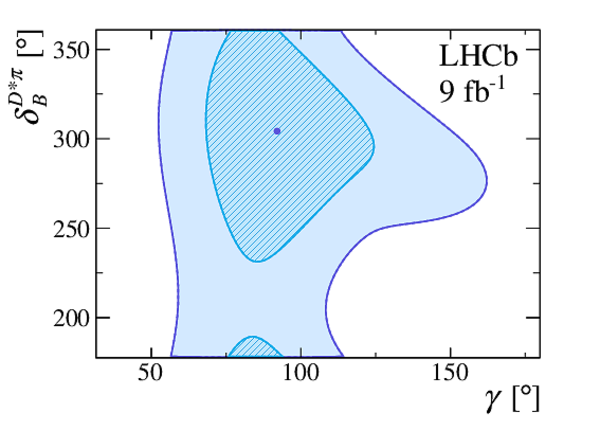
Confidence regions at 68.3% and 95.5% indicated by the lighter and darker shades respectively, for (top, left) γ vs. rD∗KB, (top, right) γ vs. δD∗KB, (bottom left) γ vs. rD∗πB, and (bottom, right) γ vs. δD∗πB. |
Fig5a.pdf [14 KiB] HiDef png [368 KiB] Thumbnail [184 KiB] *.C file |
|
|
Fig5b.pdf [14 KiB] HiDef png [357 KiB] Thumbnail [177 KiB] *.C file |
|
|
|
Fig5c.pdf [17 KiB] HiDef png [382 KiB] Thumbnail [194 KiB] *.C file |

|
|
|
Fig5d.pdf [19 KiB] HiDef png [547 KiB] Thumbnail [280 KiB] *.C file |
|
|
|
Animated gif made out of all figures. |
PAPER-2023-029.gif Thumbnail |

|
![HiDef png [459 KiB]](Directory_LHCb-PAPER-2023-029/hidef_Fig1a.png)
![HiDef png [404 KiB]](Directory_LHCb-PAPER-2023-029/hidef_Fig1b.png)
![HiDef png [486 KiB]](Directory_LHCb-PAPER-2023-029/hidef_Fig1c.png)
![HiDef png [415 KiB]](Directory_LHCb-PAPER-2023-029/hidef_Fig1d.png)
![HiDef png [473 KiB]](Directory_LHCb-PAPER-2023-029/hidef_Fig2a.png)
![HiDef png [427 KiB]](Directory_LHCb-PAPER-2023-029/hidef_Fig2b.png)
![HiDef png [490 KiB]](Directory_LHCb-PAPER-2023-029/hidef_Fig2c.png)
![HiDef png [431 KiB]](Directory_LHCb-PAPER-2023-029/hidef_Fig2d.png)
![HiDef png [248 KiB]](Directory_LHCb-PAPER-2023-029/hidef_Fig3.png)
![HiDef png [208 KiB]](Directory_LHCb-PAPER-2023-029/hidef_Fig4.png)
![HiDef png [368 KiB]](Directory_LHCb-PAPER-2023-029/hidef_Fig5a.png)
![HiDef png [357 KiB]](Directory_LHCb-PAPER-2023-029/hidef_Fig5b.png)
![HiDef png [382 KiB]](Directory_LHCb-PAPER-2023-029/hidef_Fig5c.png)
![HiDef png [547 KiB]](Directory_LHCb-PAPER-2023-029/hidef_Fig5d.png)
Tables and captions
|
Signal and background yields from the global fit over the full mass range, 4900\textendash5600 Me V /c2. All yields and uncertainties are rounded to the nearest integer and uncertainties of 1 mean one or fewer. Backgrounds that are not written explicitly in this table are included in the `Other Backgrounds' component. |
Table_1.pdf [101 KiB] HiDef png [83 KiB] Thumbnail [36 KiB] tex code |

|
|
Summary of the systematic uncertainties. Values are expressed in units of 10−2. |
Table_2.pdf [121 KiB] HiDef png [123 KiB] Thumbnail [55 KiB] tex code |

|
|
Statistical correlation matrix for the CP -violating observables. |
Table_3.pdf [113 KiB] HiDef png [51 KiB] Thumbnail [24 KiB] tex code |

|
|
Correlation matrix associated with LHCb-related systematic uncertainties. |
Table_4.pdf [112 KiB] HiDef png [50 KiB] Thumbnail [24 KiB] tex code |

|
|
Correlation matrix associated with the strong-phase inputs. |
Table_5.pdf [113 KiB] HiDef png [51 KiB] Thumbnail [24 KiB] tex code |

|
![HiDef png [83 KiB]](Directory_LHCb-PAPER-2023-029/hidef_Table_1.png)
![HiDef png [123 KiB]](Directory_LHCb-PAPER-2023-029/hidef_Table_2.png)
![HiDef png [51 KiB]](Directory_LHCb-PAPER-2023-029/hidef_Table_3.png)
![HiDef png [50 KiB]](Directory_LHCb-PAPER-2023-029/hidef_Table_4.png)
![HiDef png [51 KiB]](Directory_LHCb-PAPER-2023-029/hidef_Table_5.png)
Created on 04 April 2025.