Measurements of the branching fraction ratio $\mathcal{B}(\phi\to\mu^{+}\mu^{-})$/$\mathcal{B}(\phi\to e^{+}e^{-})$ with charm meson decays
[to restricted-access page]Information
LHCb-PAPER-2023-038
CERN-EP-2024-001
arXiv:2402.01336 [PDF]
(Submitted on 02 Feb 2024)
JHEP
Inspire 2755088
Tools
Abstract
Measurements of the branching fraction ratio ${\cal{B}(\phi \to \mu^+ \mu^-)/\cal{B}(\phi\to e^+e^-)}$ with ${D_{s}^{+} \to \pi^{+} \phi}$ and ${D^{+} \to \pi^{+} \phi}$ decays, denoted $R^{s}_{\phi \pi}$ and $R^{d}_{\phi \pi}$, are presented. The analysis is performed using a dataset corresponding to an integrated luminosity of 5.4$ \rm{fb}^{-1}$ of $pp$ collision data collected with the LHCb experiment. The branching fractions are normalised with respect to the ${B^{+} \to K^{+} J/\psi(\to e^+e^-)}$ and ${B^{+} \to K^{+} J/\psi(\to \mu^+\mu^-)}$ decay modes. The combination of the results yields $$ R_{\phi \pi} = 1.022 \pm 0.012 ({\rm stat}) \pm 0.048 ({\rm syst}). $$ The result is compatible with previous measurements of the $\phi \to \ell^{+}\ell^{-}$ branching fractions and predictions based on the Standard Model.
Figures and captions
|
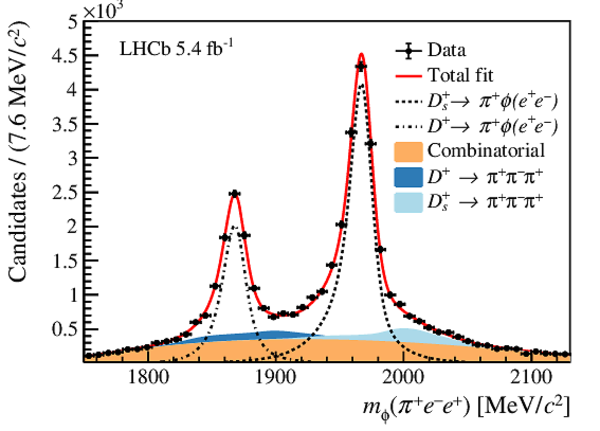
Distribution of the invariant mass $ m_{\phi}{(\pi ^+ \ell^+ \ell^- )}$ overlaid with the result of the fit for candidates with (left) muon and (right) electron pairs in the final states. The dotted and dot-dashed lines describe the signal contributions, while the solid areas represent the background components. |
Fig1a.pdf [25 KiB] HiDef png [215 KiB] Thumbnail [167 KiB] *.C file |

|
|
Fig1b.pdf [26 KiB] HiDef png [289 KiB] Thumbnail [228 KiB] *.C file |
|
|
|
Left: distribution of the $\pi ^+ \ell^{+}\ell^{-}$ invariant mass of candidates obtained from selecting final states with electrons of same charge (blue) or that fail the BDT requirement (orange). Fit results using a third-order polynomial are overlaid. The overall normalisation is chosen such that the two curves have the same area. Right: distribution of the invariant mass of $\pi^{+}\ell^{-}\ell^{+}$ candidates, after interpreting the leptons as pions, for candidates failing the electron PID criteria. The reversed PID sample contains predominantly $ D^{+}_{(s)}\rightarrow \pi ^+ \pi ^- \pi ^+ $ events and a fraction of combinatorial events. |
Fig2a.pdf [27 KiB] HiDef png [393 KiB] Thumbnail [244 KiB] *.C file |

|
|
Fig2b.pdf [24 KiB] HiDef png [273 KiB] Thumbnail [195 KiB] *.C file |

|
|
|
Invariant mass distributions of the selected candidates for the (left) $ { B ^+ \rightarrow K^{+} { J \mskip -3mu/\mskip -2mu\psi } (\rightarrow e ^+ e ^- )}$ and (right) $ { B ^+ \rightarrow K^{+} { J \mskip -3mu/\mskip -2mu\psi } (\rightarrow \mu ^+\mu ^- )}$ modes, overlaid with the result of the fit. The dotted lines describe the signal contribution and the solid areas represent each of the background components described in the text. |
Fig3a.pdf [41 KiB] HiDef png [235 KiB] Thumbnail [197 KiB] *.C file |

|
|
Fig3b.pdf [25 KiB] HiDef png [256 KiB] Thumbnail [204 KiB] *.C file |

|
|
|
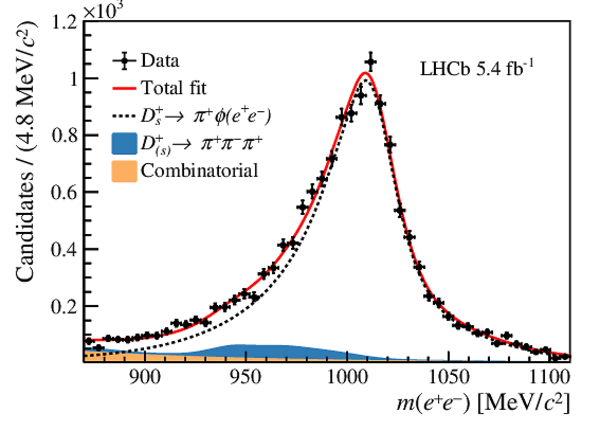
Distributions of (top) $m(e^{+}e^{-})$ and (bottom) $m(\mu^{+}\mu^{-})$ for candidates selected in the signal region of the (left) $ D ^+$ (right) and $ D ^+_ s $ $\phi$-constrained invariant mass. The dotted lines describe the signal contribution and the solid areas represent each of the background components described in the text. |
Fig4a.pdf [24 KiB] HiDef png [248 KiB] Thumbnail [204 KiB] *.C file |

|
|
Fig4b.pdf [25 KiB] HiDef png [236 KiB] Thumbnail [189 KiB] *.C file |
|
|
|
Fig4c.pdf [23 KiB] HiDef png [184 KiB] Thumbnail [154 KiB] *.C file |

|
|
|
Fig4d.pdf [24 KiB] HiDef png [173 KiB] Thumbnail [146 KiB] *.C file |

|
|
|
Distribution of the invariant mass computed under the pion mass hypothesis for the dielectron pair using track information only, for candidates passing the electron PID criteria. The fit projection is superimposed, with dashed and dotted-dashed lines describing the signal contributions, while solid light and dark blue areas represent misidentified $ D^{+}_{(s)}\rightarrow \pi ^+ \pi ^- \pi ^+ $ components. In this variable the latter are clearly visible in data passing the electron PID criteria. |
Fig5.pdf [27 KiB] HiDef png [306 KiB] Thumbnail [247 KiB] *.C file |

|
|
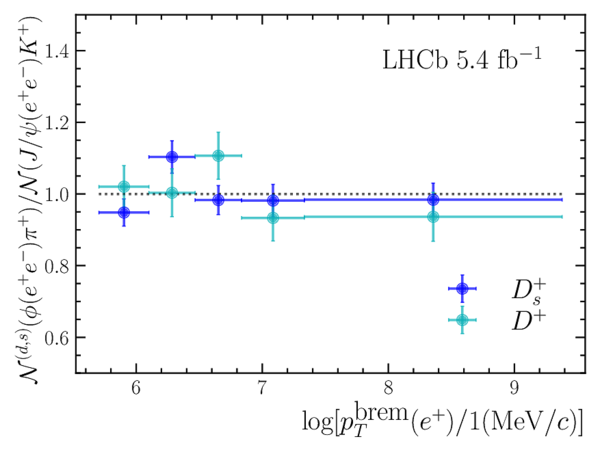
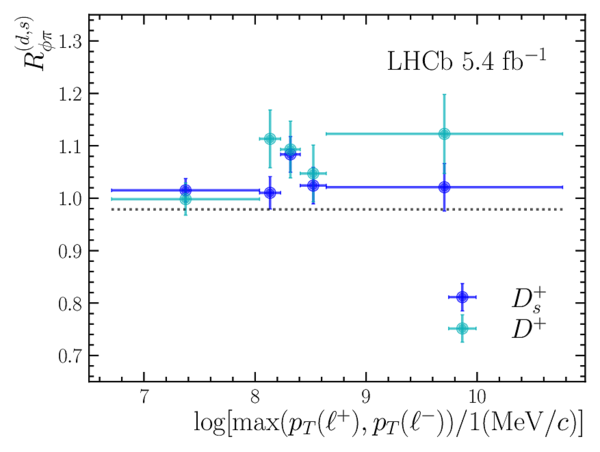
Measured $ R^{(d,s)}_{\phi \pi}$ as a function of the (top left) angle between the leptons $\alpha(\ell^+, \ell^-)$, and (top right) the maximum $ p_{\mathrm{T}}$ of the leptons. The structure observed at intermediate maximum $ p_{\mathrm{T}}$ is related to the trigger threshold. The errors shown are statistical only. Also shown is the ratio of efficiency-corrected ${ D^{+}_{(s)} \rightarrow \pi ^+ \phi }$ and ${ { B ^+ \rightarrow K^{+} { J \mskip -3mu/\mskip -2mu\psi } (\rightarrow e ^+ e ^- )} }$ yields as a function of the (bottom left) transverse momentum recovered with the bremsstrahlung recovery algorithm and (bottom right) its fraction with respect to the total transverse momentum of the electron. The flatness of these distributions indicates that the bremsstrahlung recovery algorithm is well reproduced in simulation at low $ q^2$ . The normalisation of these distributions is arbitrary and the uncertainties displayed are statistical only. |
Fig6a.pdf [99 KiB] HiDef png [144 KiB] Thumbnail [111 KiB] *.C file |

|
|
Fig6b.pdf [99 KiB] HiDef png [158 KiB] Thumbnail [121 KiB] *.C file |

|
|
|
Fig6c.pdf [99 KiB] HiDef png [163 KiB] Thumbnail [120 KiB] *.C file |
|
|
|
Fig6d.pdf [99 KiB] HiDef png [160 KiB] Thumbnail [119 KiB] *.C file |

|
|
|
Animated gif made out of all figures. |
PAPER-2023-038.gif Thumbnail |

|
![HiDef png [215 KiB]](Directory_LHCb-PAPER-2023-038/hidef_Fig1a.png)
![HiDef png [289 KiB]](Directory_LHCb-PAPER-2023-038/hidef_Fig1b.png)
![HiDef png [393 KiB]](Directory_LHCb-PAPER-2023-038/hidef_Fig2a.png)
![HiDef png [273 KiB]](Directory_LHCb-PAPER-2023-038/hidef_Fig2b.png)
![HiDef png [235 KiB]](Directory_LHCb-PAPER-2023-038/hidef_Fig3a.png)
![HiDef png [256 KiB]](Directory_LHCb-PAPER-2023-038/hidef_Fig3b.png)
![HiDef png [248 KiB]](Directory_LHCb-PAPER-2023-038/hidef_Fig4a.png)
![HiDef png [236 KiB]](Directory_LHCb-PAPER-2023-038/hidef_Fig4b.png)
![HiDef png [184 KiB]](Directory_LHCb-PAPER-2023-038/hidef_Fig4c.png)
![HiDef png [173 KiB]](Directory_LHCb-PAPER-2023-038/hidef_Fig4d.png)
![HiDef png [306 KiB]](Directory_LHCb-PAPER-2023-038/hidef_Fig5.png)
![HiDef png [144 KiB]](Directory_LHCb-PAPER-2023-038/hidef_Fig6a.png)
![HiDef png [158 KiB]](Directory_LHCb-PAPER-2023-038/hidef_Fig6b.png)
![HiDef png [163 KiB]](Directory_LHCb-PAPER-2023-038/hidef_Fig6c.png)
![HiDef png [160 KiB]](Directory_LHCb-PAPER-2023-038/hidef_Fig6d.png)
Tables and captions
|
Signal ( $ D^{+}_{(s)} \rightarrow \pi ^+ \phi$ ) and normalisation ( $ { B ^+ \rightarrow K^{+} { J \mskip -3mu/\mskip -2mu\psi } (\rightarrow \ell^{+}\ell^{-})}$ ) mode sideband mass ranges. The variables $ m_{\phi}{(\pi ^+ \ell^+ \ell^- )}$ and $ m_{ { J \mskip -3mu/\mskip -2mu\psi } }{( K ^+ \ell^+ \ell^- )}$ are used for signal and normalisation decays, respectively. |
Table_1.pdf [68 KiB] HiDef png [46 KiB] Thumbnail [21 KiB] tex code |

|
|
Yields of the signal and normalisation decay modes obtained from the fits to the data. The quoted uncertainty accounts for both statistical and systematic effects. |
Table_2.pdf [68 KiB] HiDef png [92 KiB] Thumbnail [44 KiB] tex code |

|
|
Relative systematic uncertainties in percent affecting the measurements $ R^{d}_{\phi \pi}$ and $ R^{s}_{\phi \pi}$ . |
Table_3.pdf [58 KiB] HiDef png [69 KiB] Thumbnail [31 KiB] tex code |

|
![HiDef png [46 KiB]](Directory_LHCb-PAPER-2023-038/hidef_Table_1.png)
![HiDef png [92 KiB]](Directory_LHCb-PAPER-2023-038/hidef_Table_2.png)
![HiDef png [69 KiB]](Directory_LHCb-PAPER-2023-038/hidef_Table_3.png)
Supplementary Material [file]
| Supplementary material full pdf |
supple[..].pdf [743 KiB] |

|
|
This ZIP file contains supplemetary material for the publication LHCb-PAPER-2023-038. The files are: supplementary.pdf : An overview of the extra figures supplementary.tex : The corresponding TeX source code *.pdf, *.png, *.eps : The figures in various formats |
Fig6a.pdf [13 KiB] HiDef png [121 KiB] Thumbnail [107 KiB] *C file |

|
|
Fig6b.pdf [99 KiB] HiDef png [158 KiB] Thumbnail [121 KiB] *C file |
|
|
|
Fig6c.pdf [14 KiB] HiDef png [137 KiB] Thumbnail [116 KiB] *C file |

|
|
|
Fig6d.pdf [99 KiB] HiDef png [160 KiB] Thumbnail [119 KiB] *C file |

|
|
|
Fig7a.pdf [99 KiB] HiDef png [149 KiB] Thumbnail [117 KiB] *C file |

|
|
|
Fig7b.pdf [99 KiB] HiDef png [146 KiB] Thumbnail [105 KiB] *C file |

|
|
|
Fig7c.pdf [99 KiB] HiDef png [148 KiB] Thumbnail [115 KiB] *C file |

|
|
|
Fig7d.pdf [98 KiB] HiDef png [121 KiB] Thumbnail [96 KiB] *C file |

|
![HiDef png [121 KiB]](Directory_LHCb-PAPER-2023-038/supplementary/hidef_Fig6a.png)
![HiDef png [158 KiB]](Directory_LHCb-PAPER-2023-038/supplementary/hidef_Fig6b.png)
![HiDef png [137 KiB]](Directory_LHCb-PAPER-2023-038/supplementary/hidef_Fig6c.png)
![HiDef png [160 KiB]](Directory_LHCb-PAPER-2023-038/supplementary/hidef_Fig6d.png)
![HiDef png [149 KiB]](Directory_LHCb-PAPER-2023-038/supplementary/hidef_Fig7a.png)
![HiDef png [146 KiB]](Directory_LHCb-PAPER-2023-038/supplementary/hidef_Fig7b.png)
![HiDef png [148 KiB]](Directory_LHCb-PAPER-2023-038/supplementary/hidef_Fig7c.png)
![HiDef png [121 KiB]](Directory_LHCb-PAPER-2023-038/supplementary/hidef_Fig7d.png)
Created on 11 May 2024.