   |  |
Computing Technical Design Report
The need for graphical representation exists in all phases of the experiment. Graphics are used:
The suite of graphics tools should meet the following requirements:
Additional requirements arise from needs encountered in performing specific tasks.
Three separate graphics and event-display environments have been developed which address different aspects of these goals and requirements. They are described in the following sections.
Atlantis is an event-display program with the primary goal of the visual investigation and the understanding of the physics of complete events. In addition, it facilitates developing and debugging of reconstruction and analysis algorithms, and allows for debugging during detector commissioning.
The Atlantis program is based upon DALI [3-15], the event display used by the ALEPH experiment. It is written in Java and runs under different operating systems. Atlantis uses the experience obtained from DALI, which showed that data-driven 2D projections, while displaying a rudimentary description of the detector, provide excellent information for understanding events. The choice of 2D projections is driven by data and the detector layout. Sometimes non-linear projections (like ρ-z or fish-eye) are extremely helpful for track identification or extrapolation. New features for existing projections, as well as new projections, are added as a result of requests from the user community.
The colouring of data and detector outlines has been given special attention, aiming for an intuitive understanding of the important features of an event. Special colour maps, including grey-scale, are available for printing, so that the printed result is suitable for publication.
Atlantis allows the possibility of colouring hits and tracks by association, thus providing information on which hits are and are not used in the reconstruction as an aid to the debugging of reconstruction algorithms. A similar capability is available for colouring calorimeter information with respect to cluster and jet. By clicking on individual data elements, detailed information can be displayed, which again aids in debugging.
Atlantis reads both event and detector geometry information produced by Athena-based applications in XML-format. This can either be from a file which may contain either individual events or combinations of events, or using the XMLRPC network protocol. This technique allows for an independent development of Atlantis, using a well-defined interface. When obtaining information through the network protocol, it is possible to run Atlantis as an online event display on several machines simultaneously.
The detector geometry displayed in Atlantis is based on the primary GeoModel geometry which ensures that the displayed geometry is consistent with the event data, a capability that was used for the 2004 combined test beam (CTB) and will be used for ATLAS commissioning.
The network protocol allows fully bidirectional communication between Atlantis and Athena. This communication makes use of the interactive nature of Python-driven Athena applications, but moves the command prompt to the Atlantis program. Within Atlantis it will be possible to send Python commands to the Athena application, and subsequently display the event. Furthermore, Atlantis will have the functionality to save the XML-code of the modified event, and thus allows for a detailed visual comparison between different reconstruction settings (or versions) of the same event (even at a later time). Using this communication method, any future interactive functionality of Athena is automatically available through Atlantis, whilst Atlantis will still be available as a stand-alone program.
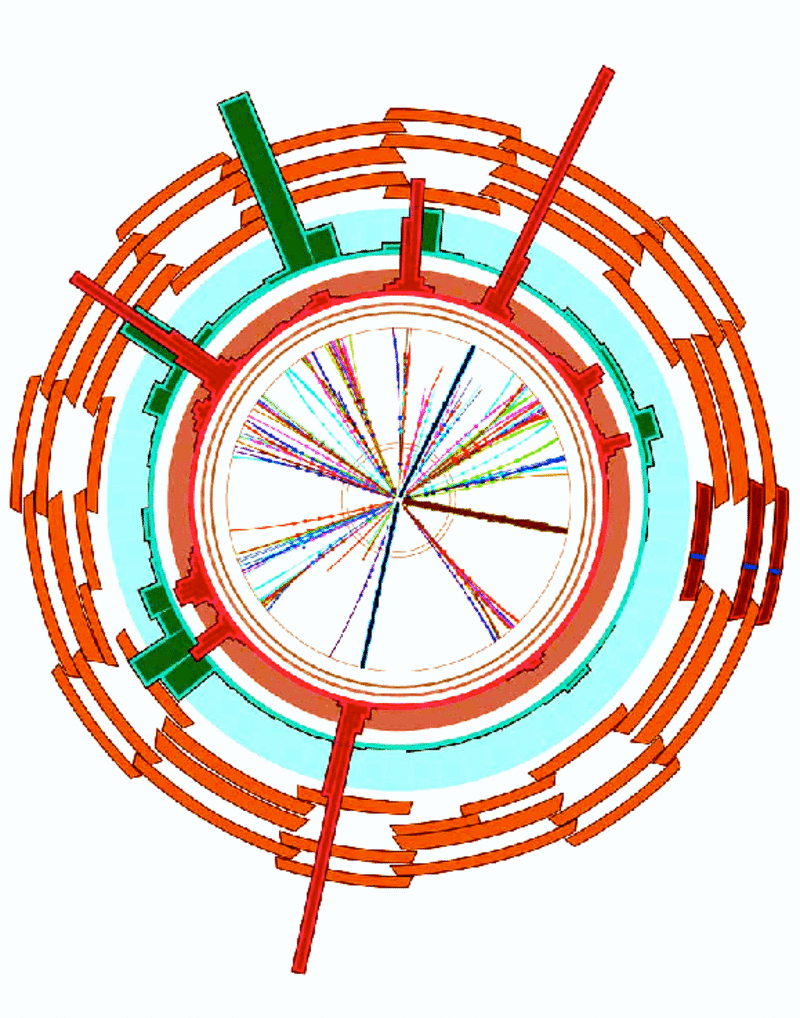
An example of the Atlantis event display is shown in Figure 3-2.

|
The visualization program HEPVis/v-atlas is the chief debugging tool for the ATLAS geometry described in Section 3.5.2 . The system provides powerful interactive visual debugging of the geometry model. Running entirely within the Athena framework, it allows users to view the geometry at all levels of hierarchy and also to query the geometry. It is designed for extensibility, so that other visualization features such as track visualization and hit visualization are now possible, though it is designed primarily as a geometry debugger.
Since HEPVis/v-atlas runs within Athena, it has access to all transient data objects, including those associated with events (e.g. tracks, hits) and the detector geometry. Thus the visualization system accesses directly the same objects as are available within simulation, reconstruction, or analysis programs. HEPVis, the underlying library, has been a joint effort of several HEP institutes for a number of years. It's a set of HEP-specific extensions to the now open-source Open Inventor library. In addition to these libraries the package requires Motif.
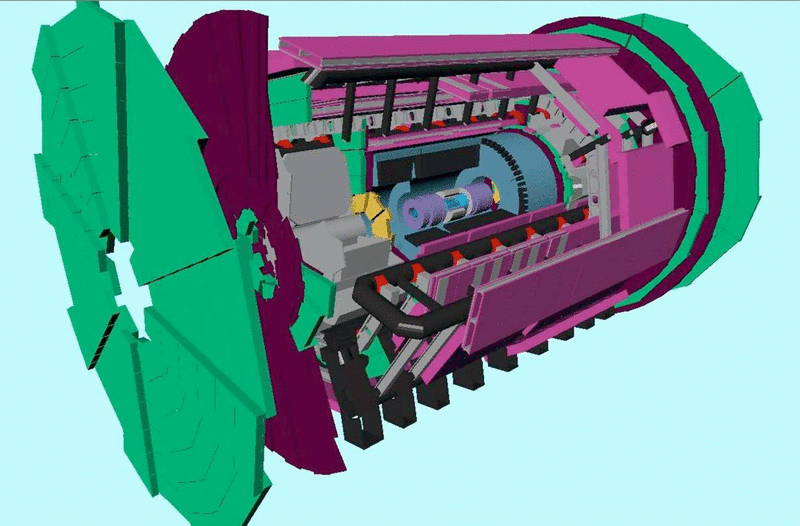
An example of the HEPVis/v-atlas display is shown in Figure 3-3.

|
The program is broken down into modular components, each of which can be activated from a menu within the application GUI. Events can be selected from the event filtering fields and arrows in the display. Control points can enlarge or reduce the display area, the Event Filtering area, and the text window. Modularity is achieved by implementing each component as a "System" which translates StoreGate objects into Geometry (i.e. into Open Inventor), and a "Controller" which creates a menu tightly linked to the corresponding component. Each component places certain demands upon system resources, especially upon CPU, memory, and graphics acceleration. Users can have these demands under control by launching only the components they need.
HEPVis/v-atlas contains a browser for the geometry, virtual meter sticks for measurement purposes, a display of tracking detector simulated hits, a display of calorimeter hits and calibration hits, a display of Monte Carlo truth information, a data browser used to obtain a printout of certain banks, a mechanism for co-displaying VRML files with the detector geometry and/or hits, a display of tracking surfaces and track parameters at various stages of a Kalman Filter track fit, and a "template system" which can be copied and adapted to the needs of individual users or user communities as a starting point for specialized display. The system is designed to be easily extended so that developers can customize the display to their own needs, and to allow every major analysis to have a dedicated HEPVis/v-atlas display.
The display works best when run locally, i.e., on a laptop or desktop computer under a distributed release of the ATLAS software. The highest level of performance is obtained when a local replica of the geometry database is installed. HEPVis/v-atlas uses the object-oriented geometry modelling toolkit Open Inventor, which uses Open GL for rendering. The highest level of graphics performance is available on machines with a hardware accelerated graphics card.
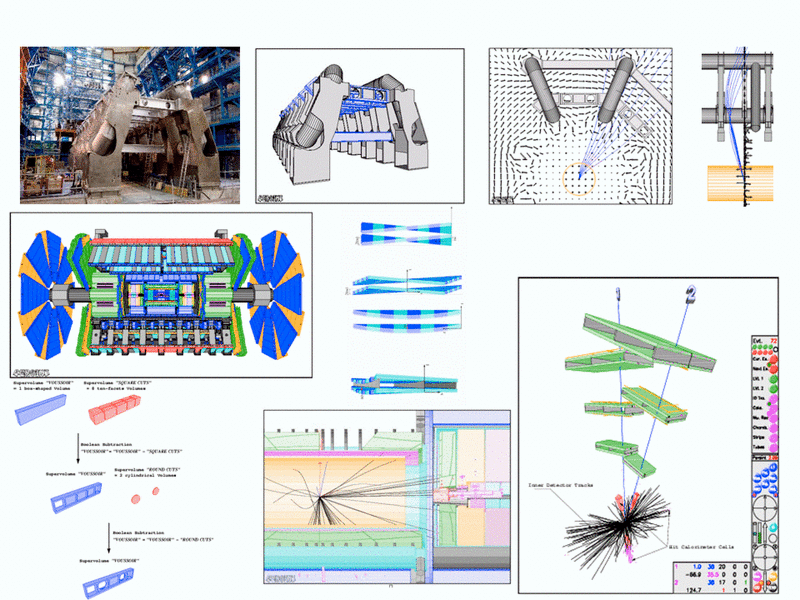
The Persint program [3-16] is designed for the three-dimensional visual representation of objects and for the interfacing and access to a variety of independent applications, in a fully interactive way. It was designed particularly to deal with the complex requirements of the muon spectrometer and the magnetic field components. An example of the Persint display is shown in Figure 3-4.
The display of objects and the interactivity between the user and objects or applications is realized through the use of a graphical interface. Facilities are provided for the spatial navigation and the definition of the visualization properties, allowing the viewing and viewed points to be specified interactively, and to obtain the desired perspective. In parallel, applications may be launched through the use of dedicated interfaces, such as the interactive reconstruction and display of physics events. All information about detectors description (e.g. identifiers) and tracks (e.g. parameters, multiple scattering plane, energy loss, number of X0) can be displayed by a simple click at any time.

|
Persint works in stand-alone mode but could work as an Athena algorithm, although this has not yet been implemented.
Particular characteristics of Persint are:
The alignment of the Muon chambers is included in the detector visualization.
In dealing with the detector geometry description, it is necessary to build complex geometrical objects and detect inconsistencies (clashes) in the layout. Using Boolean volumes is one way of achieving this. The XML-format of AGDD provides these features.
Persint is able to run the reconstruction program Muonboy interactively. This is indispensable for the debugging of, and making improvements to, any reconstruction program in the muon spectrometer. Its 3D capability is essential because there is no analytical description of the track in the complicated ATLAS magnetic field.
   |  |
Copyright © CERN 2005