

Compact Muon Solenoid
LHC, CERN
| CMS-PAS-BPH-15-005 | ||
| Quarkonium production cross sections in pp collisions at $\sqrt{s}=$ 13 TeV | ||
| CMS Collaboration | ||
| April 2016 | ||
| Abstract: Differential prompt production cross sections of $ \mathrm{J} / \psi $, $\psi \mathrm{(2S)}$, and $\Upsilon \mathrm{(nS)}$ (n = 1, 2, 3) vector mesons have been measured in pp collisions at 13 TeV, using data collected by the CMS detector in 2015, corresponding to an integrated luminosity of 2.4 fb$^{-1}$ for $ \mathrm{J} / \psi $, and 2.7 fb$^{-1}$ for the other mesons. The five S-wave quarkonium states were reconstructed in the dimuon decay channel, for dimuon rapidity $|y|<$ 1.2. For each state we present double-differential cross sections in several rapidity and transverse momentum ranges. | ||
|
Links:
CDS record (PDF) ;
inSPIRE record ;
CADI line (restricted) ;
These preliminary results are superseded in this paper, PLB 780 (2018) 251. The superseded preliminary plots can be found here. |
||
| Figures | Summary | Additional Figures | CMS Publications |
|---|
| Figures | |

png pdf |
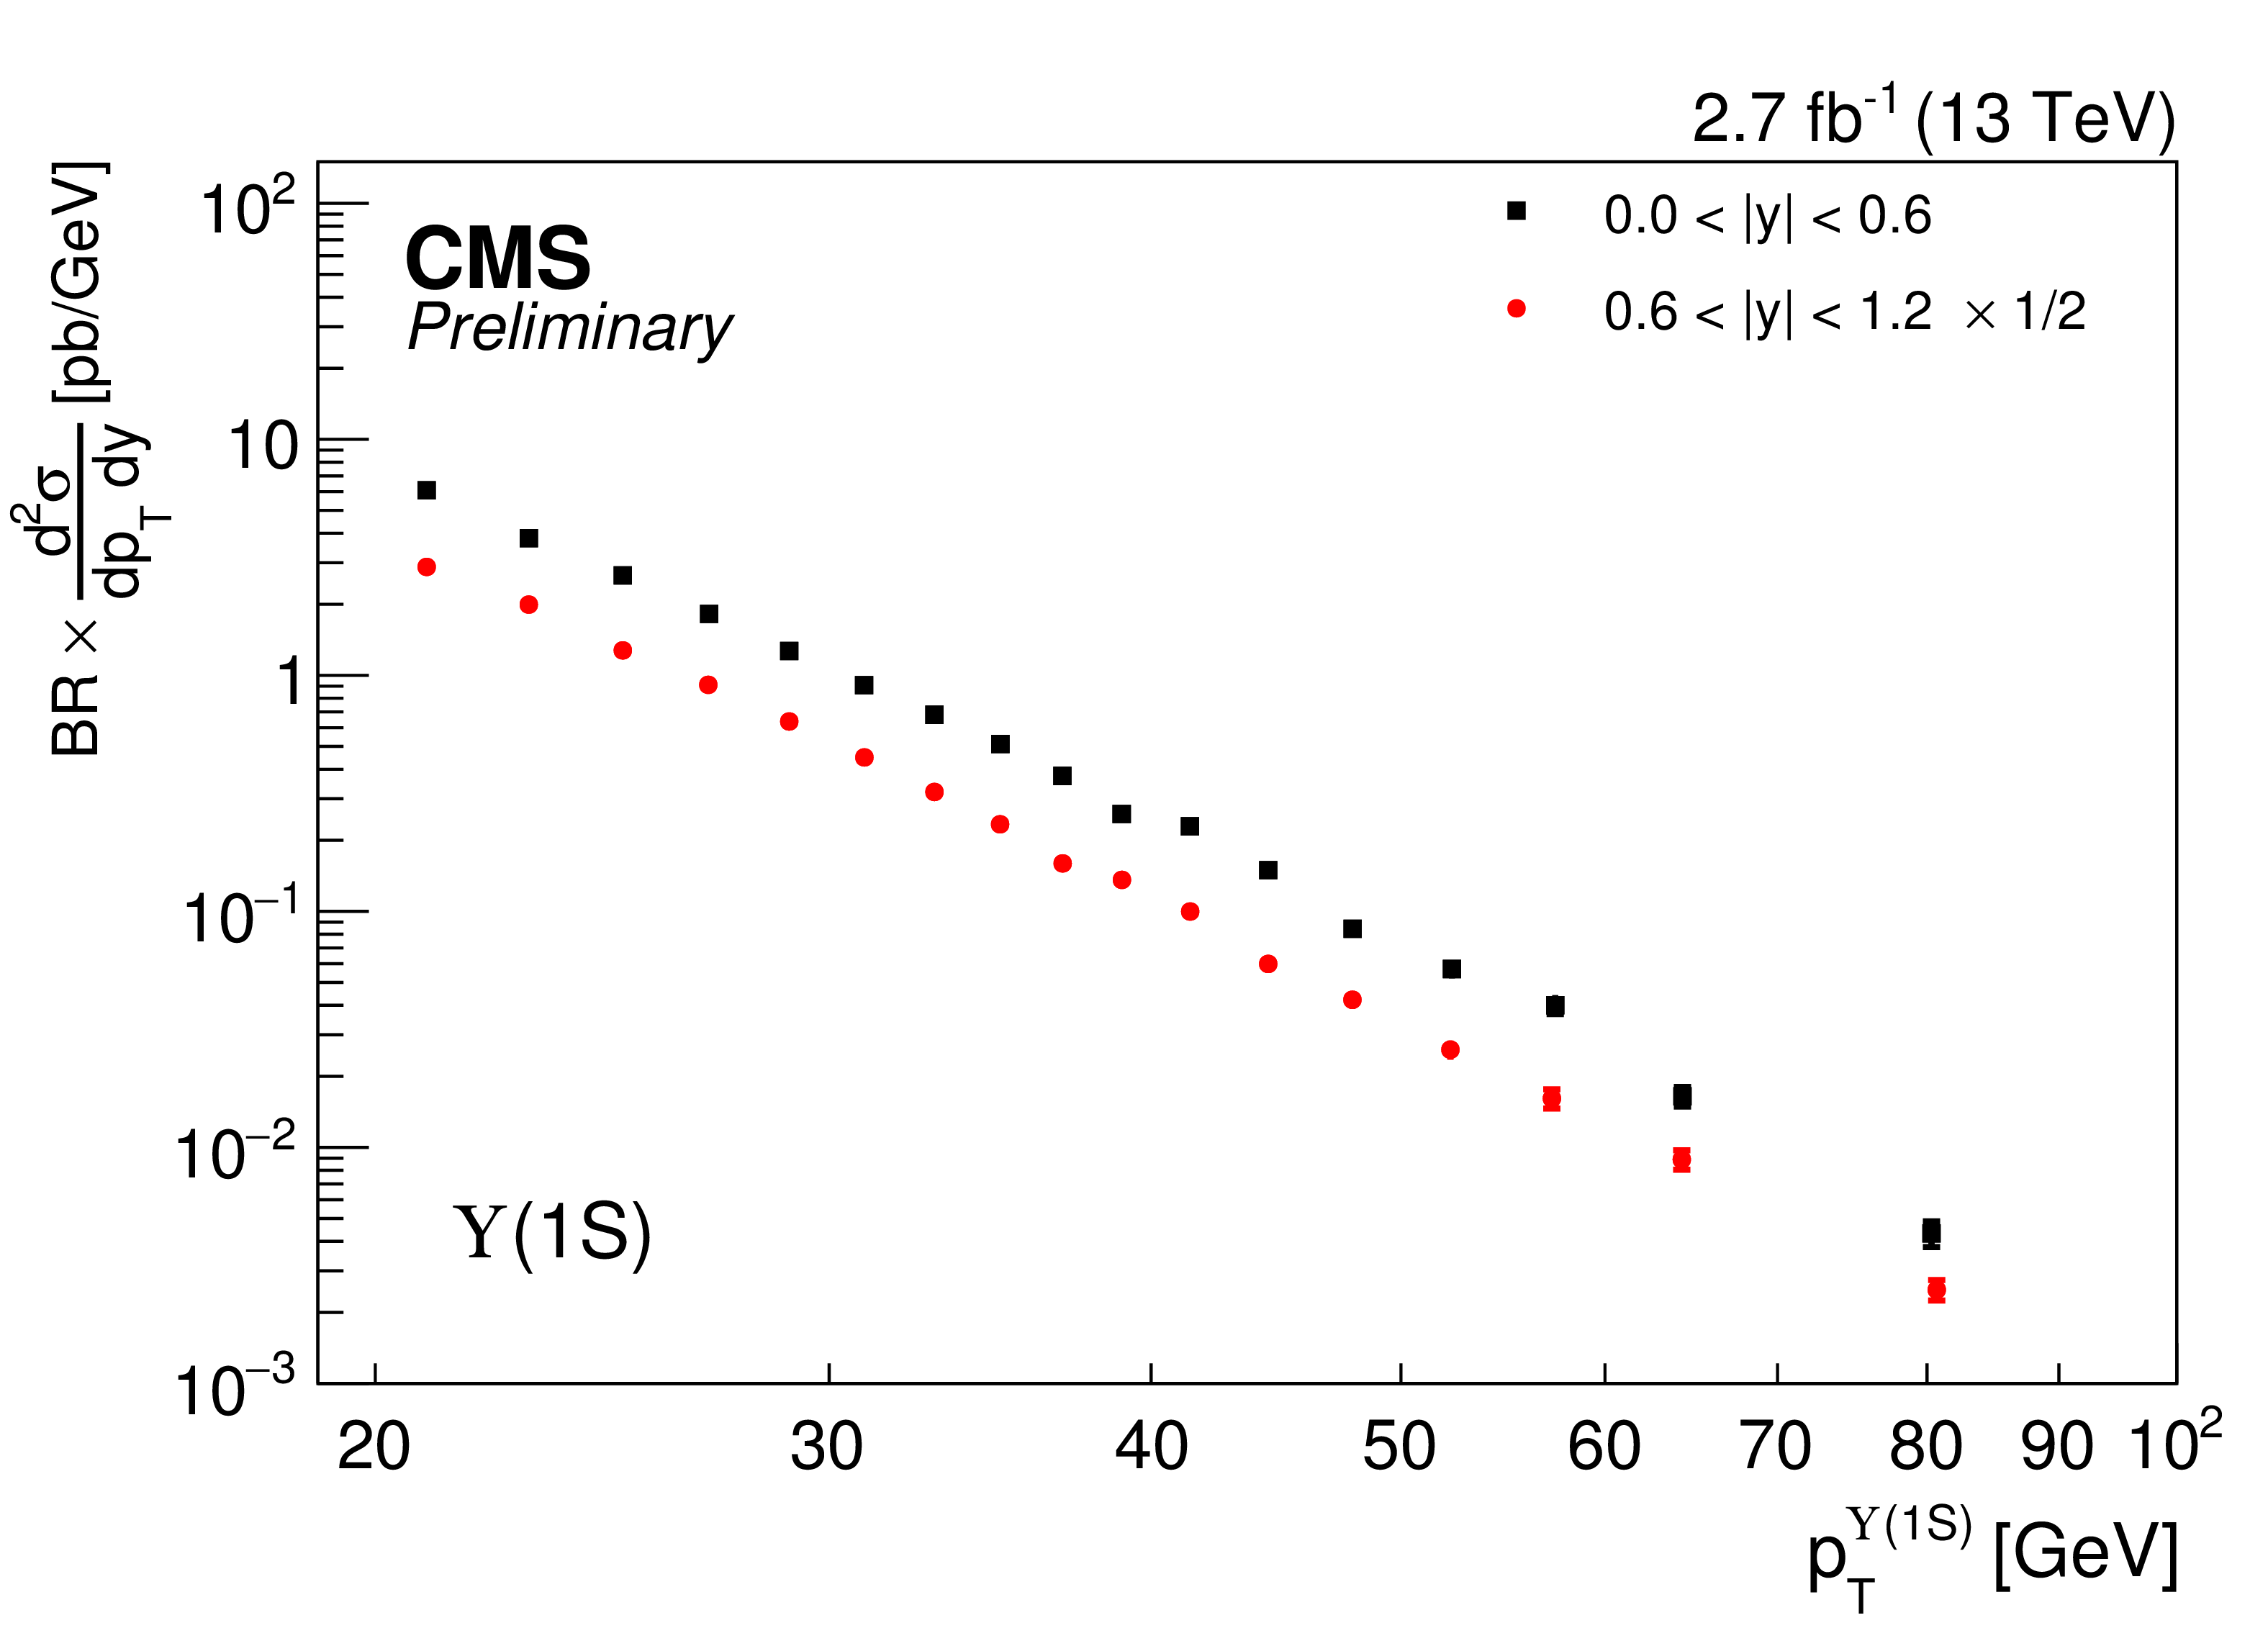
Figure 1-a:
Double-differential cross sections times branching ratios for the five mesons, as indicated in the figure, in several rapidity ranges, assuming isotropic dimuon decays. The inner error bars represent the statistical uncertainty while the total errors show the statistical and systematic uncertainties. The uncertainty on the luminosity measurement is not included. |

png pdf |
Figure 1-b:
Double-differential cross sections times branching ratios for the five mesons, as indicated in the figure, in several rapidity ranges, assuming isotropic dimuon decays. The inner error bars represent the statistical uncertainty while the total errors show the statistical and systematic uncertainties. The uncertainty on the luminosity measurement is not included. |
png pdf |
Figure 1-c:
Double-differential cross sections times branching ratios for the five mesons, as indicated in the figure, in several rapidity ranges, assuming isotropic dimuon decays. The inner error bars represent the statistical uncertainty while the total errors show the statistical and systematic uncertainties. The uncertainty on the luminosity measurement is not included. |

png pdf |
Figure 1-d:
Double-differential cross sections times branching ratios for the five mesons, as indicated in the figure, in several rapidity ranges, assuming isotropic dimuon decays. The inner error bars represent the statistical uncertainty while the total errors show the statistical and systematic uncertainties. The uncertainty on the luminosity measurement is not included. |

png pdf |
Figure 1-e:
Double-differential cross sections times branching ratios for the five mesons, as indicated in the figure, in several rapidity ranges, assuming isotropic dimuon decays. The inner error bars represent the statistical uncertainty while the total errors show the statistical and systematic uncertainties. The uncertainty on the luminosity measurement is not included. |

png pdf |
Figure 2-a:
Differential cross sections times branching ratios for 7 TeV [6,7] and 13 TeV CMS data, for $\psi \mathrm{nS}$ (a) and $\Upsilon \mathrm{(nS)}$ (b), for $|y| <$ 1.2, assuming isotropic dimuon decays. The inner error bars represent the statistical uncertainty while the total errors show the statistical and systematic uncertainties. The uncertainty on the luminosity measurement is not included. |

png pdf |
Figure 2-b:
Differential cross sections times branching ratios for 7 TeV [6,7] and 13 TeV CMS data, for $\psi \mathrm{nS}$ (a) and $\Upsilon \mathrm{(nS)}$ (b), for $|y| <$ 1.2, assuming isotropic dimuon decays. The inner error bars represent the statistical uncertainty while the total errors show the statistical and systematic uncertainties. The uncertainty on the luminosity measurement is not included. |
png pdf |
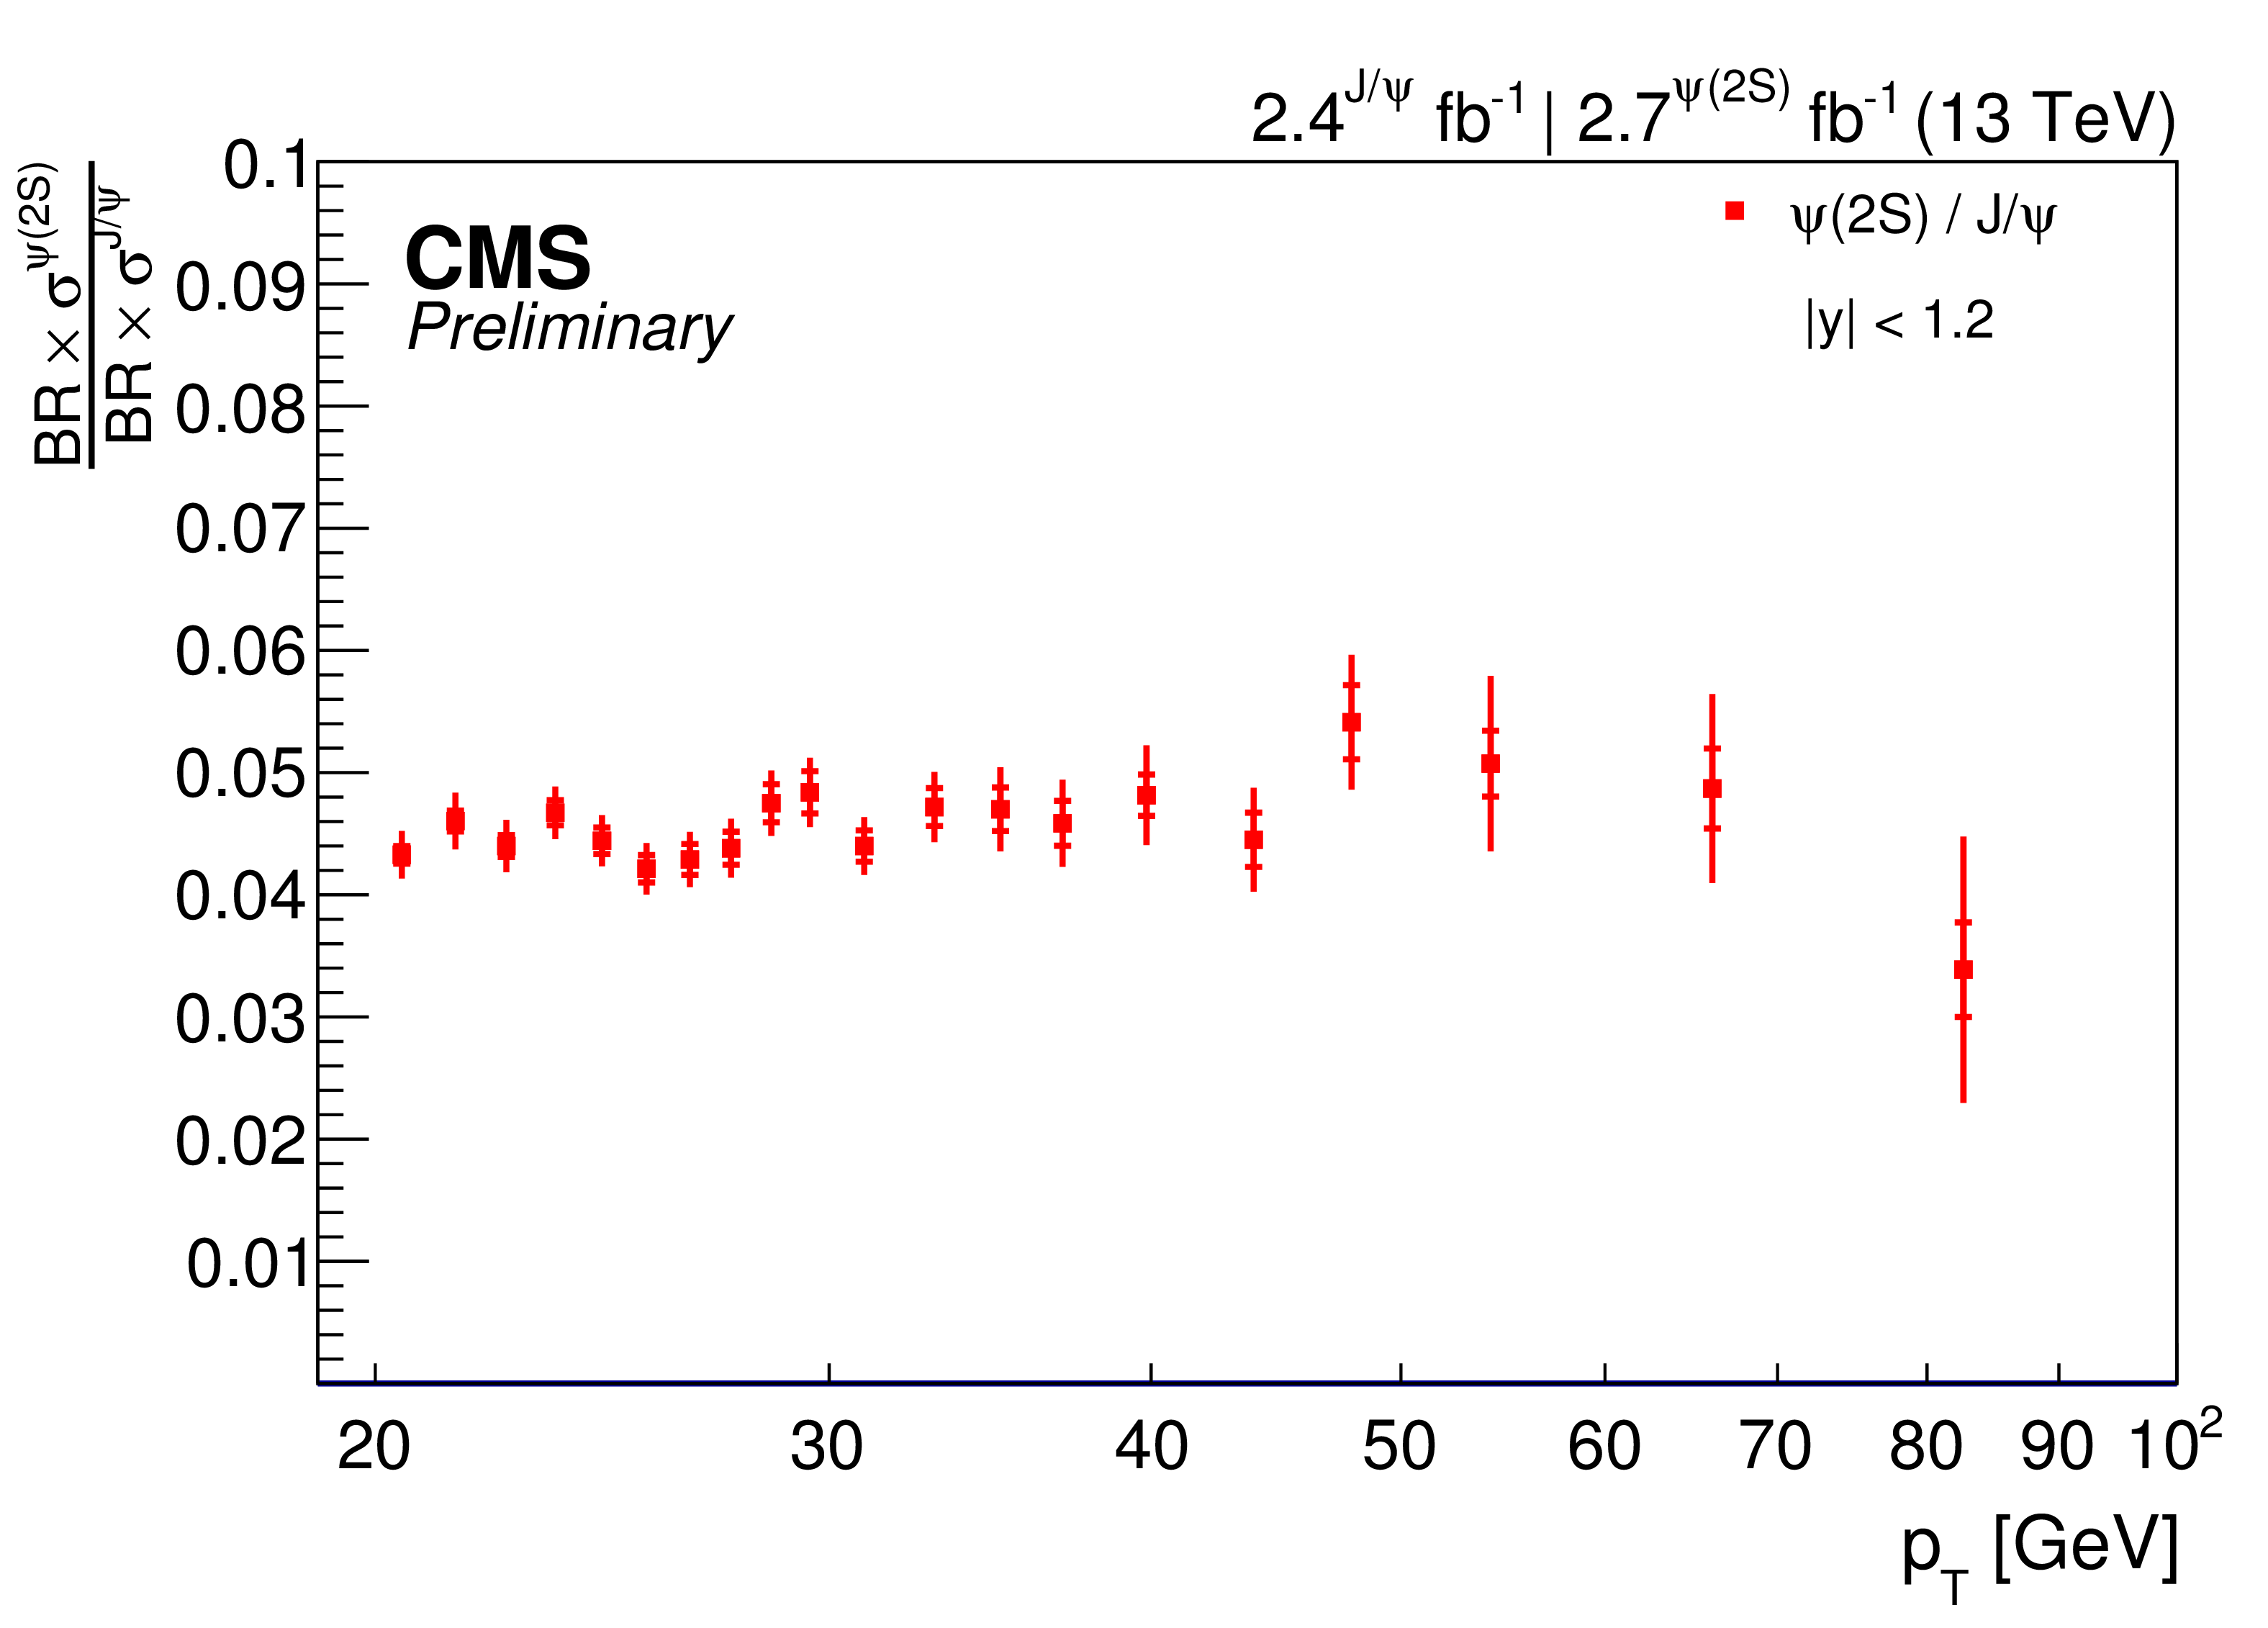
Figure 3-a:
Differential cross section ratios of prompt $\psi \mathrm{(2S)}$ to $ \mathrm{J} / \psi $ (a), and $\Upsilon \mathrm{(2S)}$ to $\Upsilon \mathrm{(1S)}$ and $\Upsilon \mathrm{(3S)}$ to $\Upsilon \mathrm{(1S)}$ (b) at 13 TeV for $|y| < $ 1.2. The inner error bars represent the statistical uncertainty while the total errors show the statistical and systematic uncertainties. |

png pdf |
Figure 3-b:
Differential cross section ratios of prompt $\psi \mathrm{(2S)}$ to $ \mathrm{J} / \psi $ (a), and $\Upsilon \mathrm{(2S)}$ to $\Upsilon \mathrm{(1S)}$ and $\Upsilon \mathrm{(3S)}$ to $\Upsilon \mathrm{(1S)}$ (b) at 13 TeV for $|y| < $ 1.2. The inner error bars represent the statistical uncertainty while the total errors show the statistical and systematic uncertainties. |
png pdf |
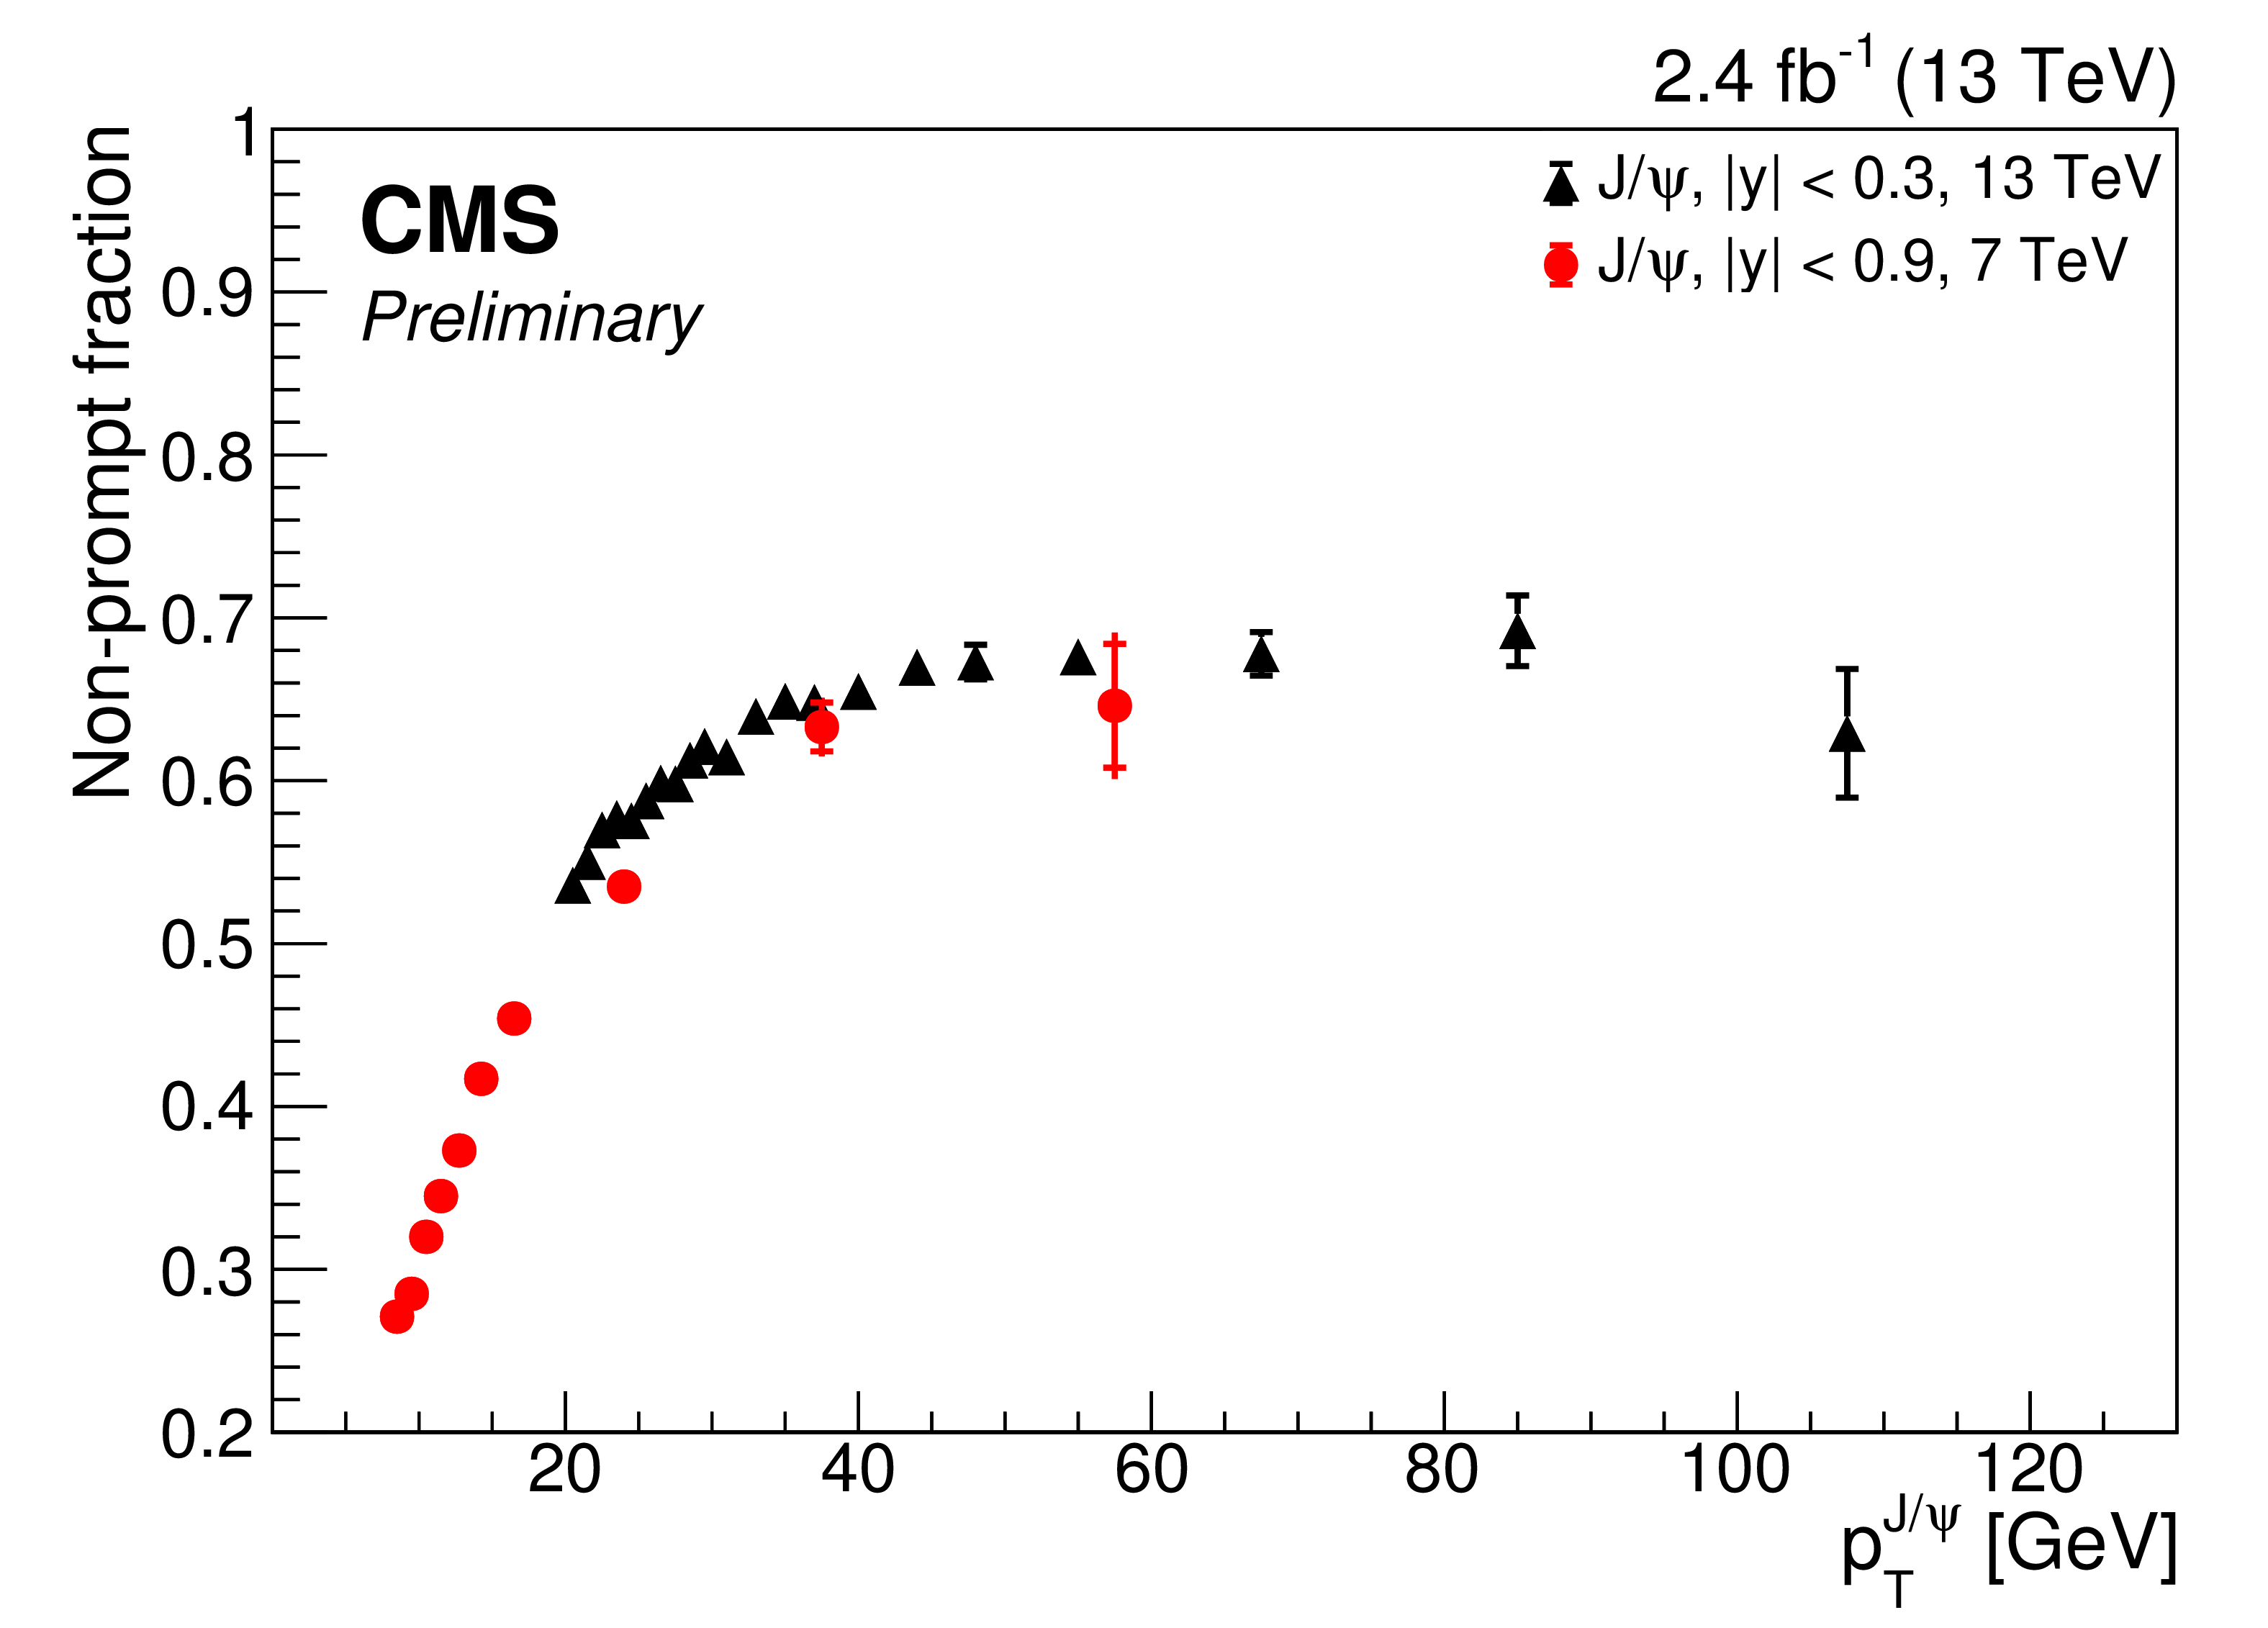
Figure 4-a:
Comparison of the non-prompt fraction of $ \mathrm{J} / \psi $ (a) and $\psi \mathrm{(2S)}$ (b) as a function of dimuon ${p_{\mathrm {T}}}$ for 13 TeV and 7 TeV [24]. The inner error bars represent the statistical uncertainty while the total errors show the statistical and systematic uncertainties. |

png pdf |
Figure 4-b:
Comparison of the non-prompt fraction of $ \mathrm{J} / \psi $ (a) and $\psi \mathrm{(2S)}$ (b) as a function of dimuon ${p_{\mathrm {T}}}$ for 13 TeV and 7 TeV [24]. The inner error bars represent the statistical uncertainty while the total errors show the statistical and systematic uncertainties. |
| Summary |
| The double differential production cross sections of $ \mathrm{J} / \psi $, $\psi$ and $ \mathrm{\Upsilon(nS)} $ (n =1, 2, 3) have been measured in pp collisions at $\sqrt{s}=$ 13 TeV with the CMS detector at the LHC. The measurement has been performed in the central rapidity region ($|y|<$ 1.2) as a function of $ p_{\mathrm{T}} $ in several rapidity ranges, extending up to 120 GeV for the $ \mathrm{J} / \psi $ and up to 100 GeV for the remaining states. Ratios of cross sections measured at 13 TeV and 7 TeV are included in this report, as well as the ratios between the cross sections of the excited states decaying to $\mu^{-}\mu^{+}$. These results shall contribute to consolidate the underlying hypotheses of NRQCD and provide further input to constrain the theory parameters. |
| Additional Figures | |

png pdf |
Additional Figure 1-a:
Dimuon mass distribution and fitted curves for $ \mathrm{J} / \psi $ in a given (${p_{\mathrm {T}}}$, $y$) range. |
png pdf |
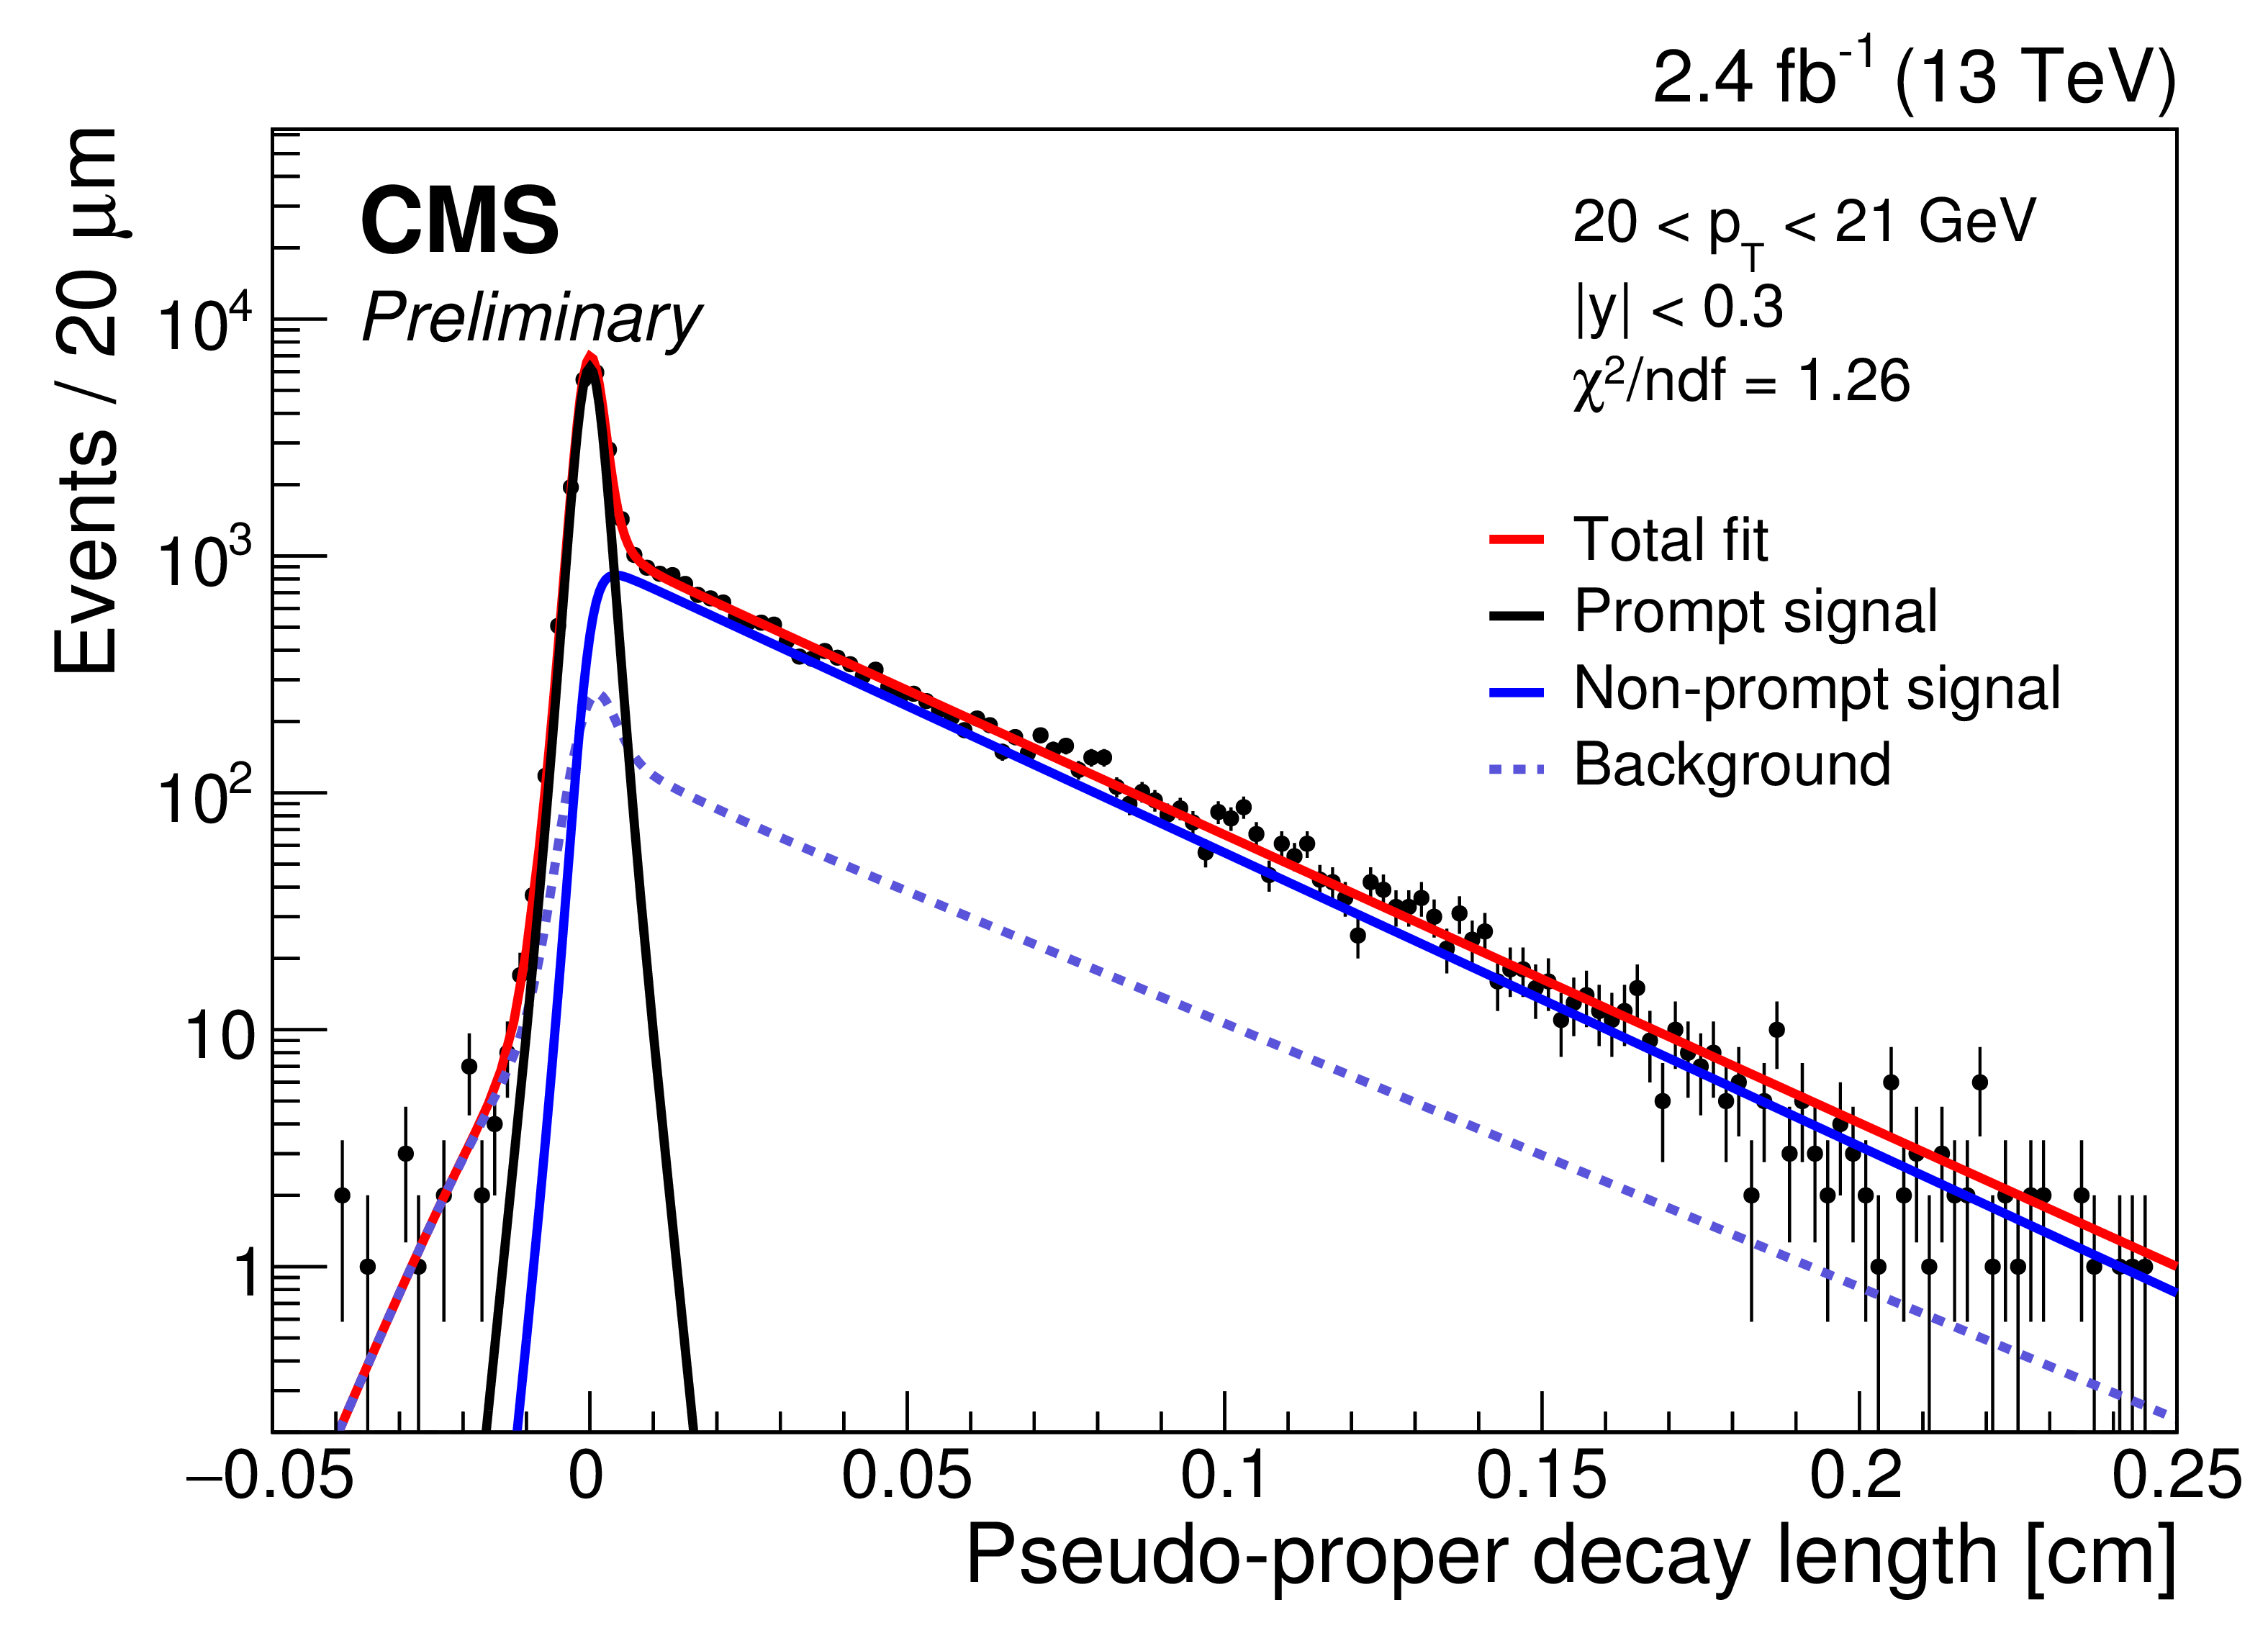
Additional Figure 1-b:
Pseudo-proper decay length distribution and fitted curves for $ \mathrm{J} / \psi $ in a given (${p_{\mathrm {T}}}$, $y$) range. |

png pdf |
Additional Figure 2-a:
Dimuon mass distribution and fitted curves for $\psi \mathrm{(2S)}$ in a given (${p_{\mathrm {T}}}$, $y$) range. |

png pdf |
Additional Figure 2-b:
Pseudo-proper decay length distribution and fitted curves for $\psi \mathrm{(2S)}$ in a given (${p_{\mathrm {T}}}$, $y$) range. |

png pdf |
Additional Figure 3:
Dimuon mass distribution and fitted curves for $\Upsilon \mathrm{(nS)}$ in a given (${p_{\mathrm {T}}}$, $y$) range. |
|
|
Compact Muon Solenoid LHC, CERN |
|

|

|

|

|

|