

Compact Muon Solenoid
LHC, CERN
| CMS-PAS-EXO-16-019 | ||
| Search for high-mass resonances in $\mathrm{Z} \gamma \rightarrow \mathrm{ e^+e^- } \gamma/\mu^+\mu^-\gamma$ final states in proton-proton collisions at $\sqrt{s}=$ 13 TeV | ||
| CMS Collaboration | ||
| March 2016 | ||
| Abstract: A search for a heavy resonance decaying to $\mathrm{ Z } \gamma$, with the Z boson further decaying to pairs of electrons or muons is presented. The search makes use of 13 TeV proton-proton collision data collected by the CMS experiment at the LHC, corresponding to an integrated luminosity of 2.7 fb$^{-1}$. The analysis extracts the background directly from data, through an unbinned likelihood fit. No significant excess over the background-only hypothesis is observed, therefore limits at 95% confidence level are set on the production cross section of particles with a mass between 350 GeV and 2 TeV, with two different assumptions on the resonance width. | ||
| Links: CDS record (PDF) ; inSPIRE record ; CADI line (restricted) ; | ||
| Figures | Summary | Additional Figures | CMS Publications |
|---|
| Figures | |

png pdf |
Figure 1:
Expected signal efficiency after full selections, as a function of the generated resonance mass, for the $ \mathrm{e^+e^-\gamma } $ (red) and $ {\mu ^+\mu ^-\gamma } $ (blue) channels in narrow-width signals. |

png pdf |
Figure 2-a:
Fits of the $ {m_{\mathrm{ Z\gamma } } } $ distribution in the data, for the $ \mathrm{e^+e^-\gamma } $ channel (a) and the $ {\mu ^+\mu ^-\gamma } $ channel (b). Data are shown as black markers, in bins of 20 GeV, and the fitted function is represented by a red line, with the 68% uncertainty band as gray shade. |
png pdf |
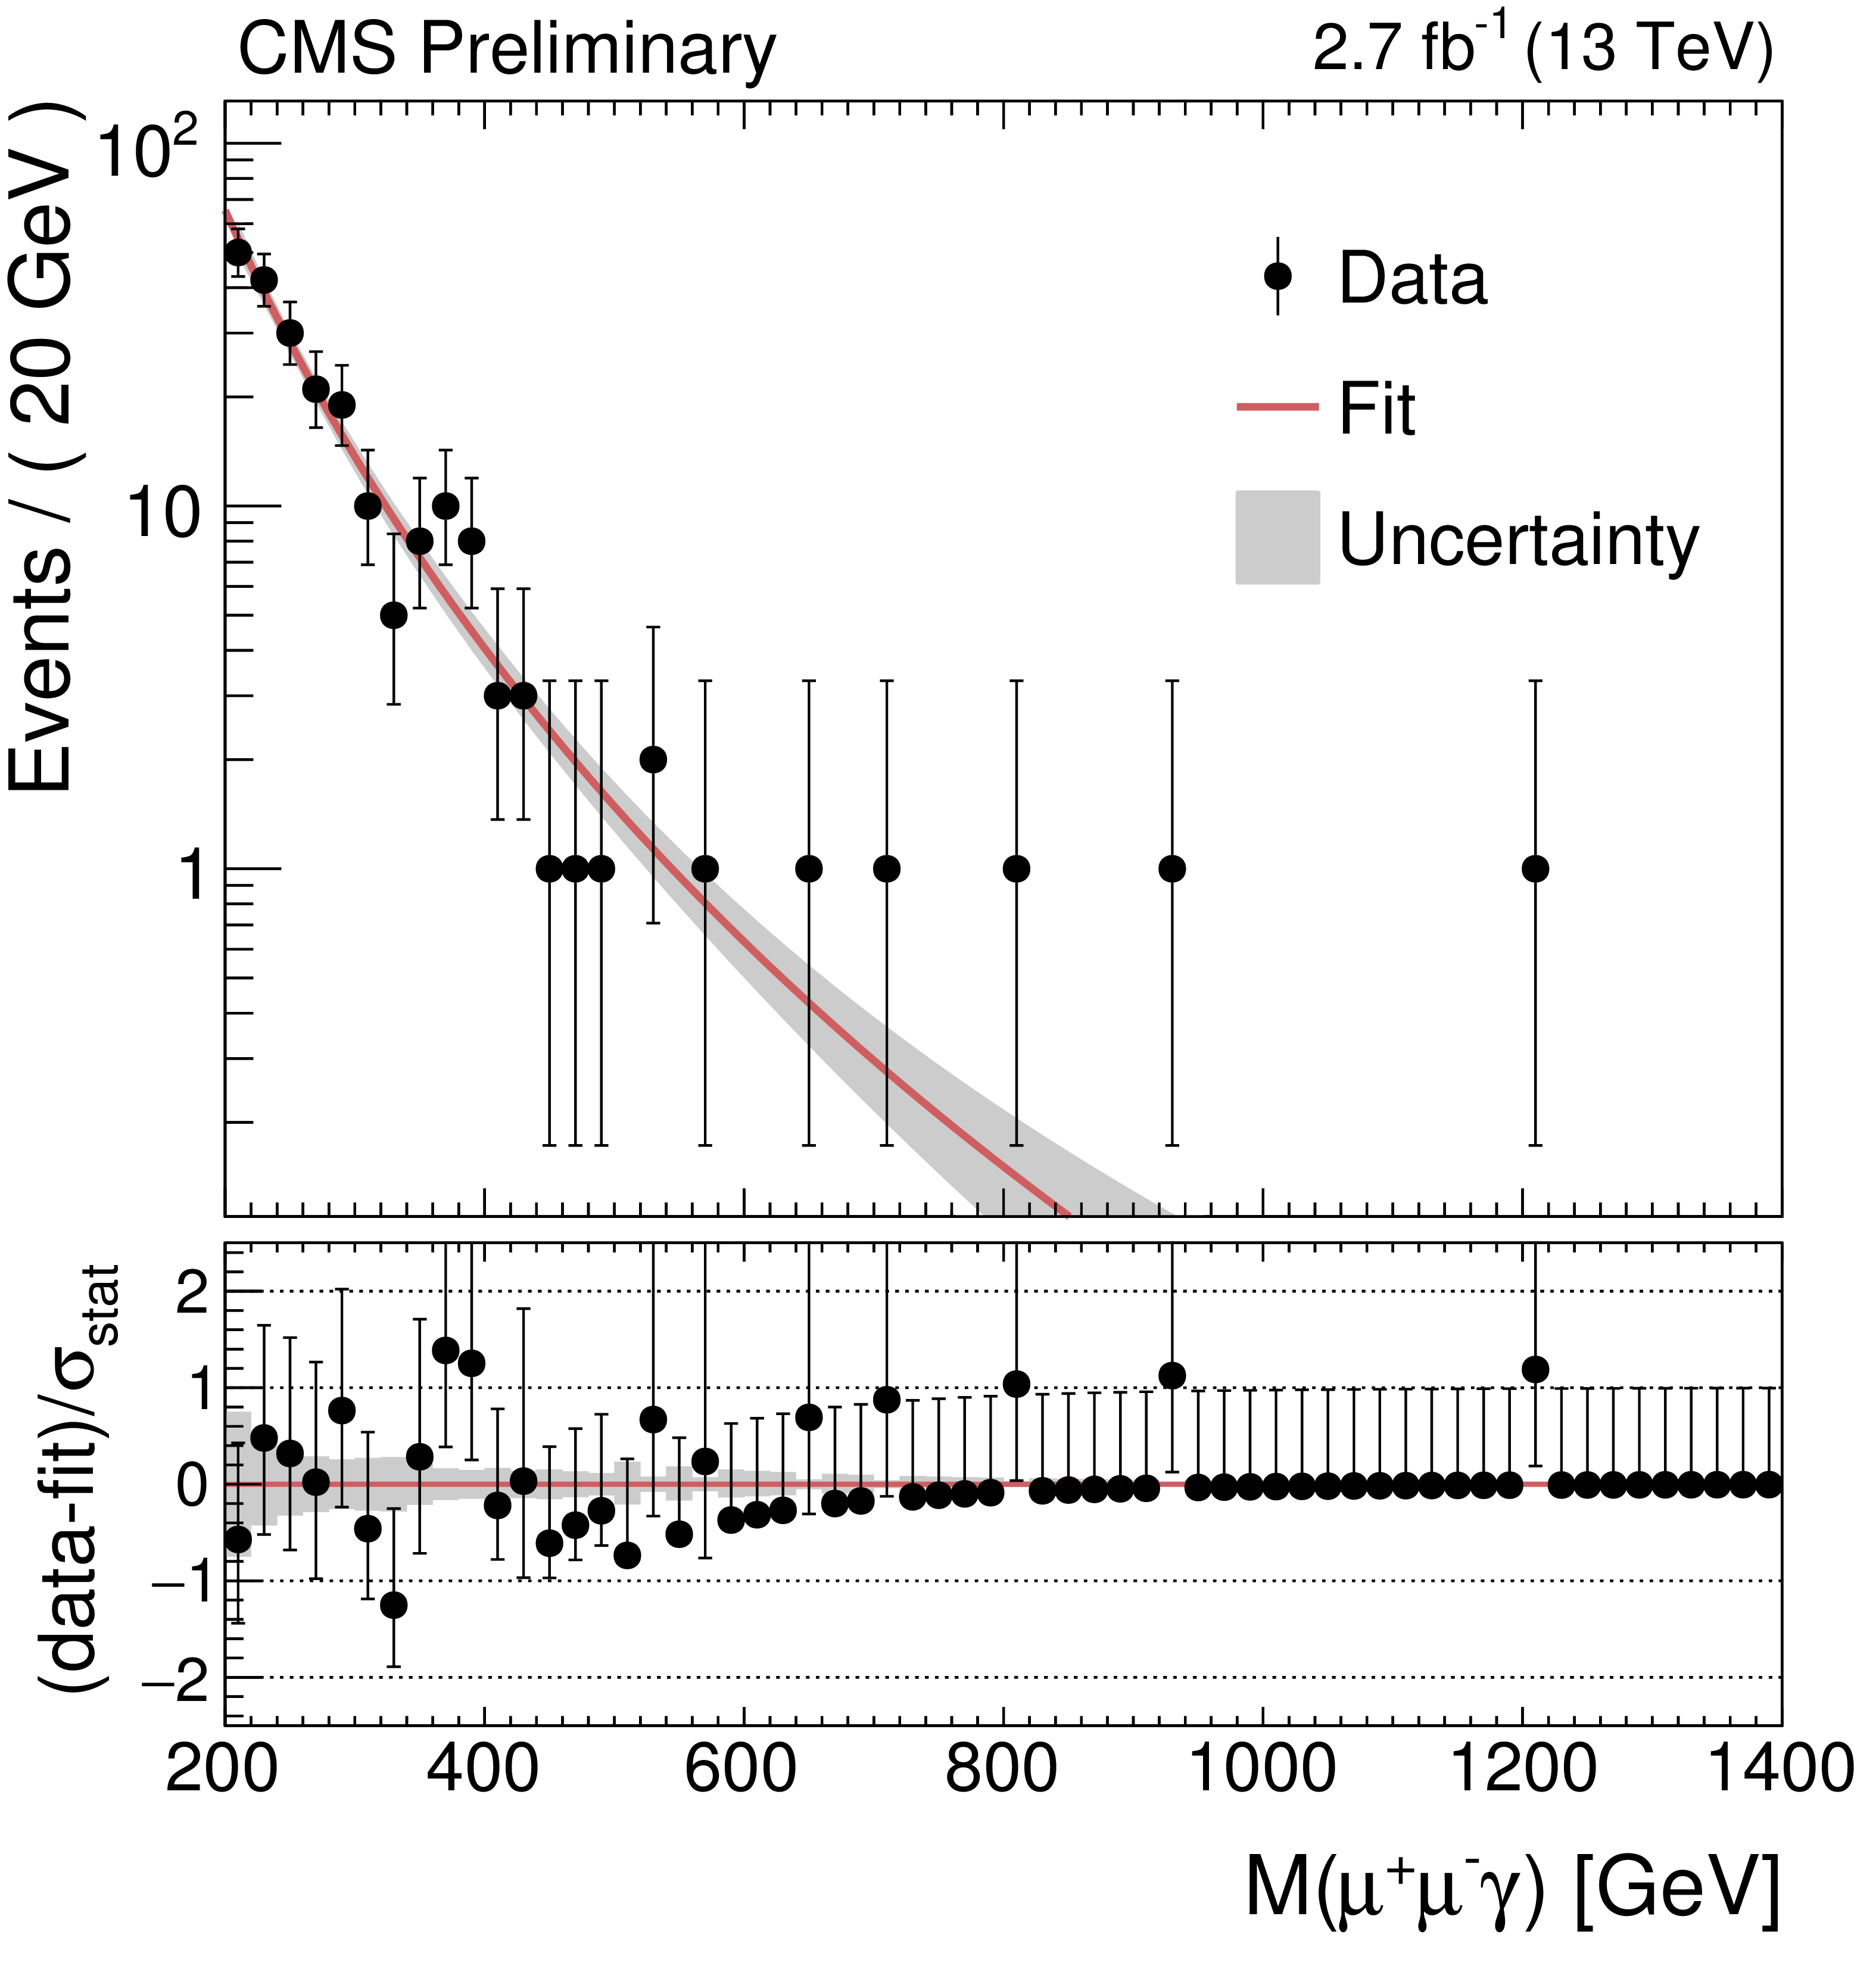
Figure 2-b:
Fits of the $ {m_{\mathrm{ Z\gamma } } } $ distribution in the data, for the $ \mathrm{e^+e^-\gamma } $ channel (a) and the $ {\mu ^+\mu ^-\gamma } $ channel (b). Data are shown as black markers, in bins of 20 GeV, and the fitted function is represented by a red line, with the 68% uncertainty band as gray shade. |
png pdf |
Figure 3-a:
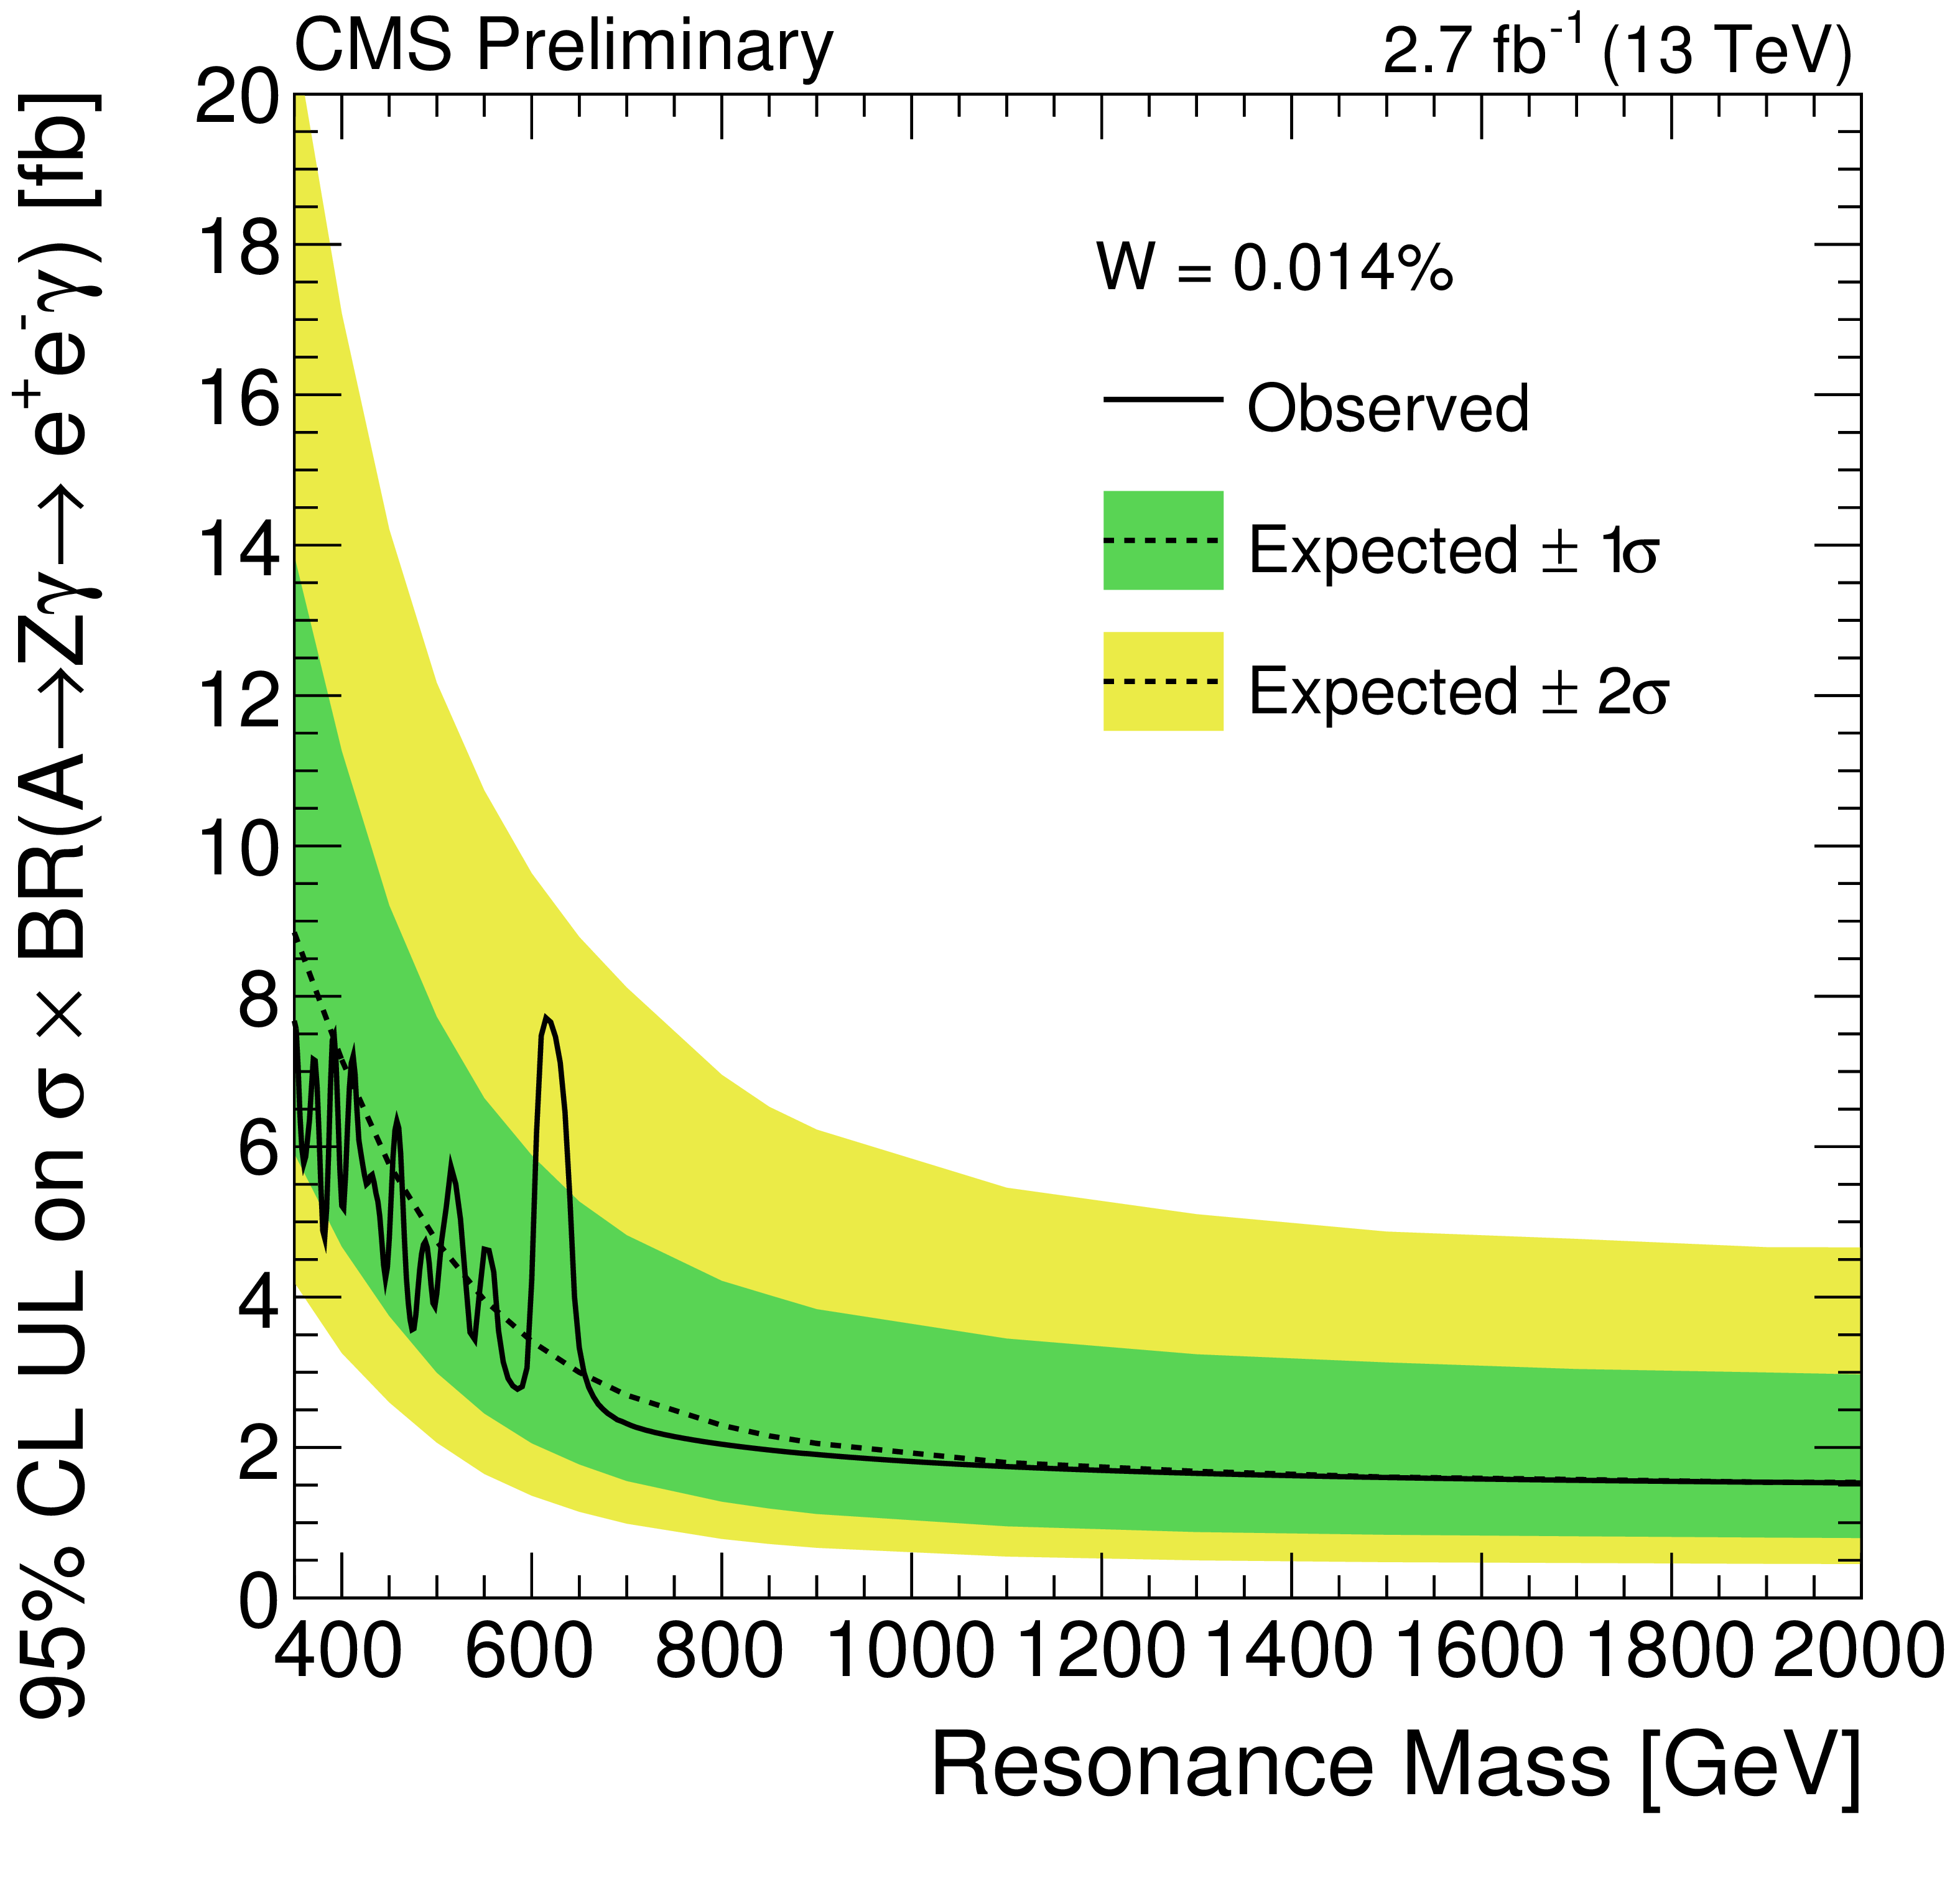
Observed (solid) and expected (dashed) 95% C.L. exclusion limits on $\sigma ( \mathrm{ A \rightarrow Z \gamma \rightarrow \ell ^{+}\ell ^{-}\gamma }) $, as a function of signal mass, together with the 68% and 95% ranges of expectation in the background-only hypothesis, separately for the $ \mathrm{e^+e^-\gamma } $ (a) and $ {\mu ^+\mu ^-\gamma } $ (b) channels. The top row shows limits on a narrow width signal, the bottom row on a wide width signal. |

png pdf |
Figure 3-b:
Observed (solid) and expected (dashed) 95% C.L. exclusion limits on $\sigma ( \mathrm{ A \rightarrow Z \gamma \rightarrow \ell ^{+}\ell ^{-}\gamma }) $, as a function of signal mass, together with the 68% and 95% ranges of expectation in the background-only hypothesis, separately for the $ \mathrm{e^+e^-\gamma } $ (a) and $ {\mu ^+\mu ^-\gamma } $ (b) channels. The top row shows limits on a narrow width signal, the bottom row on a wide width signal. |

png pdf |
Figure 3-c:
Observed (solid) and expected (dashed) 95% C.L. exclusion limits on $\sigma ( \mathrm{ A \rightarrow Z \gamma \rightarrow \ell ^{+}\ell ^{-}\gamma }) $, as a function of signal mass, together with the 68% and 95% ranges of expectation in the background-only hypothesis, separately for the $ \mathrm{e^+e^-\gamma } $ (a) and $ {\mu ^+\mu ^-\gamma } $ (b) channels. The top row shows limits on a narrow width signal, the bottom row on a wide width signal. |

png pdf |
Figure 3-d:
Observed (solid) and expected (dashed) 95% C.L. exclusion limits on $\sigma ( \mathrm{ A \rightarrow Z \gamma \rightarrow \ell ^{+}\ell ^{-}\gamma }) $, as a function of signal mass, together with the 68% and 95% ranges of expectation in the background-only hypothesis, separately for the $ \mathrm{e^+e^-\gamma } $ (a) and $ {\mu ^+\mu ^-\gamma } $ (b) channels. The top row shows limits on a narrow width signal, the bottom row on a wide width signal. |

png pdf |
Figure 4-a:
Observed (solid) and expected(dashed) 95% C.L. exclusion limits on $\sigma ( \mathrm{ A \rightarrow Z \gamma } )$ as a function of signal mass, together with the 68% (green) and 95% (yellow) ranges of expectation in the background-only hypothesis. The range 350 $< {m_{\mathrm{Z}\gamma }} <$ 2000 GeV is shown, for narrow width (a) and wide width signals (b). |

png pdf |
Figure 4-b:
Observed (solid) and expected(dashed) 95% C.L. exclusion limits on $\sigma ( \mathrm{ A \rightarrow Z \gamma } )$ as a function of signal mass, together with the 68% (green) and 95% (yellow) ranges of expectation in the background-only hypothesis. The range 350 $< {m_{\mathrm{Z}\gamma }} <$ 2000 GeV is shown, for narrow width (a) and wide width signals (b). |
| Summary |
| A search for heavy resonances with mass between 350 GeV and 2 TeV decaying to $\mathrm{Z} \gamma$, with further decay $\mathrm{Z} \rightarrow \ell^+\ell^-$, with $\ell = \mathrm{e}$, $\mu$, has been presented. The search makes use of 13 TeV proton-proton collision data collected by the CMS experiment at the LHC, corresponding to an integrated luminosity of 2.7 fb$^{-1}$. The search strategy measures the non-resonant background directly on data, and looks for localized excesses. No significant excess over the Standard Model expectation is found, and limits at 95% confidence level are set on the production cross section of resonances for masses between 350 GeV and 2 TeV for two different hypothetical signal widths. |
| Additional Figures | |

png pdf |
Additional Figure 1-a:
The invariant mass spectra of $\mathrm{ Z(e^+e^-)\gamma } $ events. The points with error bars represent the data. The stacked histograms represent the expectations from $\mathrm{ Z\gamma } $ and Z+jets SM processes. The gray bands indicate the background uncertainty. The ratio of the data to the background prediction is shown at the bottom. |

png pdf |
Additional Figure 1-b:
The invariant mass spectra of $\mathrm{ Z(\mu ^+\mu ^-)\gamma } $ events. The points with error bars represent the data. The stacked histograms represent the expectations from $\mathrm{ Z\gamma } $ and Z+jets SM processes. The gray bands indicate the background uncertainty. The ratio of the data to the background prediction is shown at the bottom. |
|
|
Compact Muon Solenoid LHC, CERN |
|

|

|

|

|

|