

Compact Muon Solenoid
LHC, CERN
| CMS-PAS-FSQ-15-008 | ||
| Measurement of pseudorapidity distributions of charged particles in proton-proton collisions at $\sqrt{s} = $ 13 TeV | ||
| CMS Collaboration | ||
| April 2016 | ||
| Abstract: Pseudorapidity distributions of charged particles, $\mathrm{d}N_{\mathrm{ch}}/\mathrm{d}\eta$, produced in proton-proton collisions at a centre-of-mass energy $\sqrt{s} =$ 13 TeV are measured in the pseudorapidity range $|\eta| < $ 2.4 for charged particles with a transverse momentum $p_{\mathrm T} > $ 0.5 GeV. Measurements are presented for four event categories. The first two categories correspond to inclusive and inelastic-enhanced event samples. The other two categories are disjoint subsets of the inelastic-enhanced event sample that are either enhanced or depleted in single diffractive dissociation events. The measurements are compared to predictions from Monte Carlo event generators which were tuned to describe the underlying event properties at lower centre-of-mass energies. | ||
| Links: CDS record (PDF) ; inSPIRE record ; CADI line (restricted) ; | ||
| Figures | |
png pdf |
Figure 1-a:
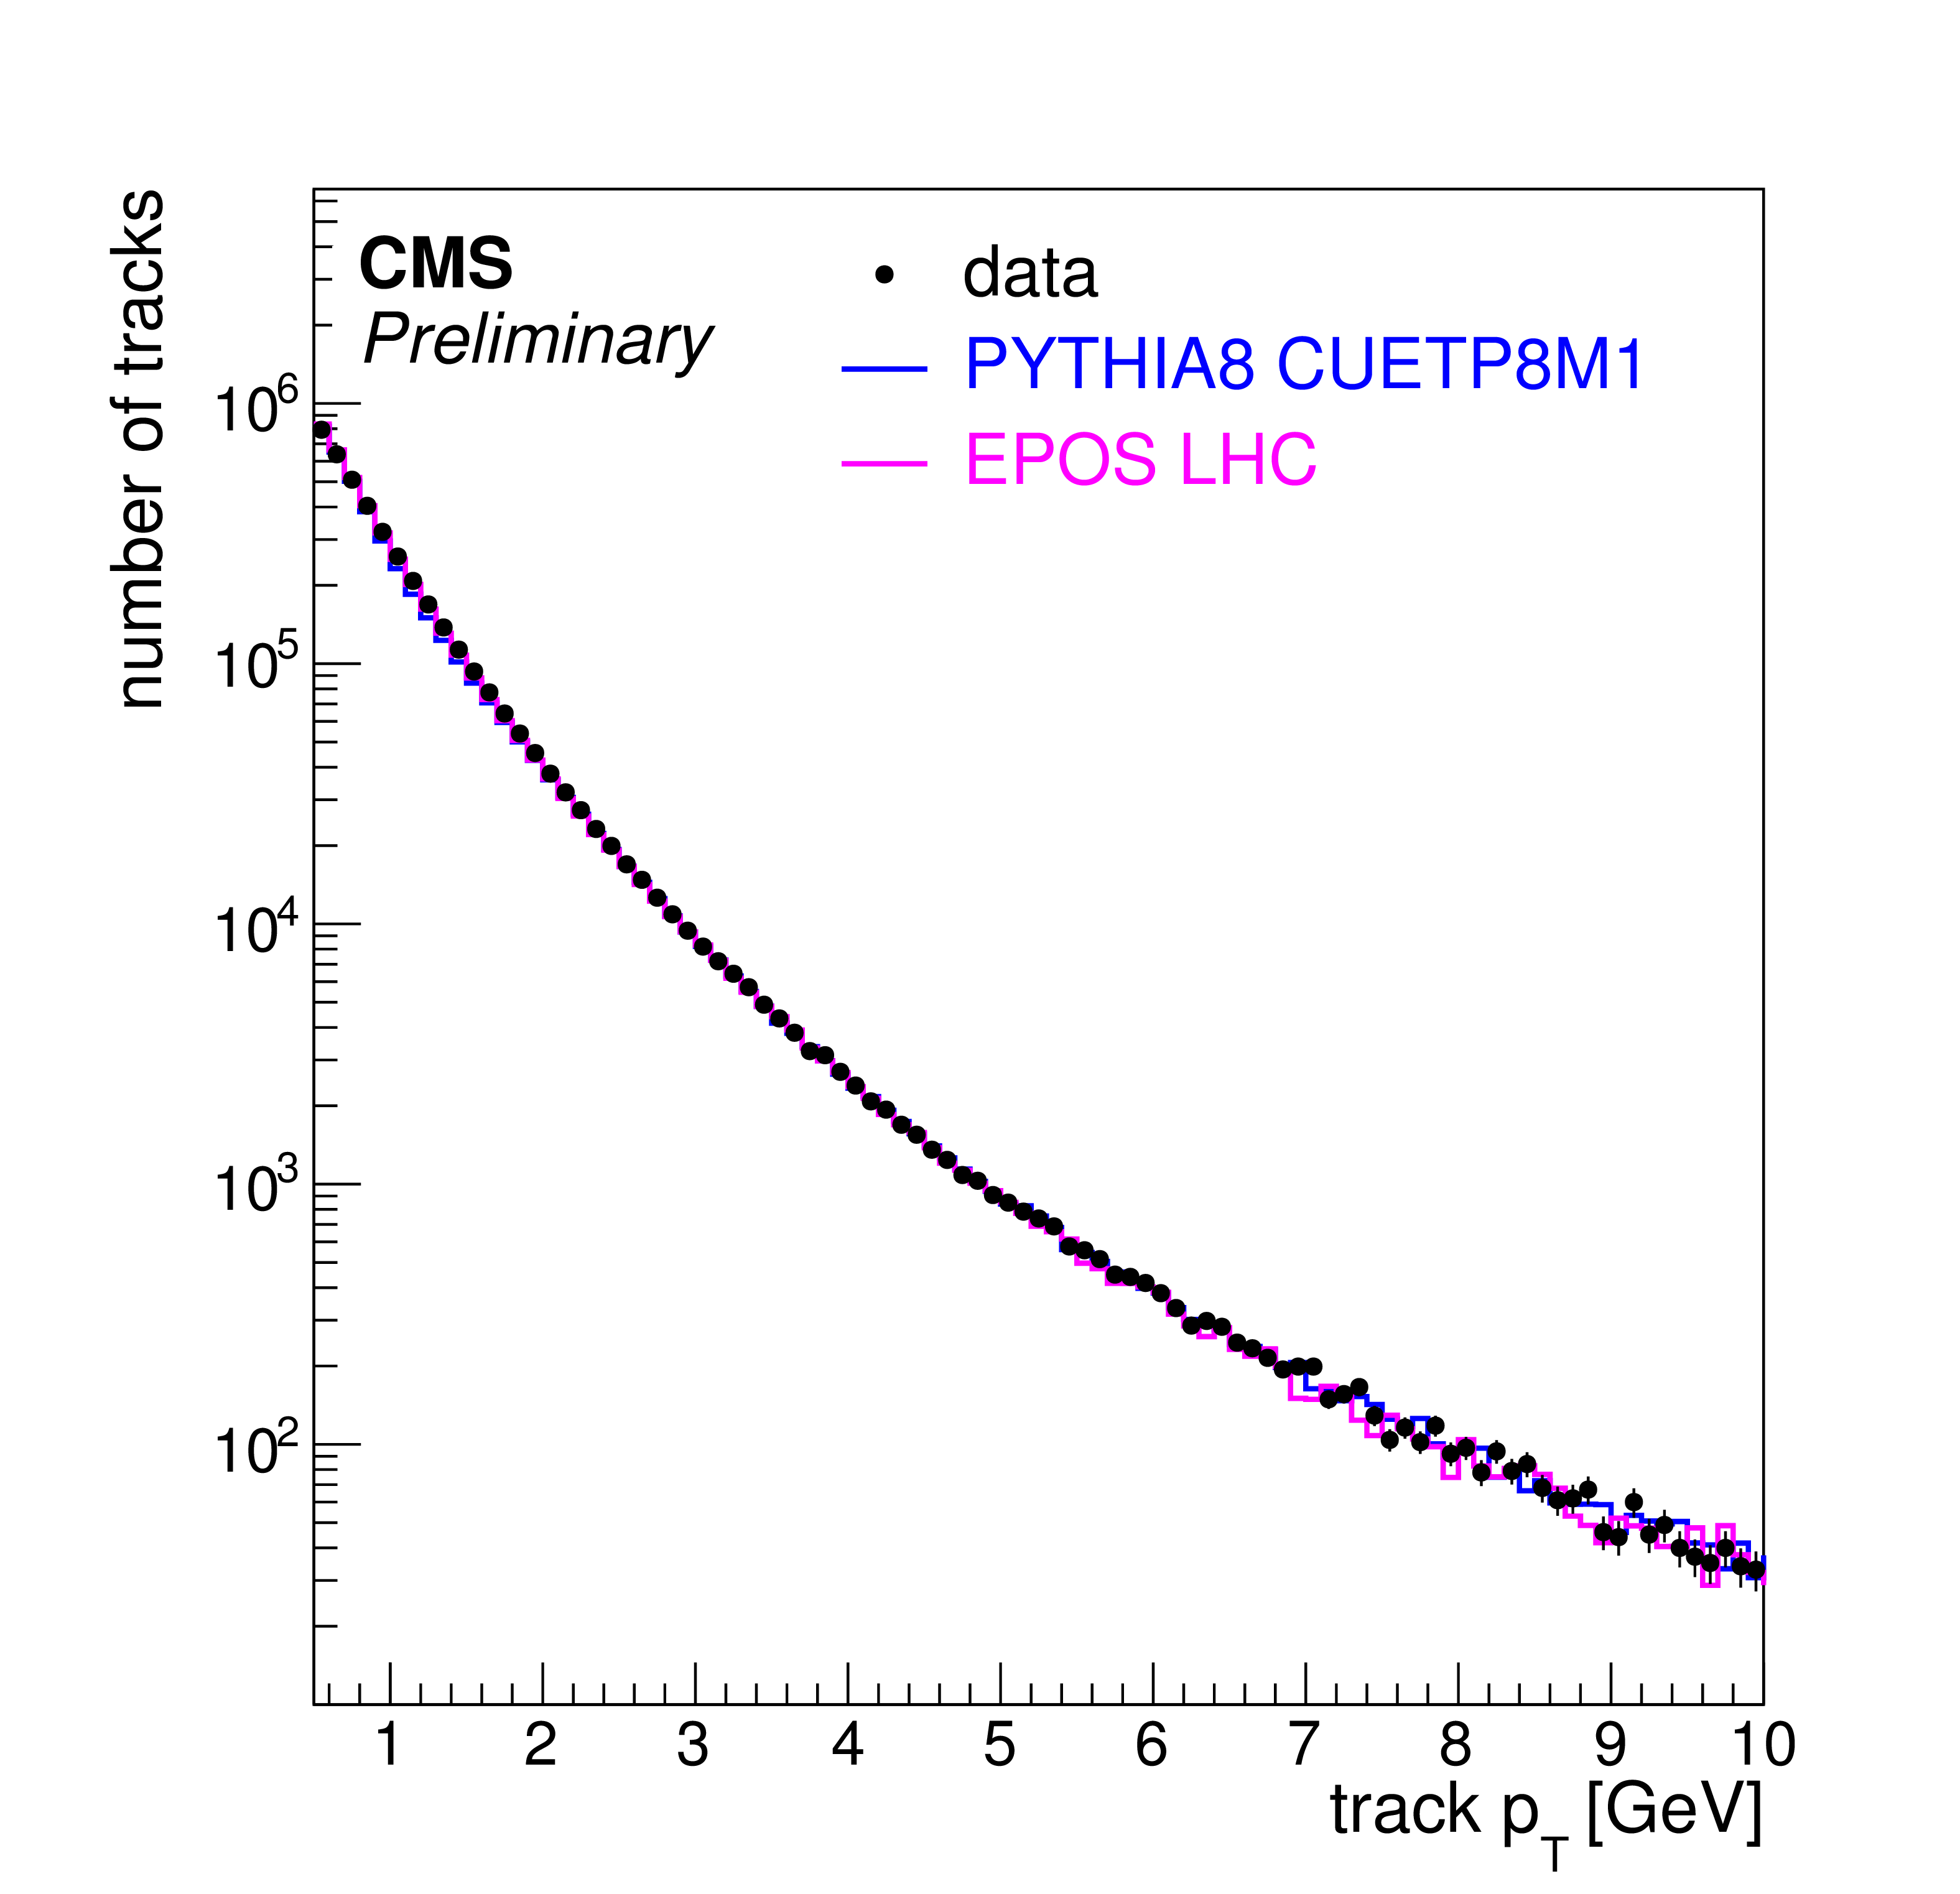
Distributions of the transverse momentum and pseudorapidity of the tracks associated to the primary vertex. The data are compared to the predictions of the Monte Carlo event generators PYTHIA 8 CUETP8M1 and EPOS LHC. |

png pdf |
Figure 1-b:
Distributions of the transverse momentum and pseudorapidity of the tracks associated to the primary vertex. The data are compared to the predictions of the Monte Carlo event generators PYTHIA 8 CUETP8M1 and EPOS LHC. |

png pdf |
Figure 2-a:
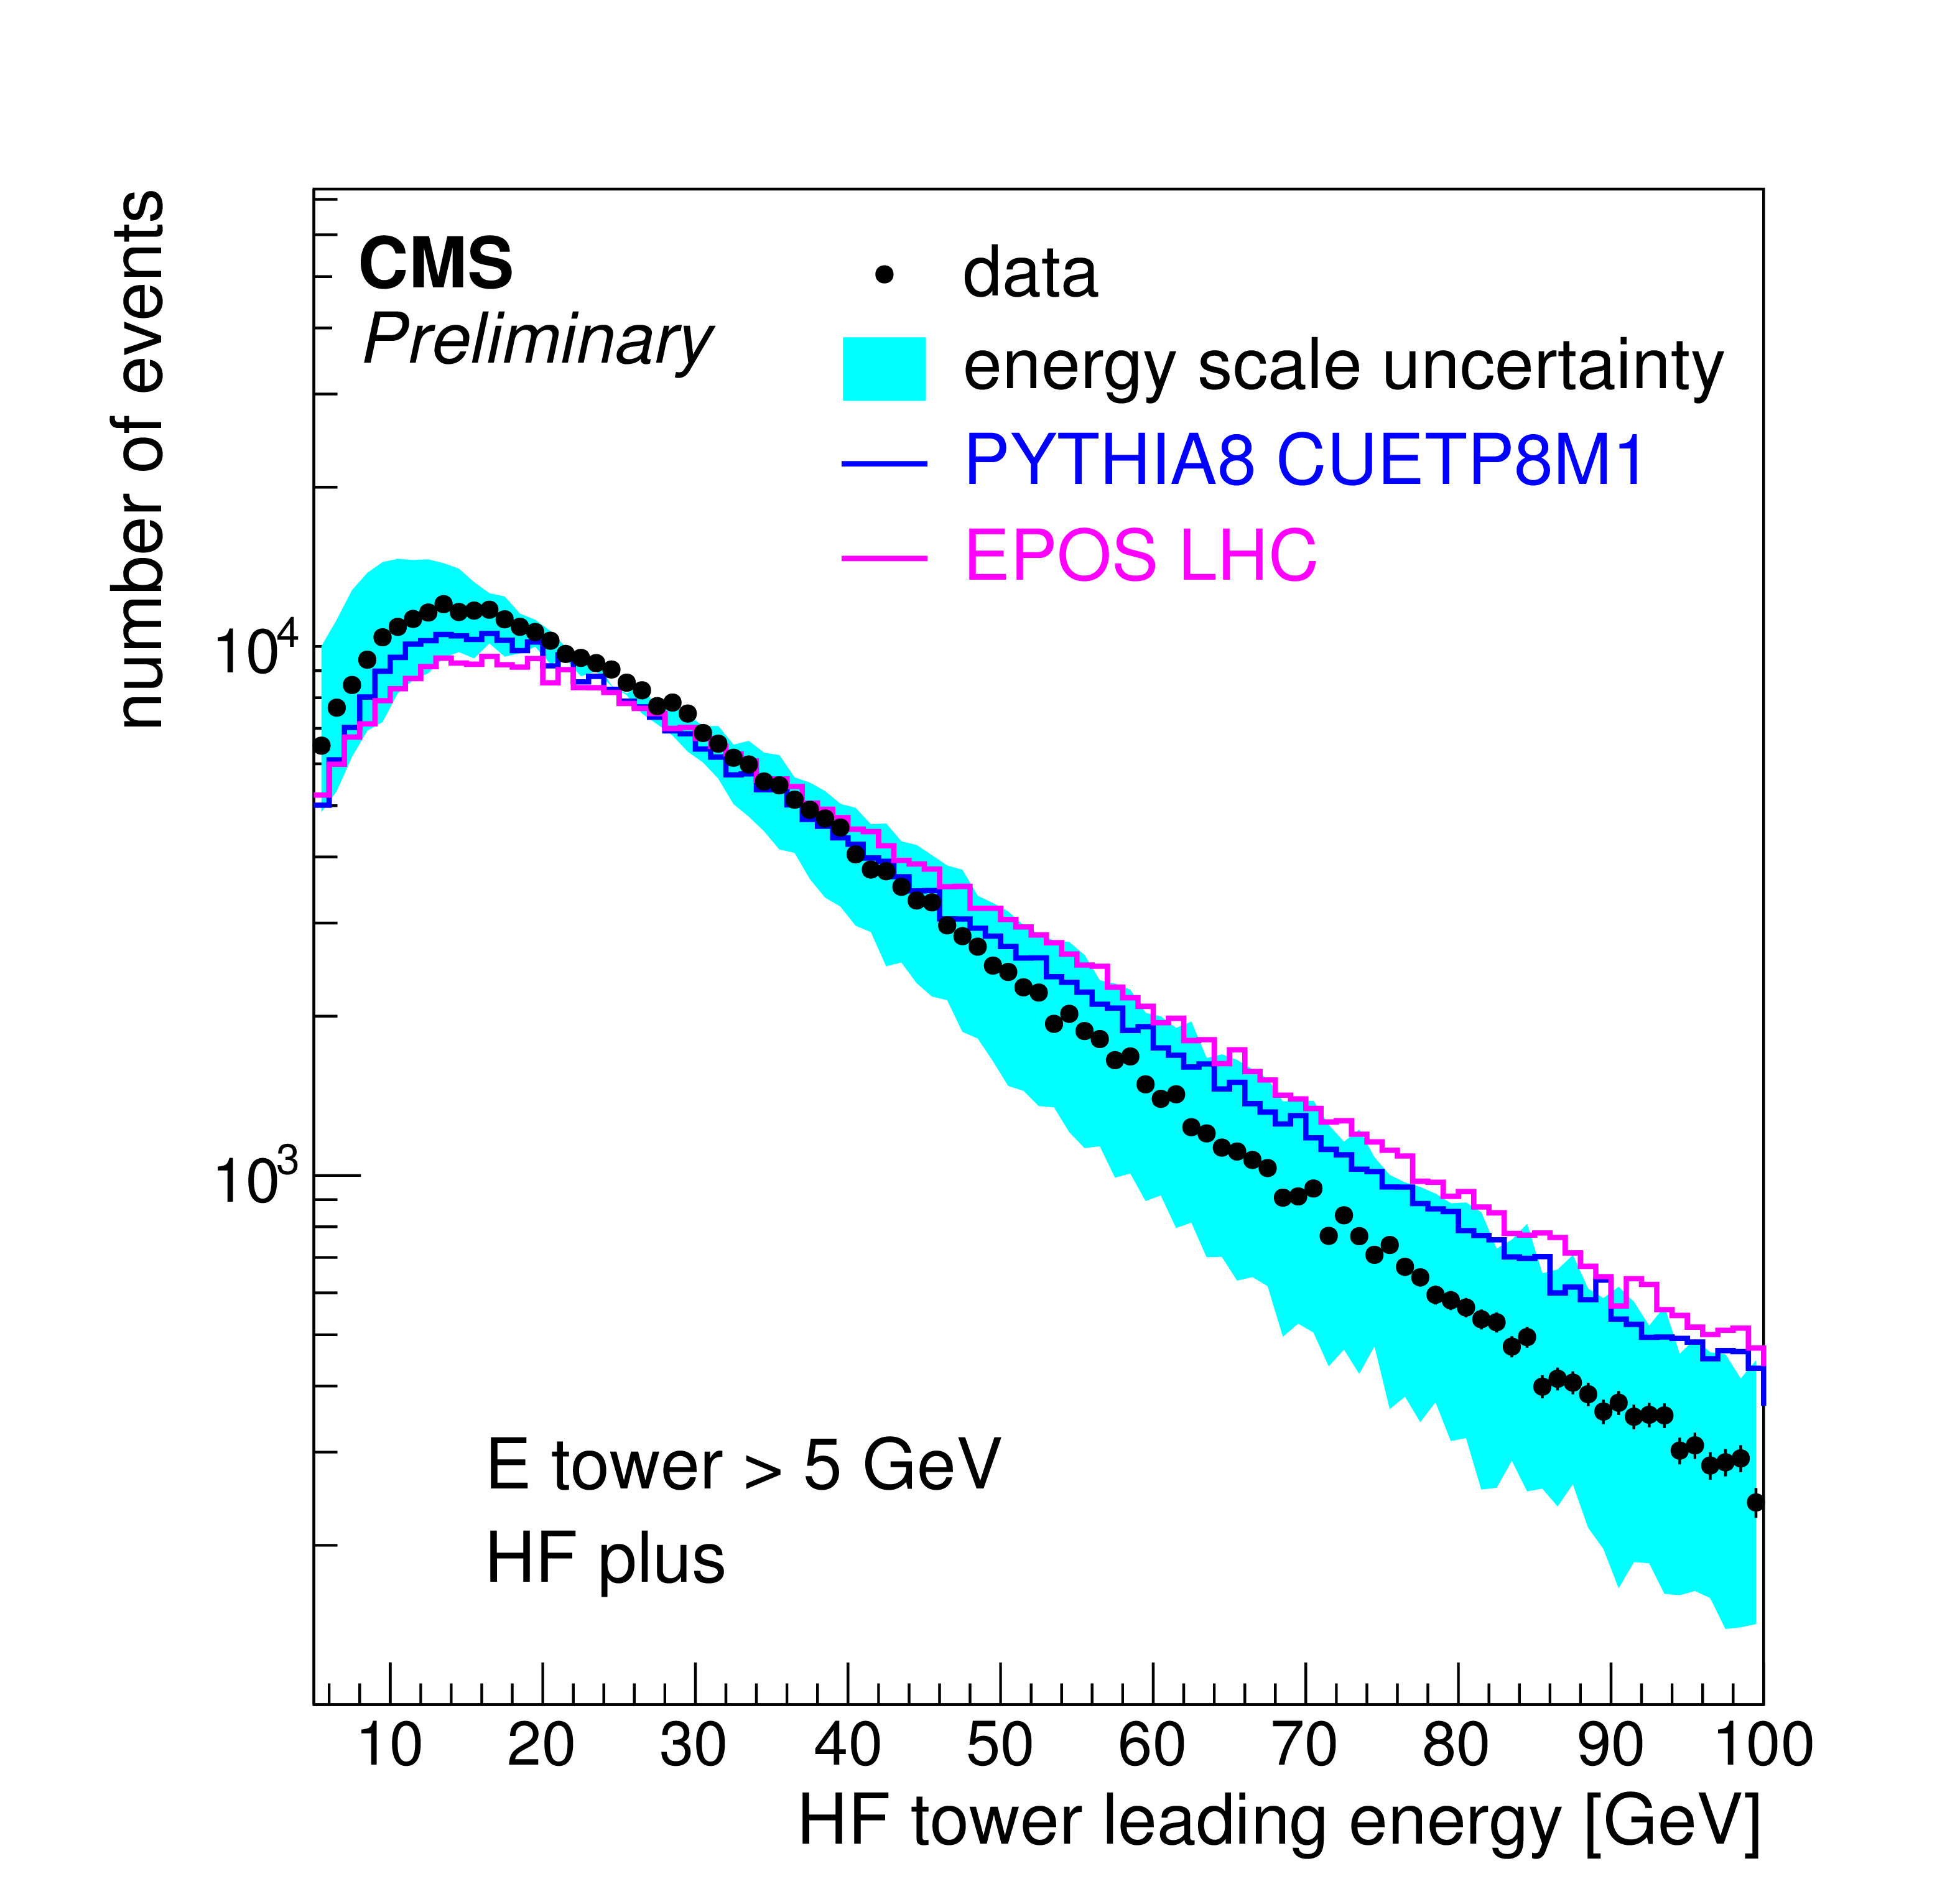
Distribution of the leading tower energy in the HF calorimeter in the pseudorapidity range 3 $< \eta <$ 5. The data are compared to the predictions of the Monte Carlo event generators PYTHIA 8 CUETP8M1 and EPOS LHC. |
png pdf |
Figure 2-b:
Distribution of the leading tower energy in the HF calorimeter in the pseudorapidity range 3 $< \eta <$ 5. The data are compared to the predictions of the Monte Carlo event generators PYTHIA 8 CUETP8M1 and EPOS LHC. |

png pdf |
Figure 3:
Comparison between the charged-hadron pseudorapidity densities determined in this analysis (full circle) and in Ref. [1] (open square). The data are compared to predictions of the MC event generators PYTHIA 8 CUETP8M1 (dashed line) and EPOS LHC (dotted line). The total systematic uncertainties obtained accounting for correlations between the sources are shown as shaded bands encompassing the data points. The filled band represents the uncertainties associated to the data points from this analysis, the hatched area depicts the uncertainties associated to the data points from Ref. [1]. |

png pdf |
Figure 4-a:
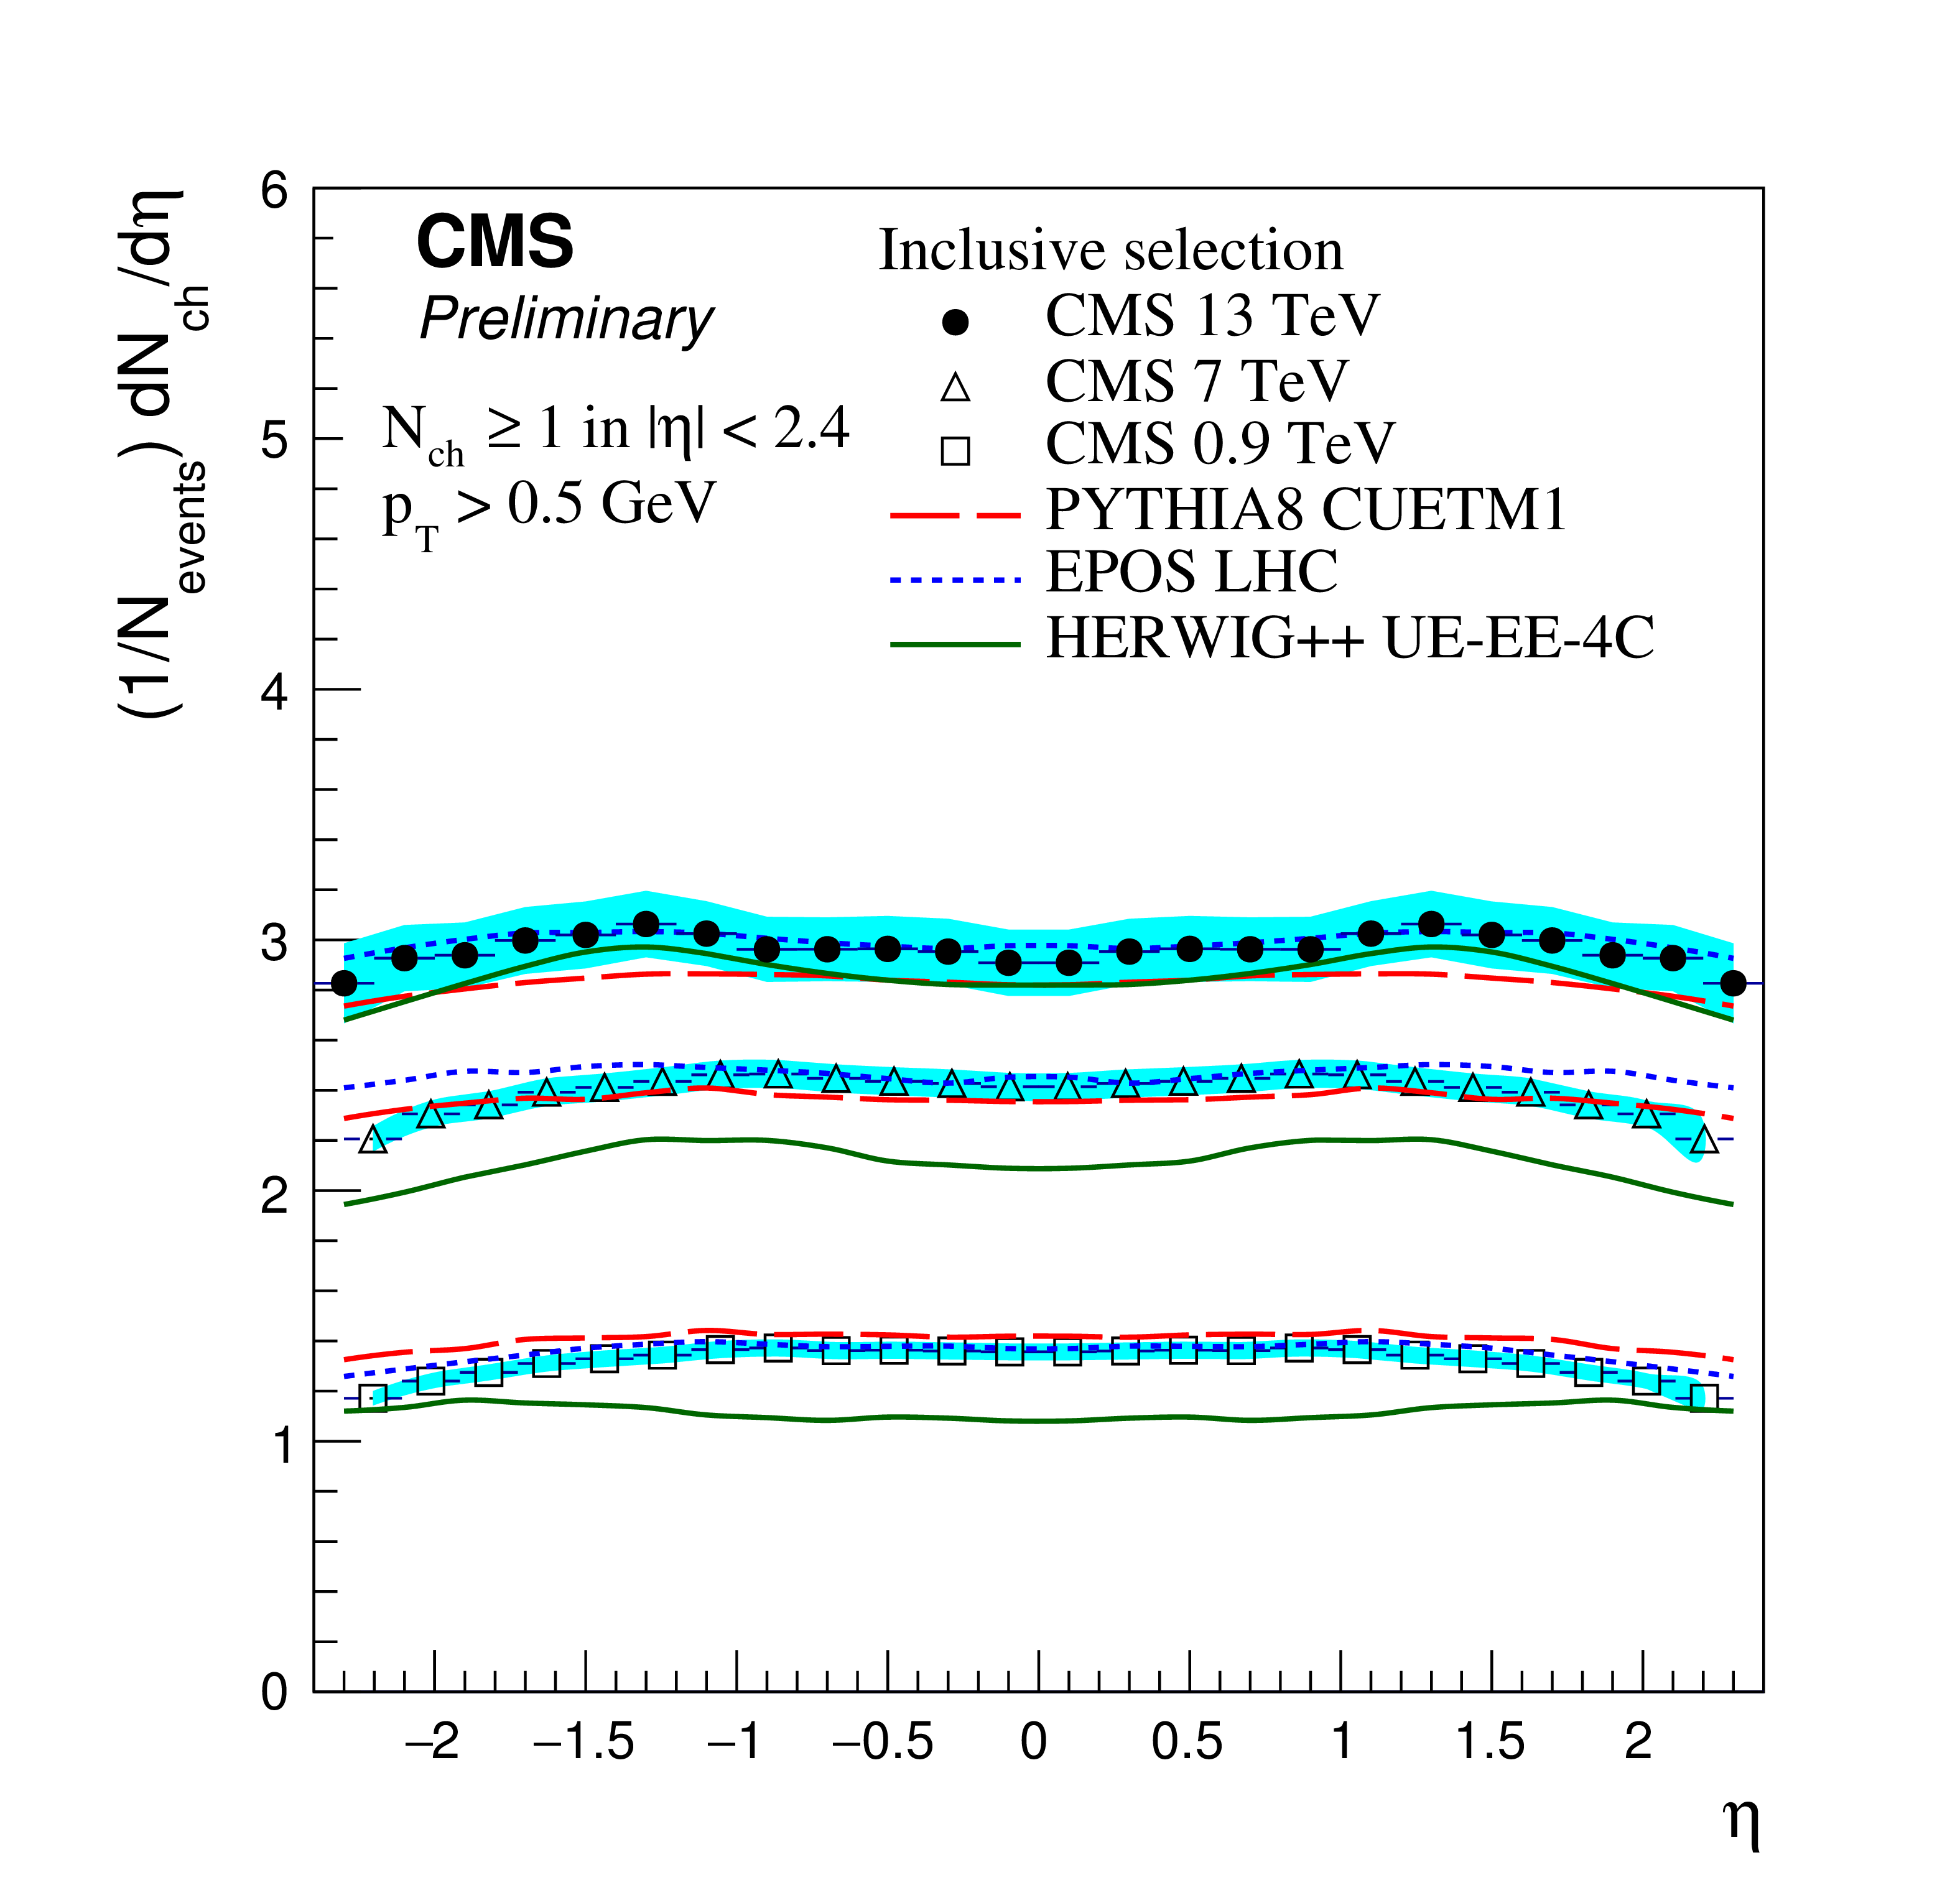
Charged-particle pseudorapidity density for the inclusive event sample measured by CMS at different centre-of-mass energies $\sqrt {s} =$ 900 GeV, 7 TeV and 13 TeV. The total systematic uncertainties are shown as shaded bands encompassing the data points. The measurements are compared to predictions of the MC event generators PYTHIA 8 with the tunes Monash [19] and CUETP8M1 [20], PYTHIA 8 MBR with the tune 4C [33], HERWIG++ with the tune UE-EE-4C [39] and EPOS with the LHC tune [44], represented by lines of different styles. |
png pdf |
Figure 4-b:
Charged-particle pseudorapidity density for the inclusive event sample measured by CMS at different centre-of-mass energies $\sqrt {s} =$ 900 GeV, 7 TeV and 13 TeV. The total systematic uncertainties are shown as shaded bands encompassing the data points. The measurements are compared to predictions of the MC event generators PYTHIA 8 with the tunes Monash [19] and CUETP8M1 [20], PYTHIA 8 MBR with the tune 4C [33], HERWIG++ with the tune UE-EE-4C [39] and EPOS with the LHC tune [44], represented by lines of different styles. |
png pdf |
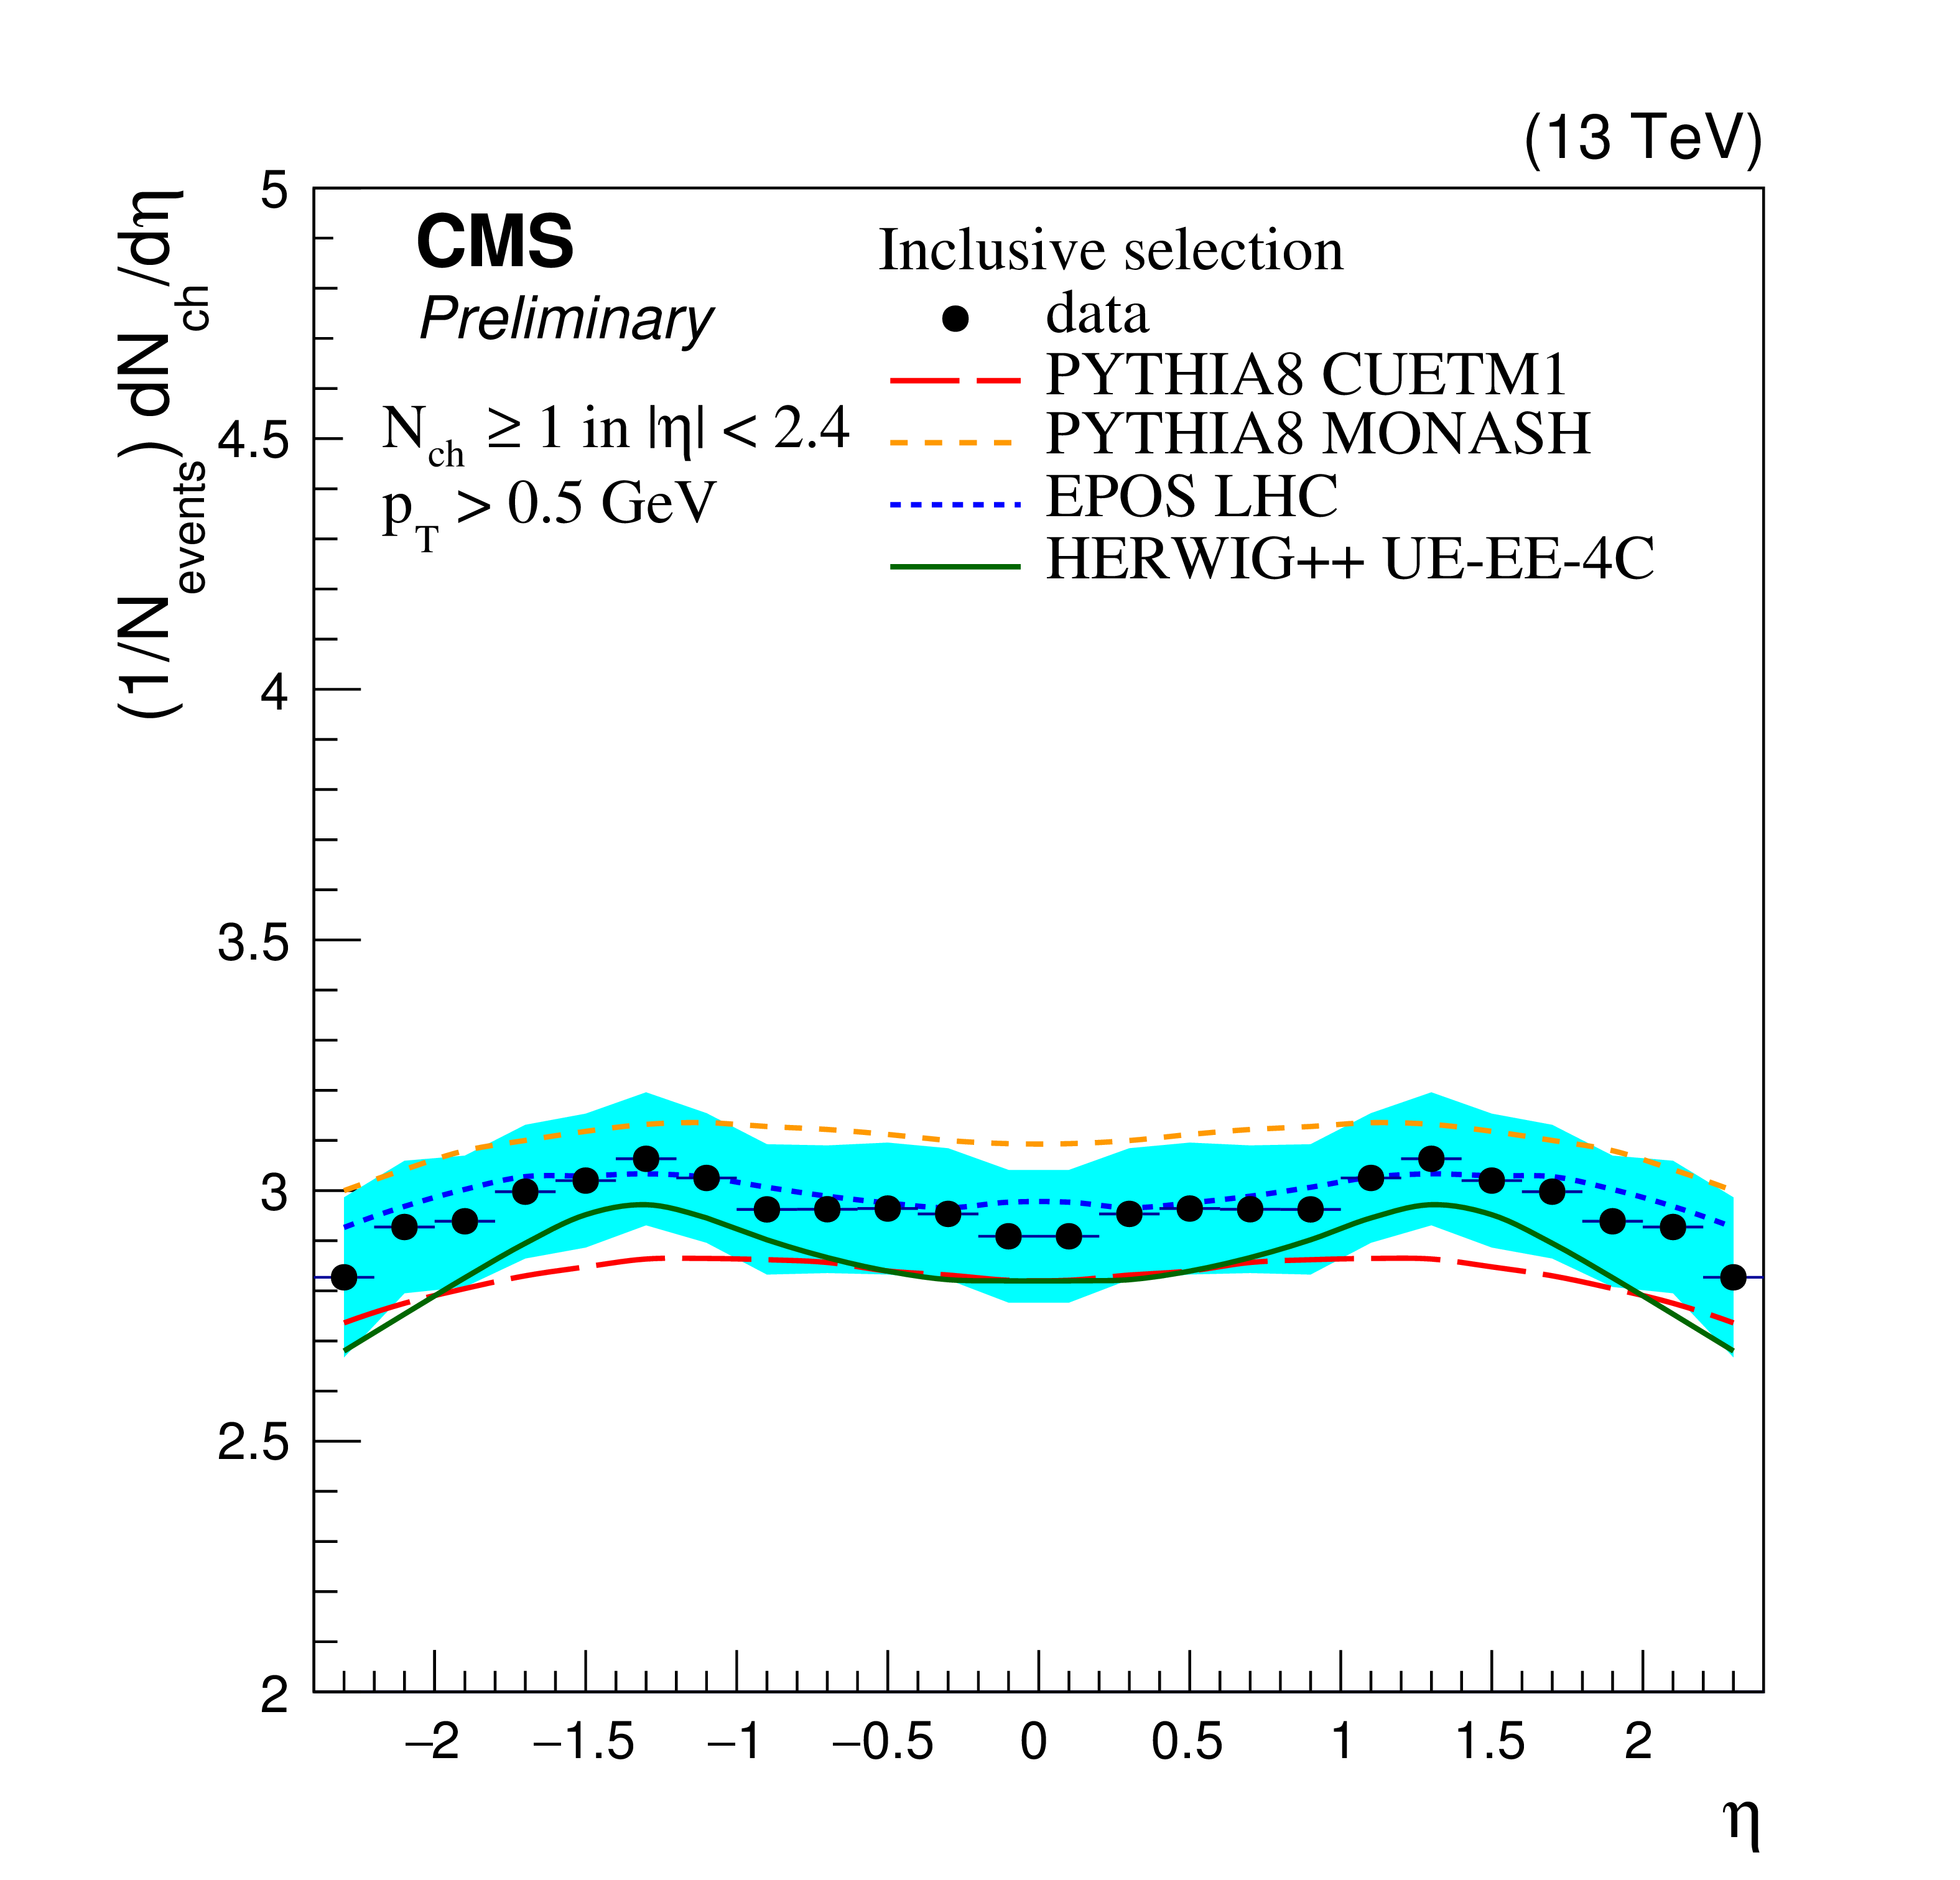
Figure 5-a:
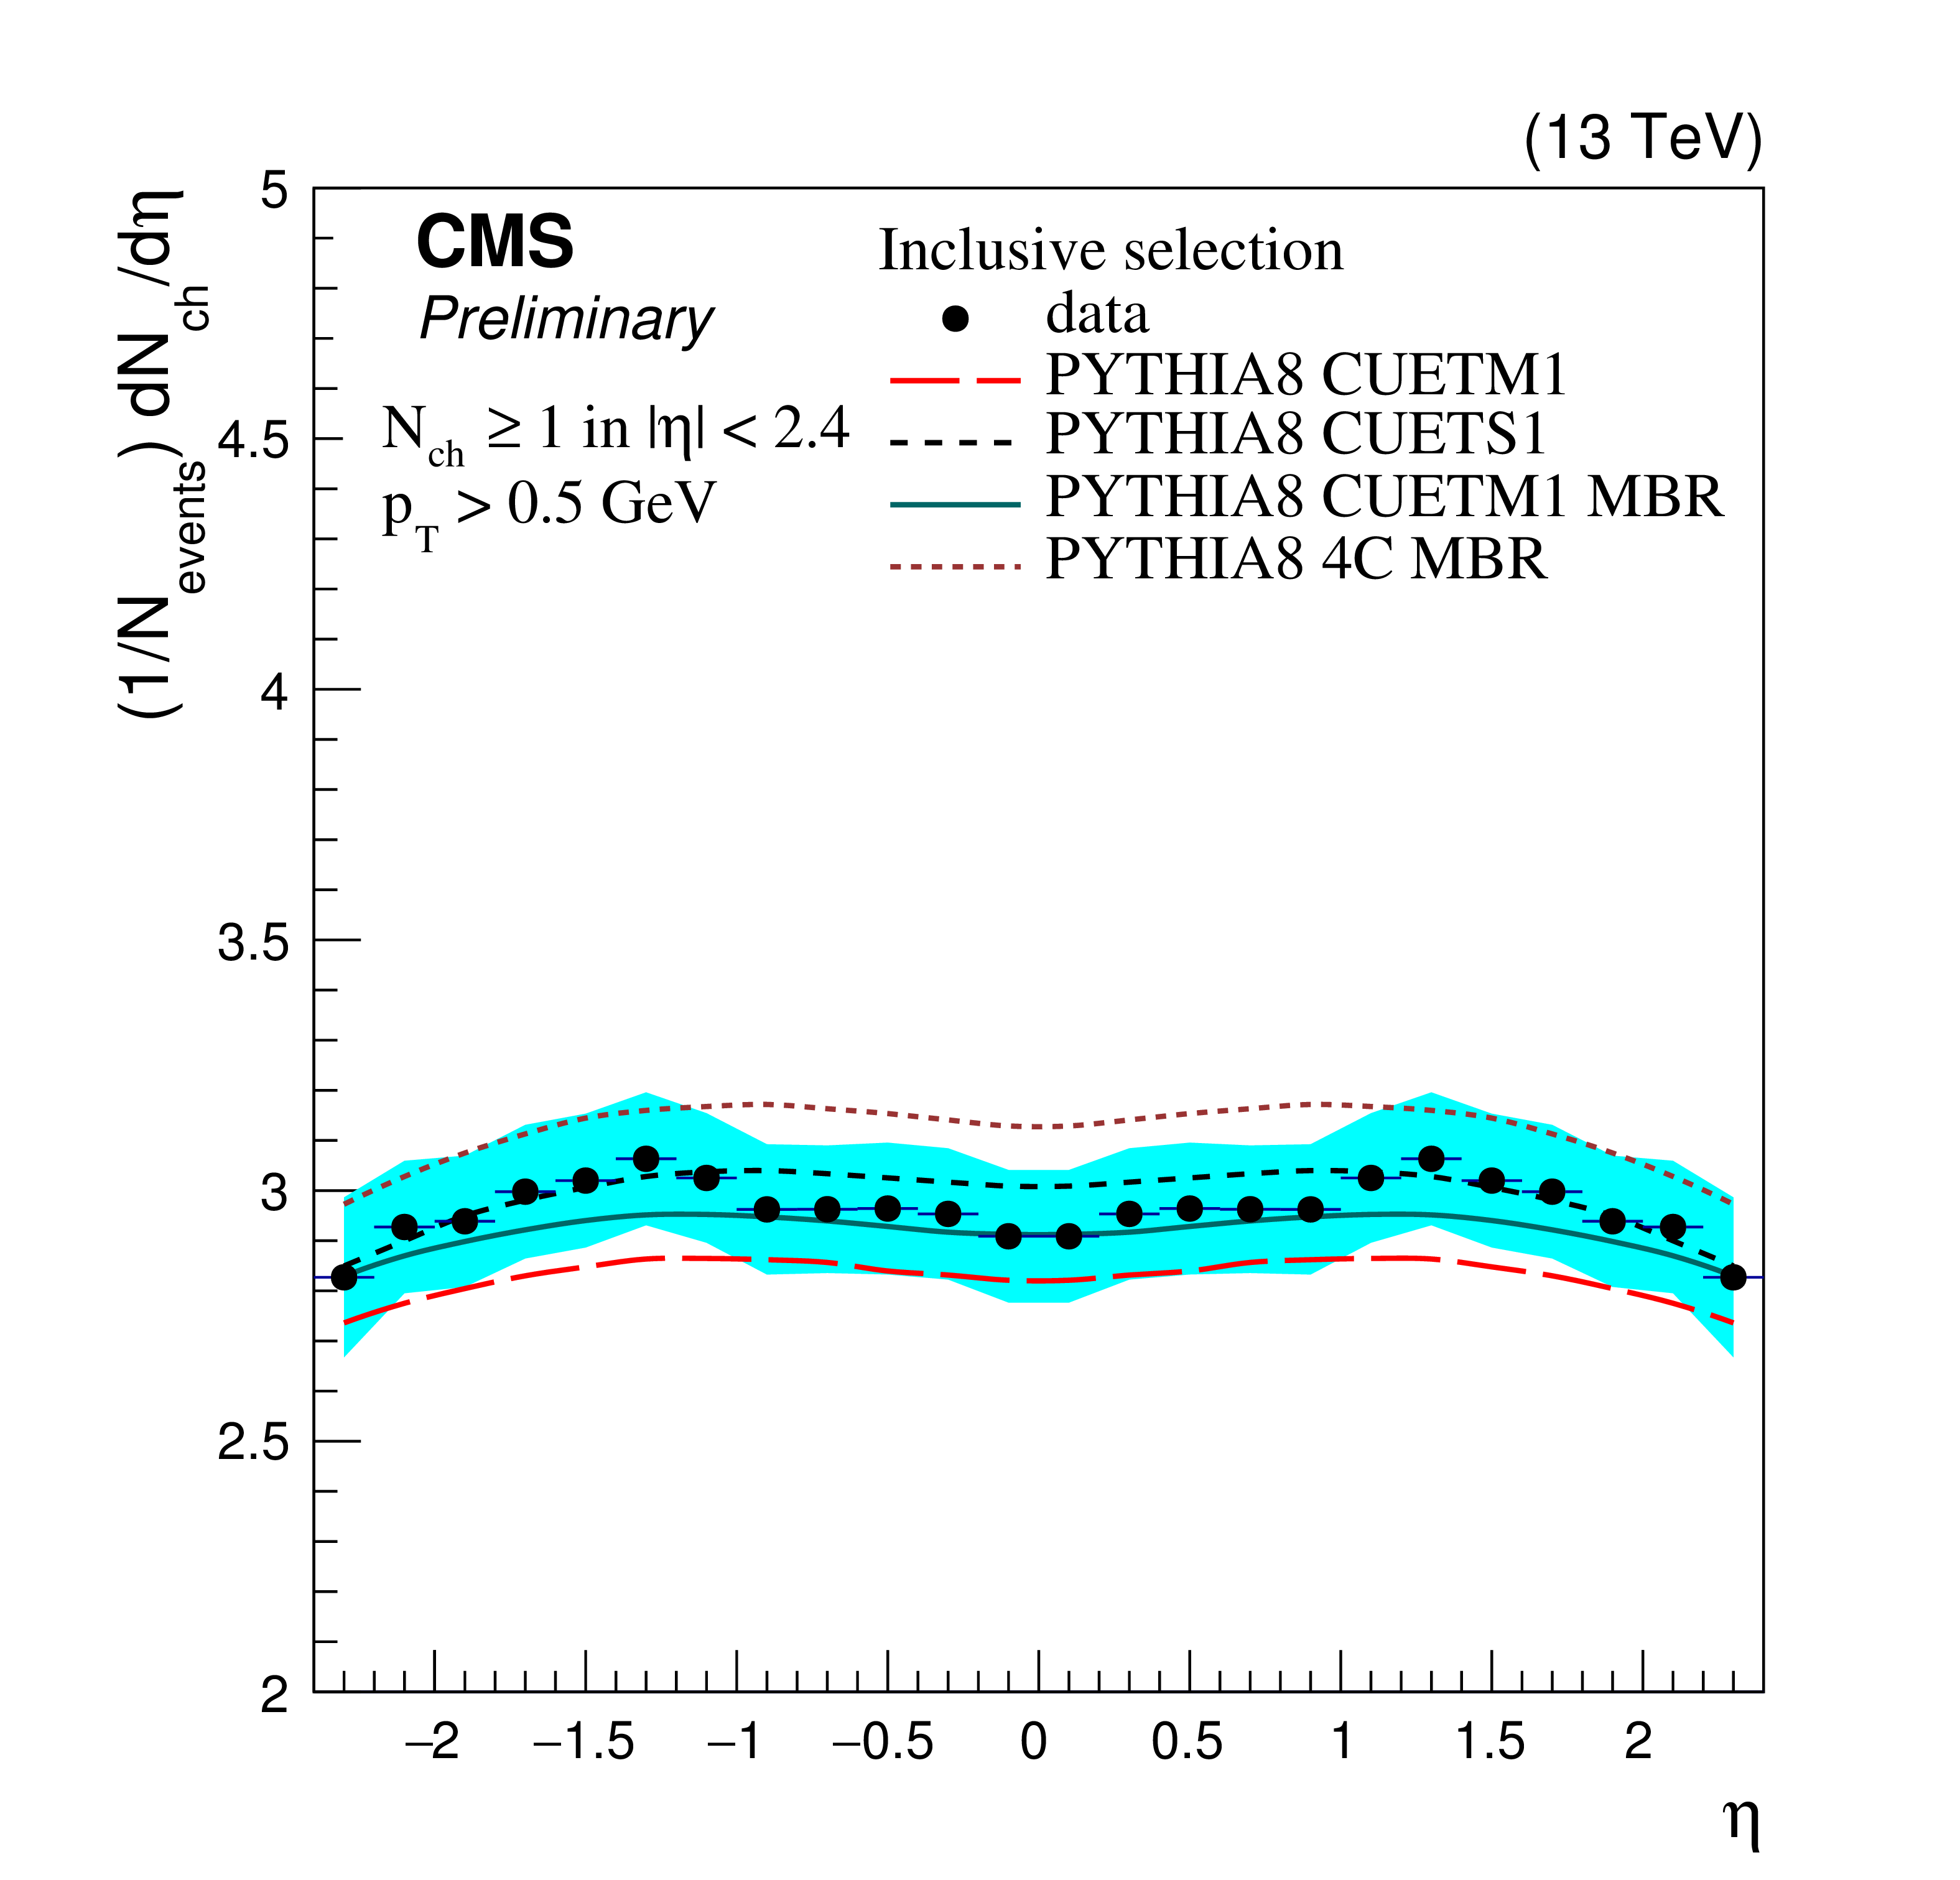
Charged-particle pseudorapidity density for the inclusive (a,b) and inelastic-enhanced (c,d) event samples. The total systematic uncertainties obtained accounting for correlations between the sources are shown as shaded bands encompassing the data points. The measurements are compared to predictions of the MC event generators PYTHIA 8 with the tunes Monash [19], CUETP8M1 [20] and CUETP8S1 [20], PYTHIA 8 MBR with the tunes CUETP8M1 and 4C [33], HERWIG++ with the tune UE-EE-4C [39] and EPOS with the LHC tune [44], represented by lines of different styles. |
png pdf |
Figure 5-b:
Charged-particle pseudorapidity density for the inclusive (a,b) and inelastic-enhanced (c,d) event samples. The total systematic uncertainties obtained accounting for correlations between the sources are shown as shaded bands encompassing the data points. The measurements are compared to predictions of the MC event generators PYTHIA 8 with the tunes Monash [19], CUETP8M1 [20] and CUETP8S1 [20], PYTHIA 8 MBR with the tunes CUETP8M1 and 4C [33], HERWIG++ with the tune UE-EE-4C [39] and EPOS with the LHC tune [44], represented by lines of different styles. |

png pdf |
Figure 5-c:
Charged-particle pseudorapidity density for the inclusive (a,b) and inelastic-enhanced (c,d) event samples. The total systematic uncertainties obtained accounting for correlations between the sources are shown as shaded bands encompassing the data points. The measurements are compared to predictions of the MC event generators PYTHIA 8 with the tunes Monash [19], CUETP8M1 [20] and CUETP8S1 [20], PYTHIA 8 MBR with the tunes CUETP8M1 and 4C [33], HERWIG++ with the tune UE-EE-4C [39] and EPOS with the LHC tune [44], represented by lines of different styles. |

png pdf |
Figure 5-d:
Charged-particle pseudorapidity density for the inclusive (a,b) and inelastic-enhanced (c,d) event samples. The total systematic uncertainties obtained accounting for correlations between the sources are shown as shaded bands encompassing the data points. The measurements are compared to predictions of the MC event generators PYTHIA 8 with the tunes Monash [19], CUETP8M1 [20] and CUETP8S1 [20], PYTHIA 8 MBR with the tunes CUETP8M1 and 4C [33], HERWIG++ with the tune UE-EE-4C [39] and EPOS with the LHC tune [44], represented by lines of different styles. |

png pdf |
Figure 6-a:
Charged-particle pseudorapidity density for the NSD-enhanced (a,b) and SD-enhanced (c,d) event samples. The total systematic uncertainties obtained accounting for correlations between the sources are shown as shaded bands encompassing the data points. The measurements are compared to predictions of the MC event generators PYTHIA 8 with the tunes Monash [19], CUETP8M1 [20] and CUETP8S1 [20], PYTHIA 8 MBR with the tunes CUETP8M1 and 4C [33], HERWIG++ with the tune UE-EE-4C [39] and EPOS with the LHC tune [44], represented by lines of different styles. |

png pdf |
Figure 6-b:
Charged-particle pseudorapidity density for the NSD-enhanced (a,b) and SD-enhanced (c,d) event samples. The total systematic uncertainties obtained accounting for correlations between the sources are shown as shaded bands encompassing the data points. The measurements are compared to predictions of the MC event generators PYTHIA 8 with the tunes Monash [19], CUETP8M1 [20] and CUETP8S1 [20], PYTHIA 8 MBR with the tunes CUETP8M1 and 4C [33], HERWIG++ with the tune UE-EE-4C [39] and EPOS with the LHC tune [44], represented by lines of different styles. |

png pdf |
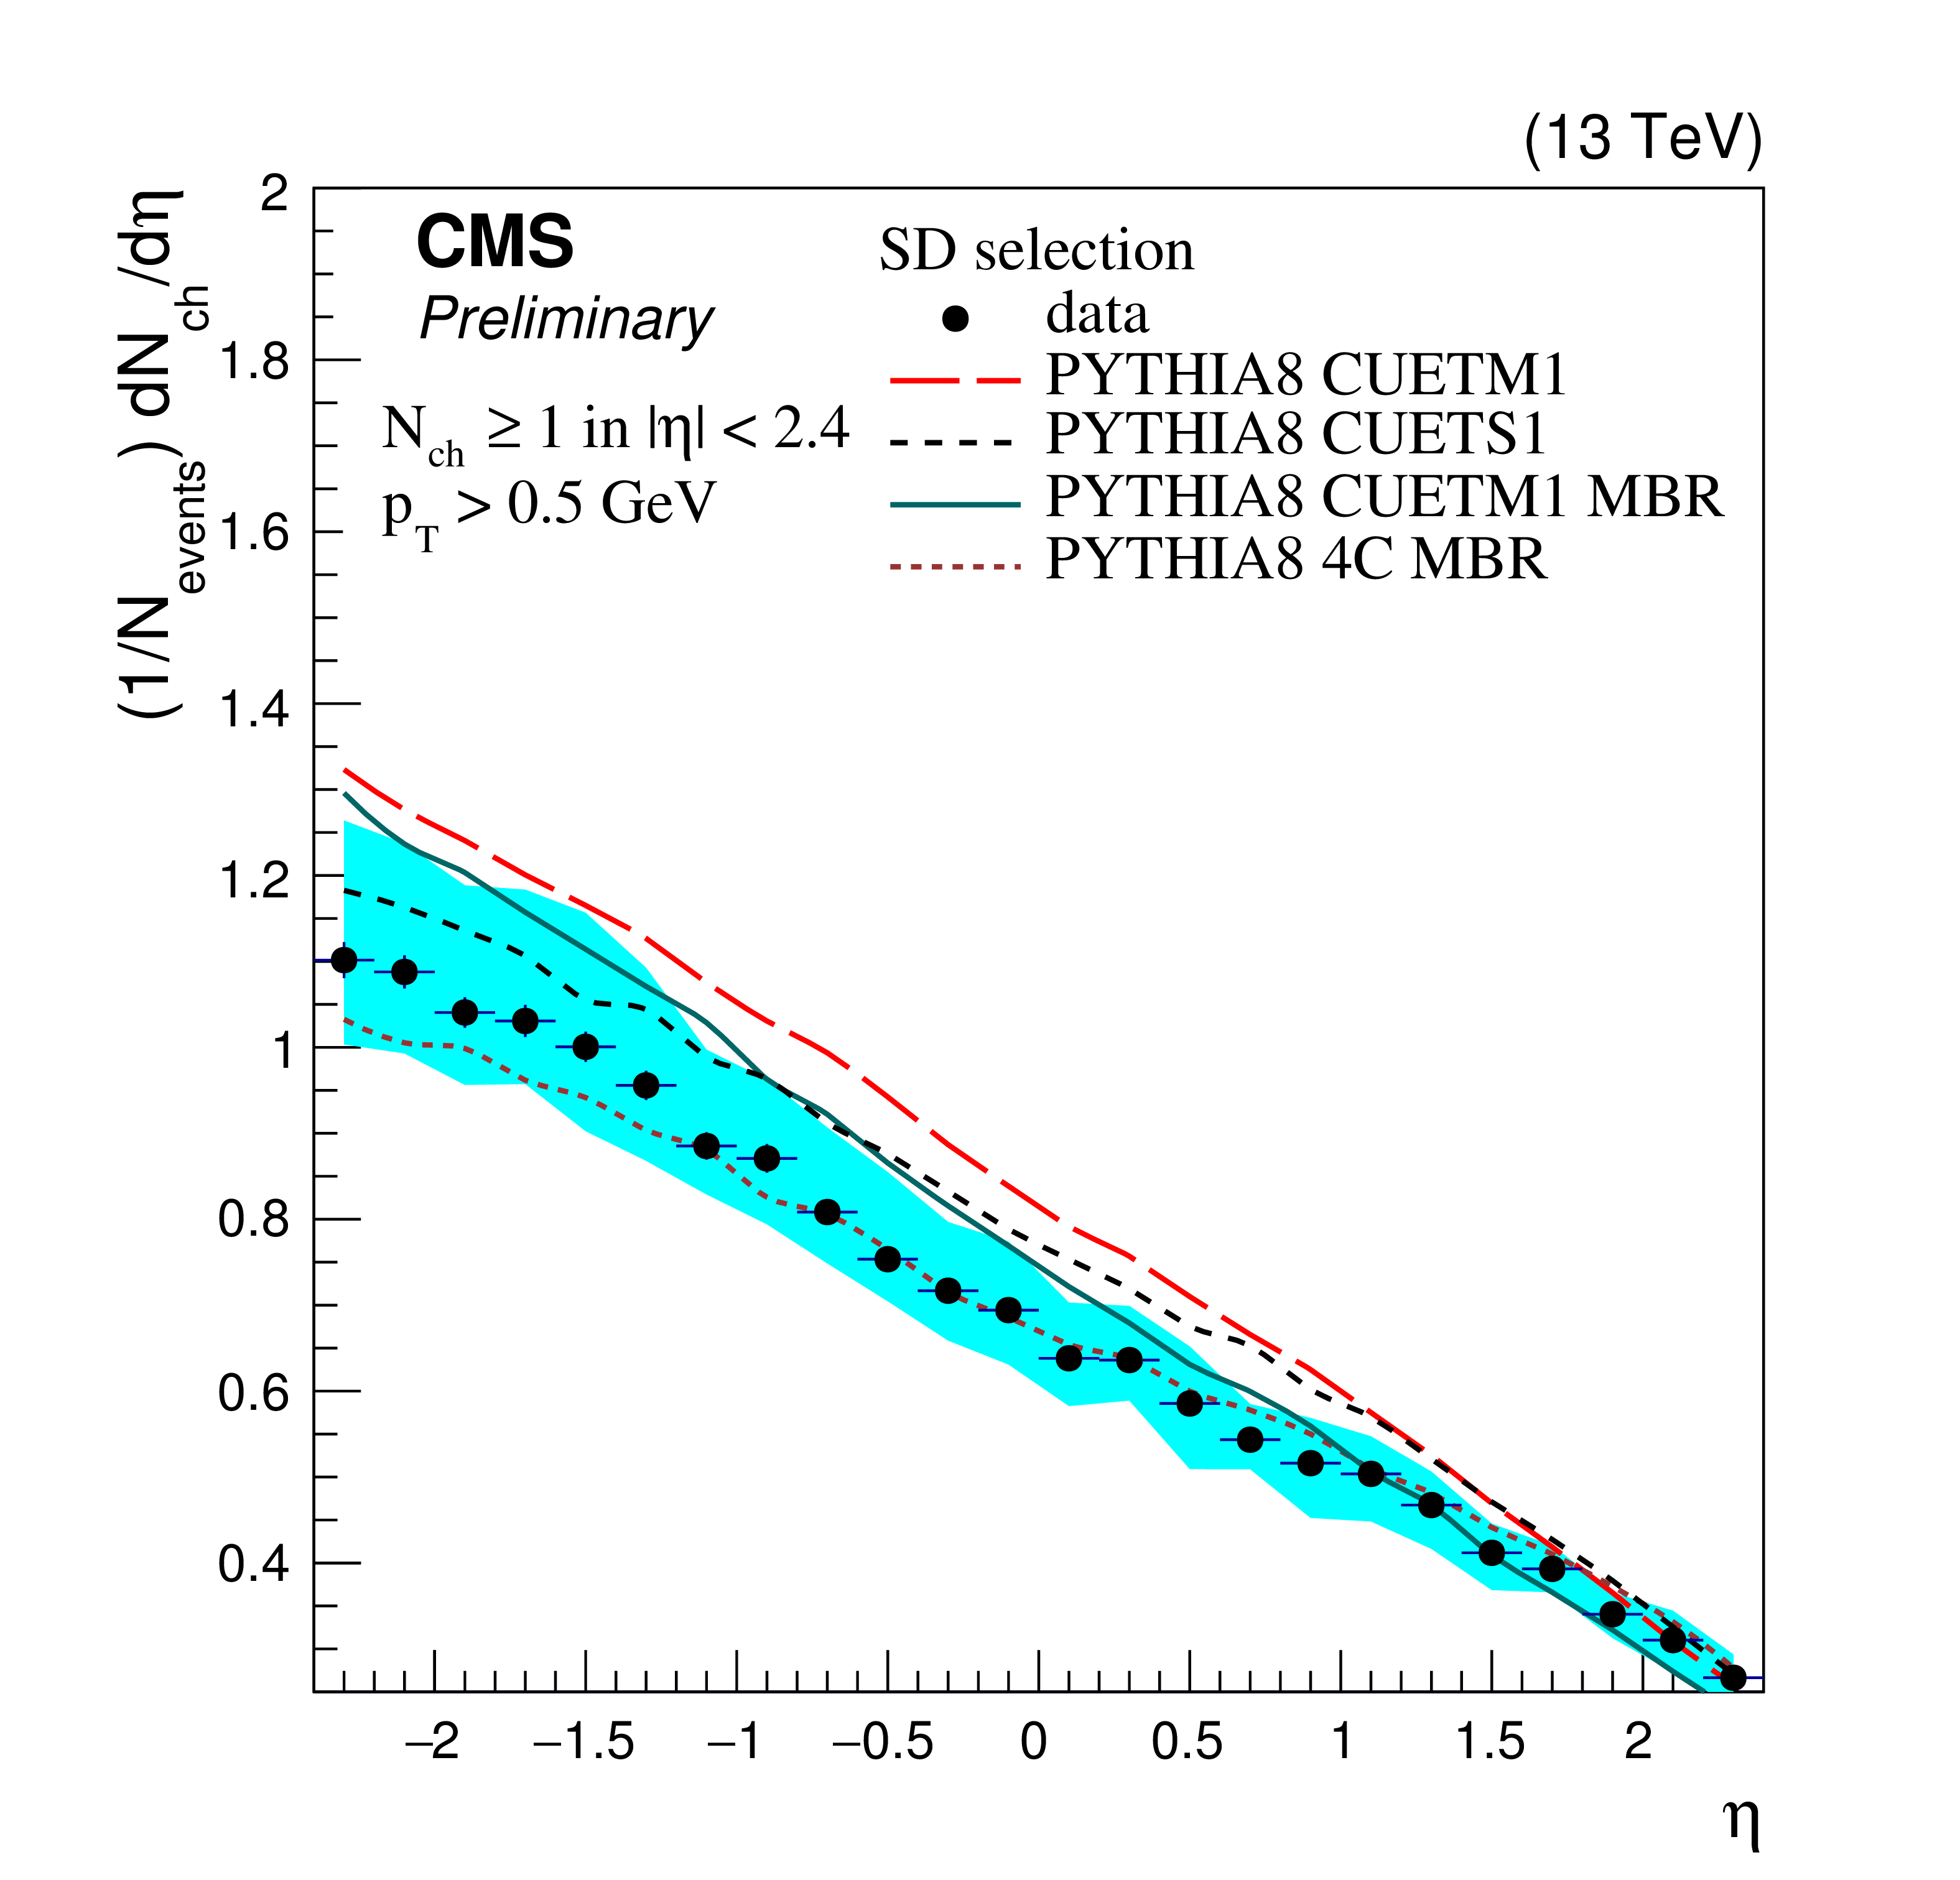
Figure 6-c:
Charged-particle pseudorapidity density for the NSD-enhanced (a,b) and SD-enhanced (c,d) event samples. The total systematic uncertainties obtained accounting for correlations between the sources are shown as shaded bands encompassing the data points. The measurements are compared to predictions of the MC event generators PYTHIA 8 with the tunes Monash [19], CUETP8M1 [20] and CUETP8S1 [20], PYTHIA 8 MBR with the tunes CUETP8M1 and 4C [33], HERWIG++ with the tune UE-EE-4C [39] and EPOS with the LHC tune [44], represented by lines of different styles. |

png pdf |
Figure 6-d:
Charged-particle pseudorapidity density for the NSD-enhanced (a,b) and SD-enhanced (c,d) event samples. The total systematic uncertainties obtained accounting for correlations between the sources are shown as shaded bands encompassing the data points. The measurements are compared to predictions of the MC event generators PYTHIA 8 with the tunes Monash [19], CUETP8M1 [20] and CUETP8S1 [20], PYTHIA 8 MBR with the tunes CUETP8M1 and 4C [33], HERWIG++ with the tune UE-EE-4C [39] and EPOS with the LHC tune [44], represented by lines of different styles. |
png pdf |
Figure 7-a:
Charged-particle pseudorapidity density for the one-sided SD-enhanced event sample. The total systematic uncertainties obtained accounting for correlations between the sources are shown as shaded bands encompassing the data points. The measurements are compared to predictions of the MC event generators PYTHIA 8 with the tunes Monash [19], CUETP8M1 [20] and CUETP8S1 [20], PYTHIA 8 MBR with the tunes CUETP8M1 and 4C [33], HERWIG++ with the tune UE-EE-4C [39] and EPOS with the LHC tune [44], represented by lines of different styles. |

png pdf |
Figure 7-b:
Charged-particle pseudorapidity density for the one-sided SD-enhanced event sample. The total systematic uncertainties obtained accounting for correlations between the sources are shown as shaded bands encompassing the data points. The measurements are compared to predictions of the MC event generators PYTHIA 8 with the tunes Monash [19], CUETP8M1 [20] and CUETP8S1 [20], PYTHIA 8 MBR with the tunes CUETP8M1 and 4C [33], HERWIG++ with the tune UE-EE-4C [39] and EPOS with the LHC tune [44], represented by lines of different styles. |
| Summary |
| Charged-particle pseudorapidity densities have been measured in pp collisions at $\sqrt{s} =$ 13 TeV and compared with predictions from MC event generators commonly used to describe high-energy hadron-hadron interactions. The measurements have been done for four different event categories, an inclusive event sample, an inelastic-enhanced sample, a sample enhanced in non-single diffractive dissociation events and a sample enhanced in single diffractive dissociation events. The MC event generators PYTHIA 8, HERWIG++ and EPOS , which were tuned to measurements of the underlying event at lower centre-of-mass energies describe the data reasonably well. For the inclusive and inelastic-enhanced samples, the predictions of PYTHIA 8 with the tune CUETP8S1, PYTHIA 8 MBR with the tune CUETP8M1 and EPOS with the tune LHC give the best description of the data. For the NSD-enhanced sample, the predictions of EPOS with the LHC tune, PYTHIA 8 with the tune CUETP8M1 and PYTHIA 8 MBR with the tune CUETP8M1 give a reasonable description of the data. For the SD-enhanced samples, the predictions of PYTHIA 8 MBR with the tune 4C describe the data well. All the predictions except those of HERWIG++ with the tune UE-EE-4C are able to describe the charged-particle pseudorapidity density on the $\eta$ side associated to the direction of the diffractively scattered proton. The only predictions which are able to describe the activity on the $\eta$ side of the diffractively produced final state are those of PYTHIA 8 MBR with the tune 4C. The predictions of PYTHIA 8 MBR with the tune 4C overestimate the measurements for the inclusive, inelastic-enhanced and NSD-enhanced selections. The predictions of PYTHIA 8 with the tune Monash overestimate the data in all the different event categories, while those of HERWIG++ with the tune UE-EE-4C are able to describe the inclusive and inelastic-enhanced selections, but fail to describe the NSD- and SD-enhanced samples. |
|
|
Compact Muon Solenoid LHC, CERN |
|

|

|

|

|

|