

Compact Muon Solenoid
LHC, CERN
| CMS-PAS-FSQ-16-002 | ||
| Measurement of the energy distribution in the very forward direction at 13 TeV with CMS | ||
| CMS Collaboration | ||
| April 2016 | ||
| Abstract: The event-by-event energy deposition into the very forward acceptance, $-6.6<\eta<-5.2$, of CMS is measured and characterized in proton-proton collisions at 13 TeV. Data from the electromagnetic and hadronic sections of the CASTOR calorimeter are used for this purpose. The results are corrected to stable particle level and presented independently for the electromagnetic as well as the hadronic component of the hadronic multiparticle production. The data are sensitive to the production of neutral and charged mesons, which is a key ingredient for the modeling of cosmic ray induced extensive air showers at ultra-high energies. The presented data are relevant for the fraction of primary energy converted into secondary muons. Furthermore, the data are sensitive to the characteristics of multi-parton interactions. | ||
|
Links:
CDS record (PDF) ;
inSPIRE record ;
CADI line (restricted) ;
These preliminary results are superseded in this paper, JHEP 08 (2017) 046. The superseded preliminary plots can be found here. |
||
| Figures | |

png pdf |
Figure 1:
Energy spectrum of single reconstructed CASTOR towers for the chosen detector level selection. Data is shown with black markers and compared to Pythia8 CUETP8M1, Pythia8 4C+MBR, and EPOS LHC. |
png pdf |
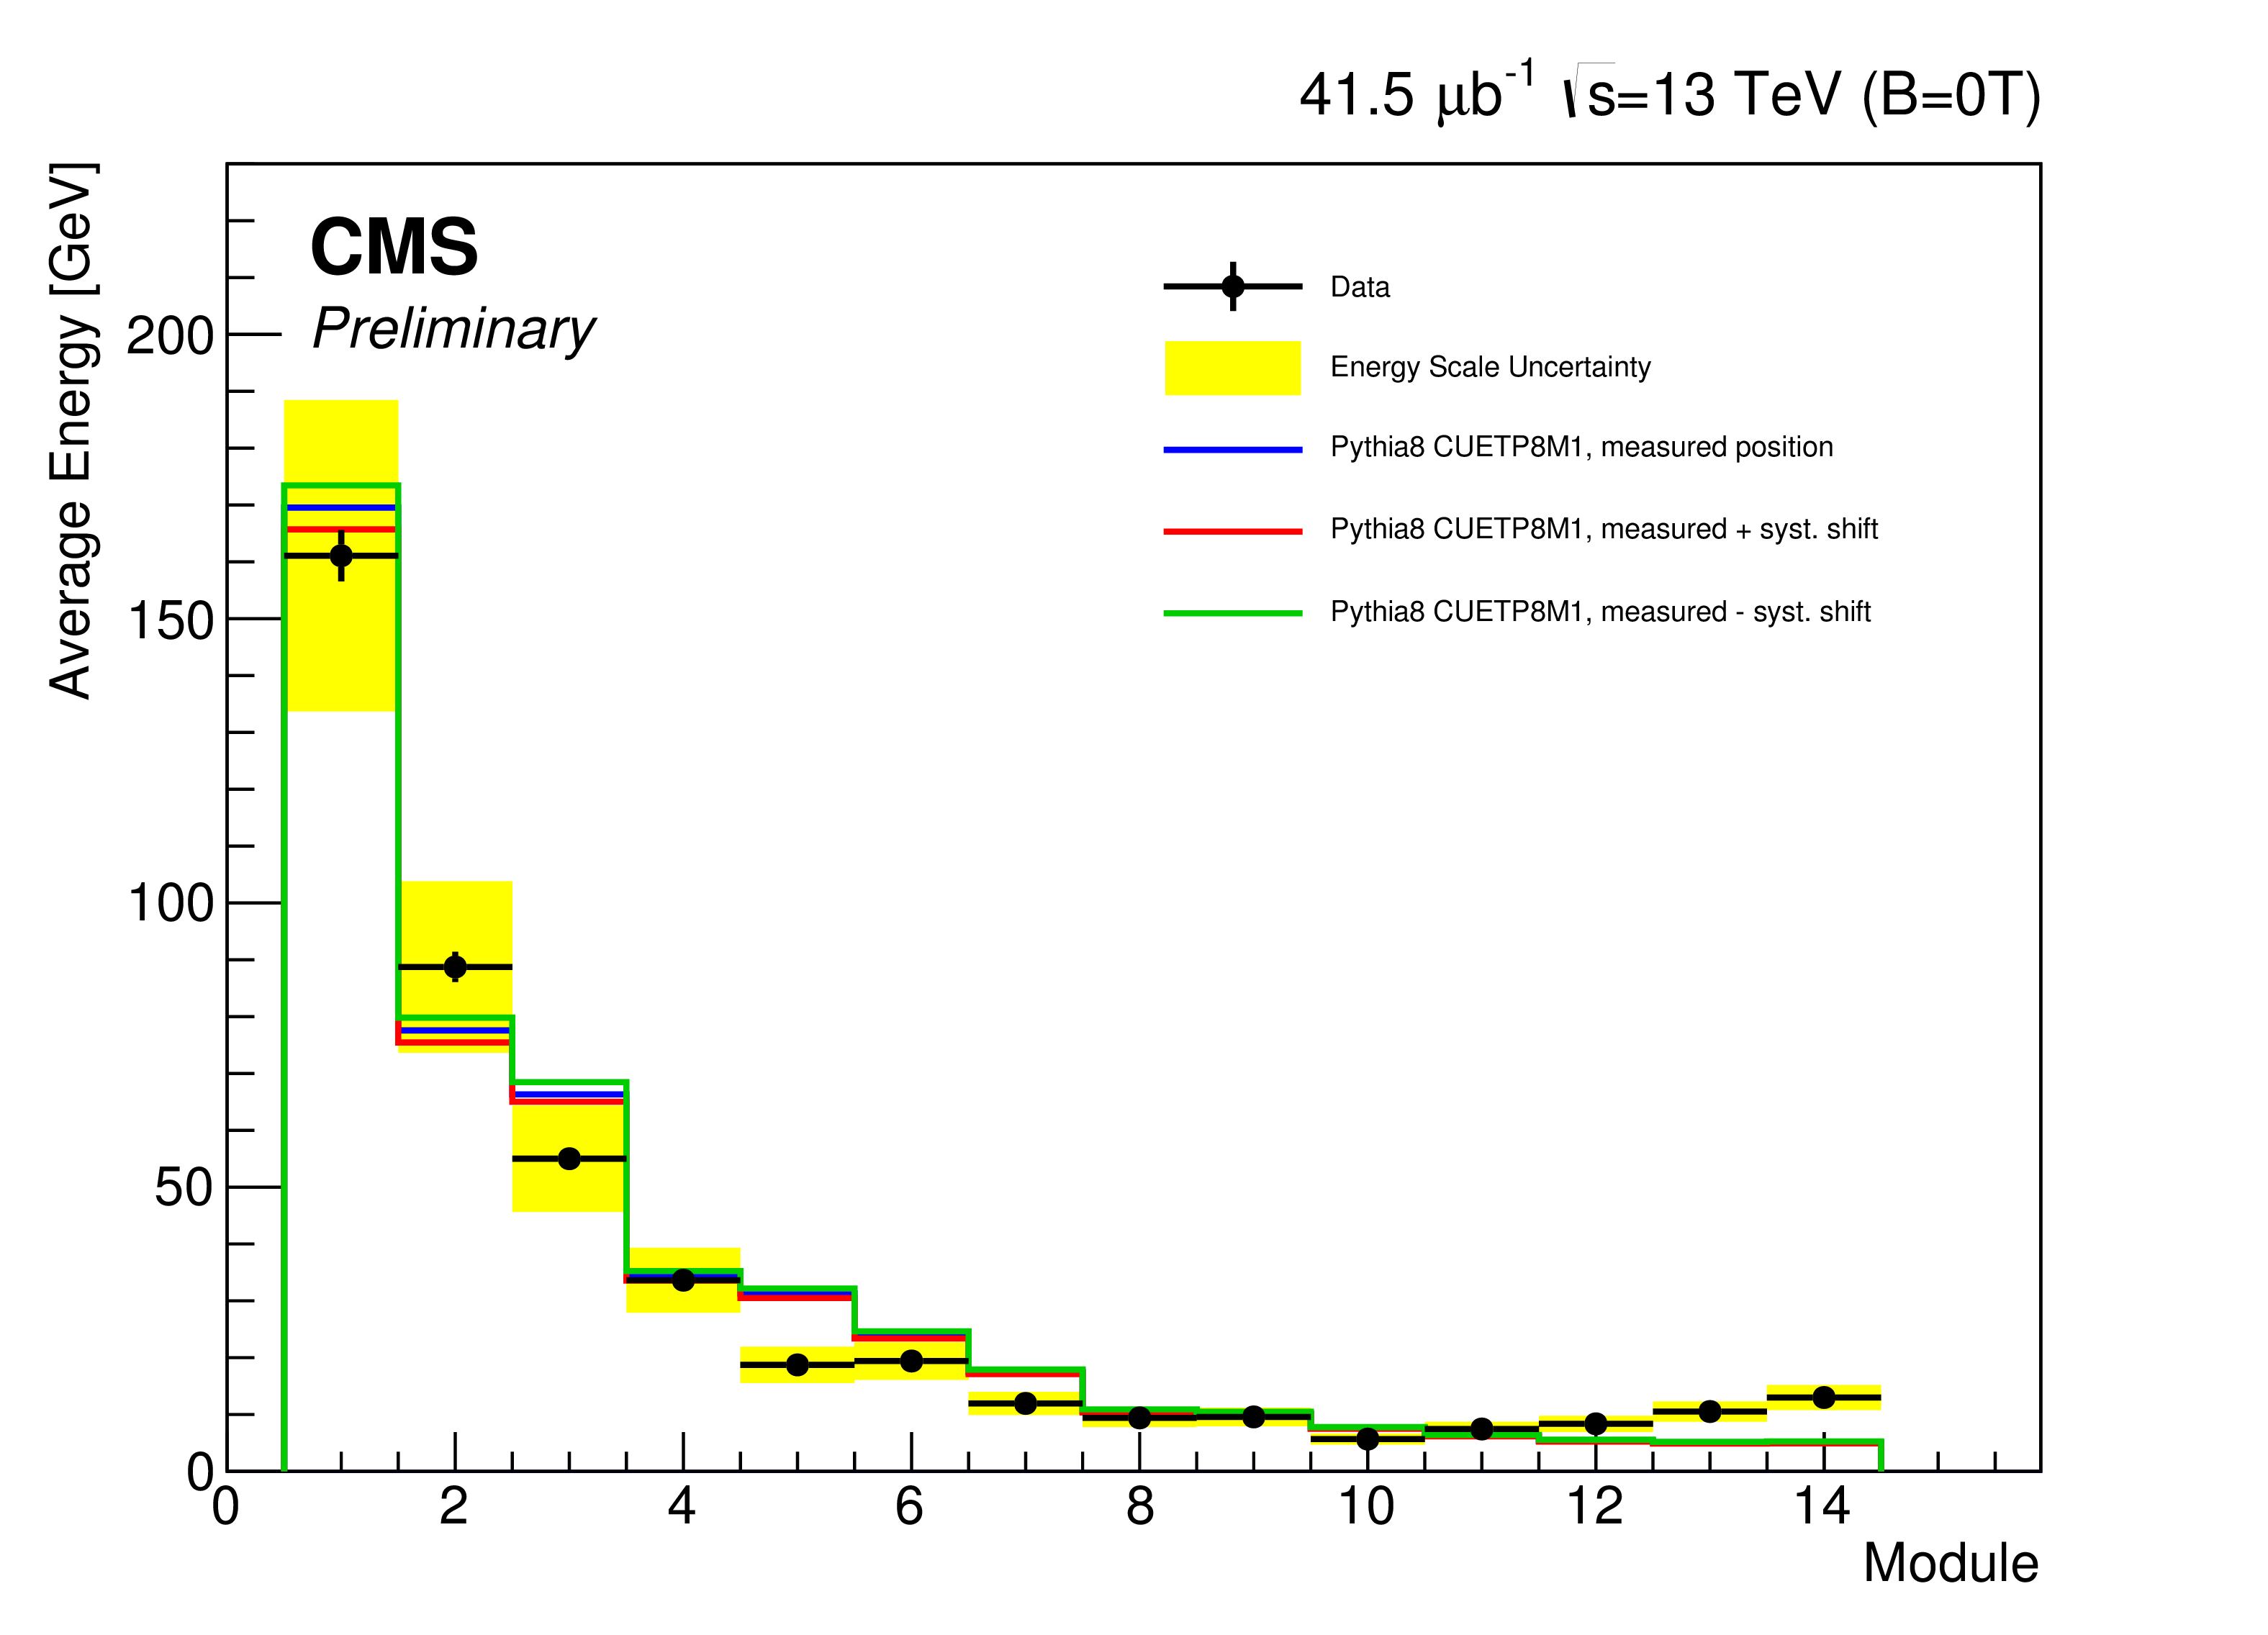
Figure 2:
Profile of the mean energy reconstructed in CASTOR as a function of the longitudinal module. Data is shown with black markers and the energy scale uncertainty as yellow error band. This is compared to Pythia8 CUETP8M1 with the measured CASTOR position as well as with systematic shifts in plus and minus direction. |
png pdf |
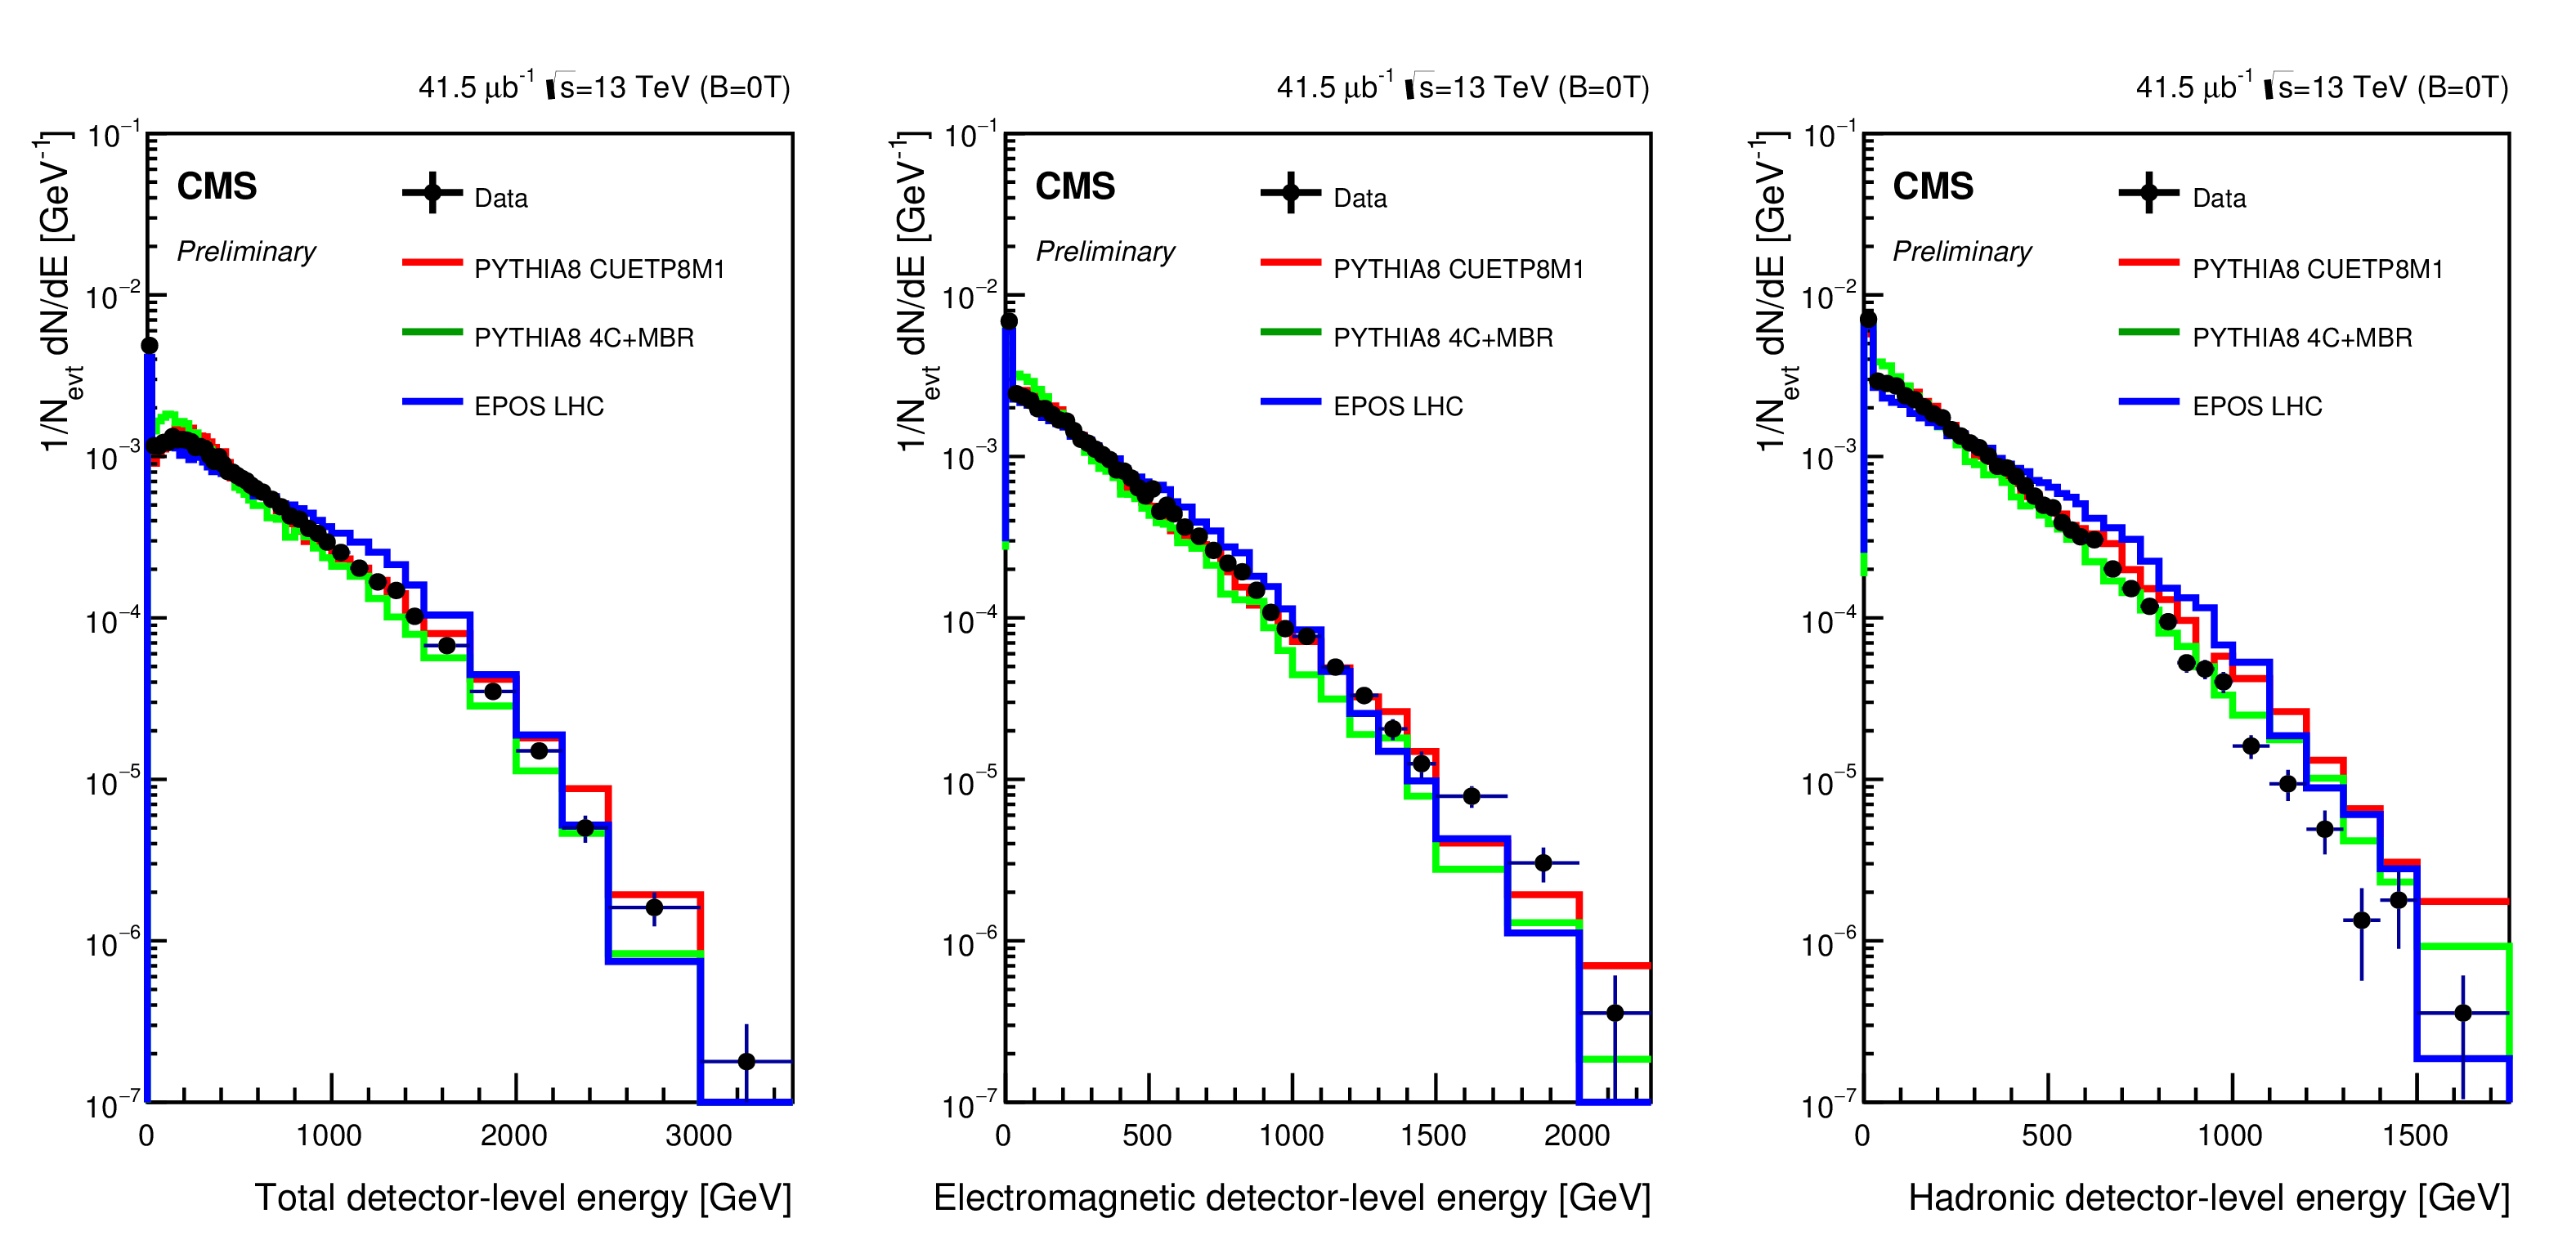
Figure 3:
Spectrum of the total energy reconstructed in CASTOR for the used offline event selection. On the left panel, the total energy is shown, the electromagnetic spectrum on the middle and the hadronic spectrum on the right panel. |
png pdf |
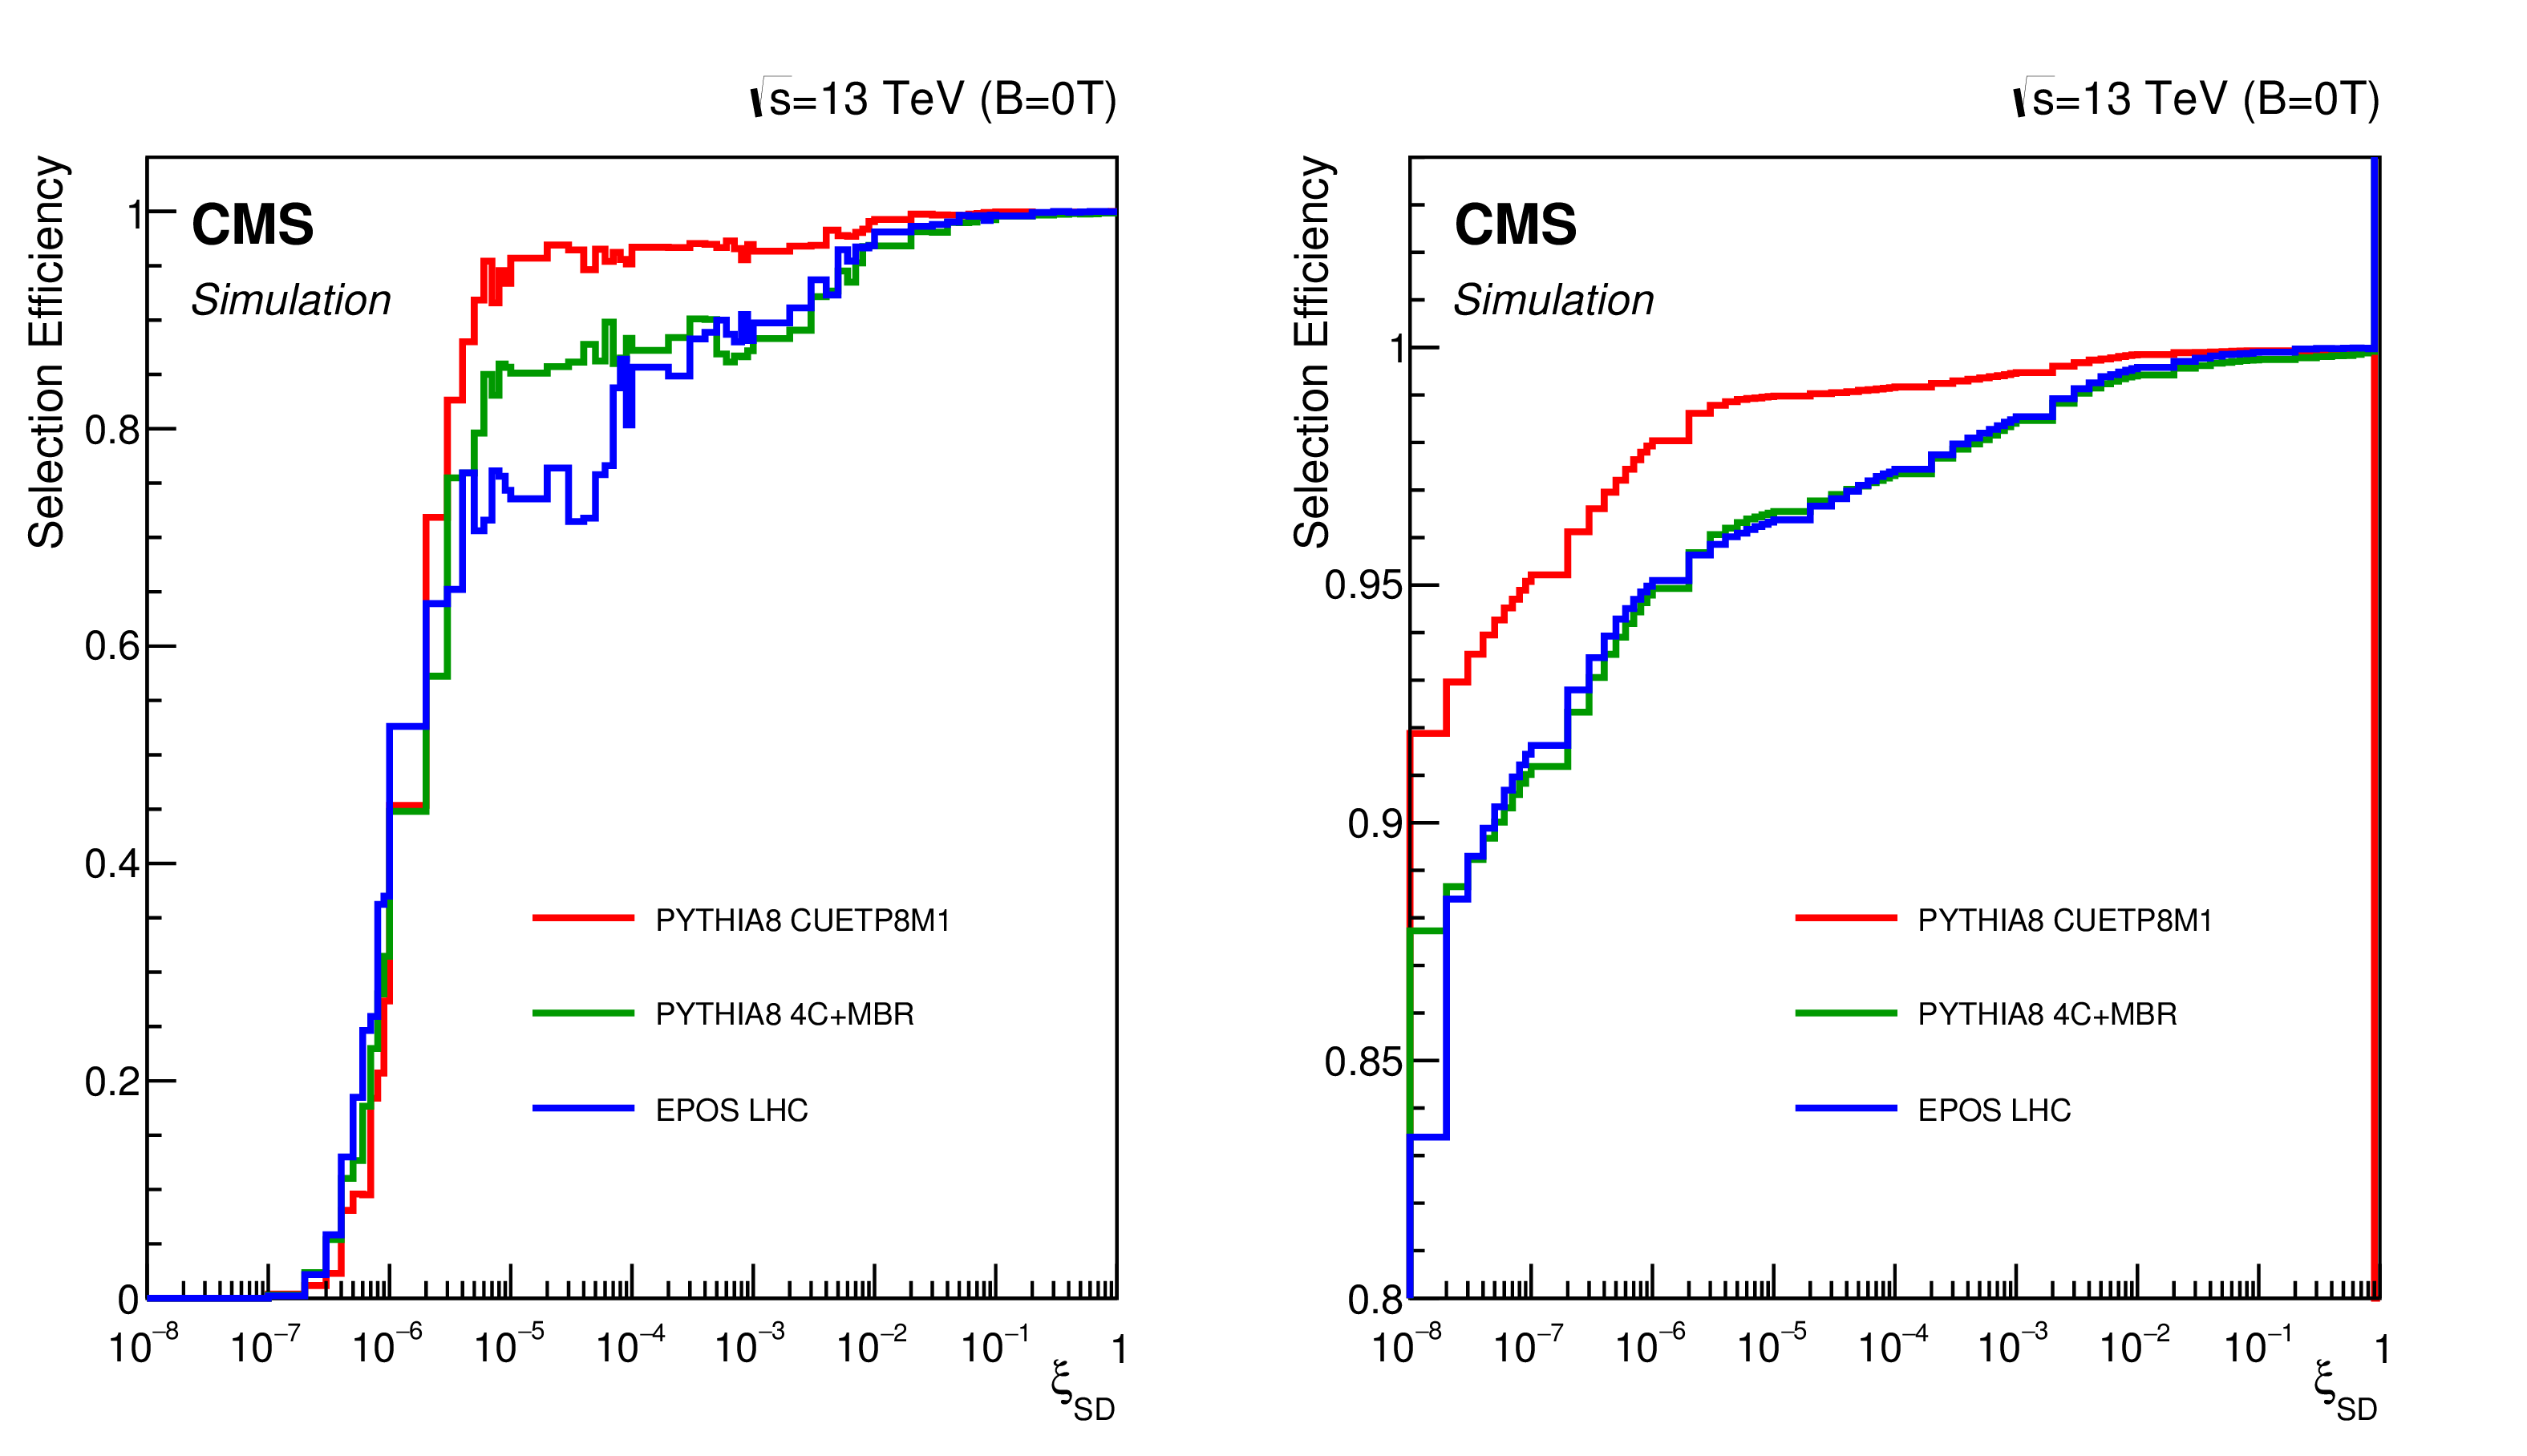
Figure 4:
Selection efficiency of events based on their $\xi _{\rm {SD}}$ values for the described detector level selection determined from full Monte Carlo simulations of the detector. The left panel shows the differential efficiency while the right panel shows the integrated efficiency as a function of the on the selection threshold. |
png pdf |
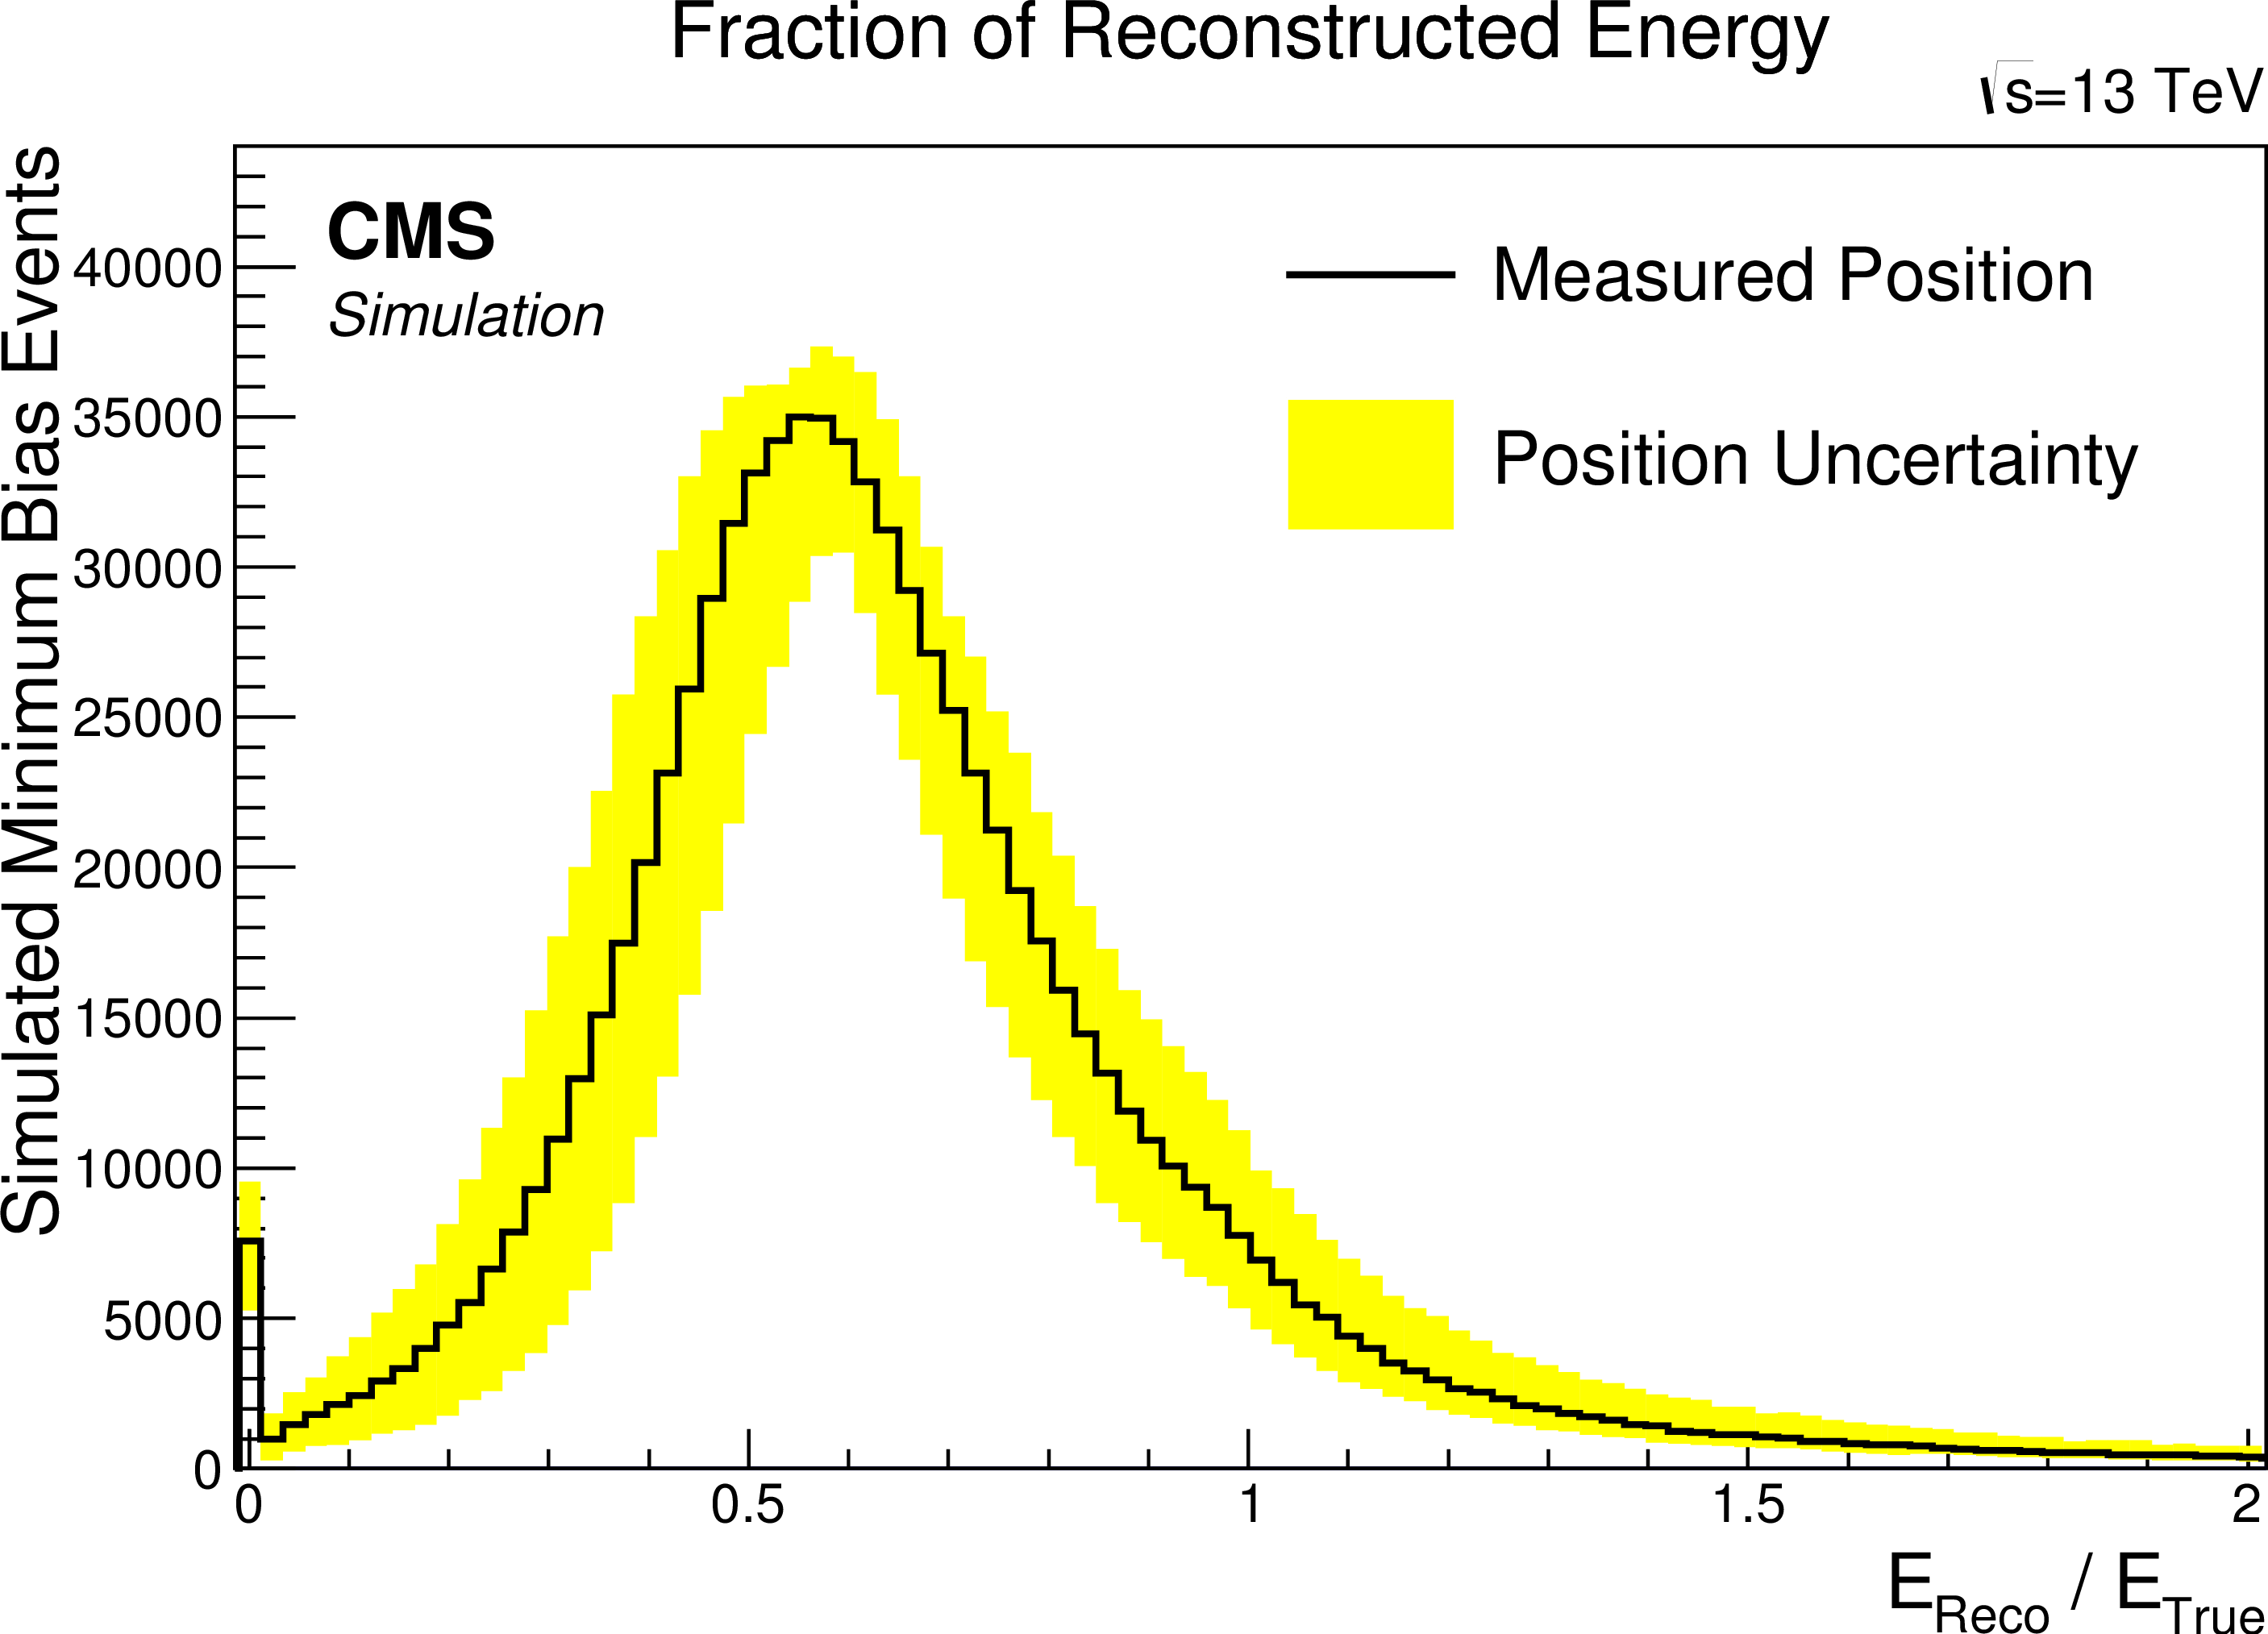
Figure 5:
Distribution of the ratio between reconstructed energy and true energy based on Pythia8 CUETP8M1 and the event selections define in the text. The mean of about 0.6 is due to the non-compensating properties of CASTOR. The yellow error band indicates the uncertainty due to the position uncertainty of CASTOR. |

png pdf |
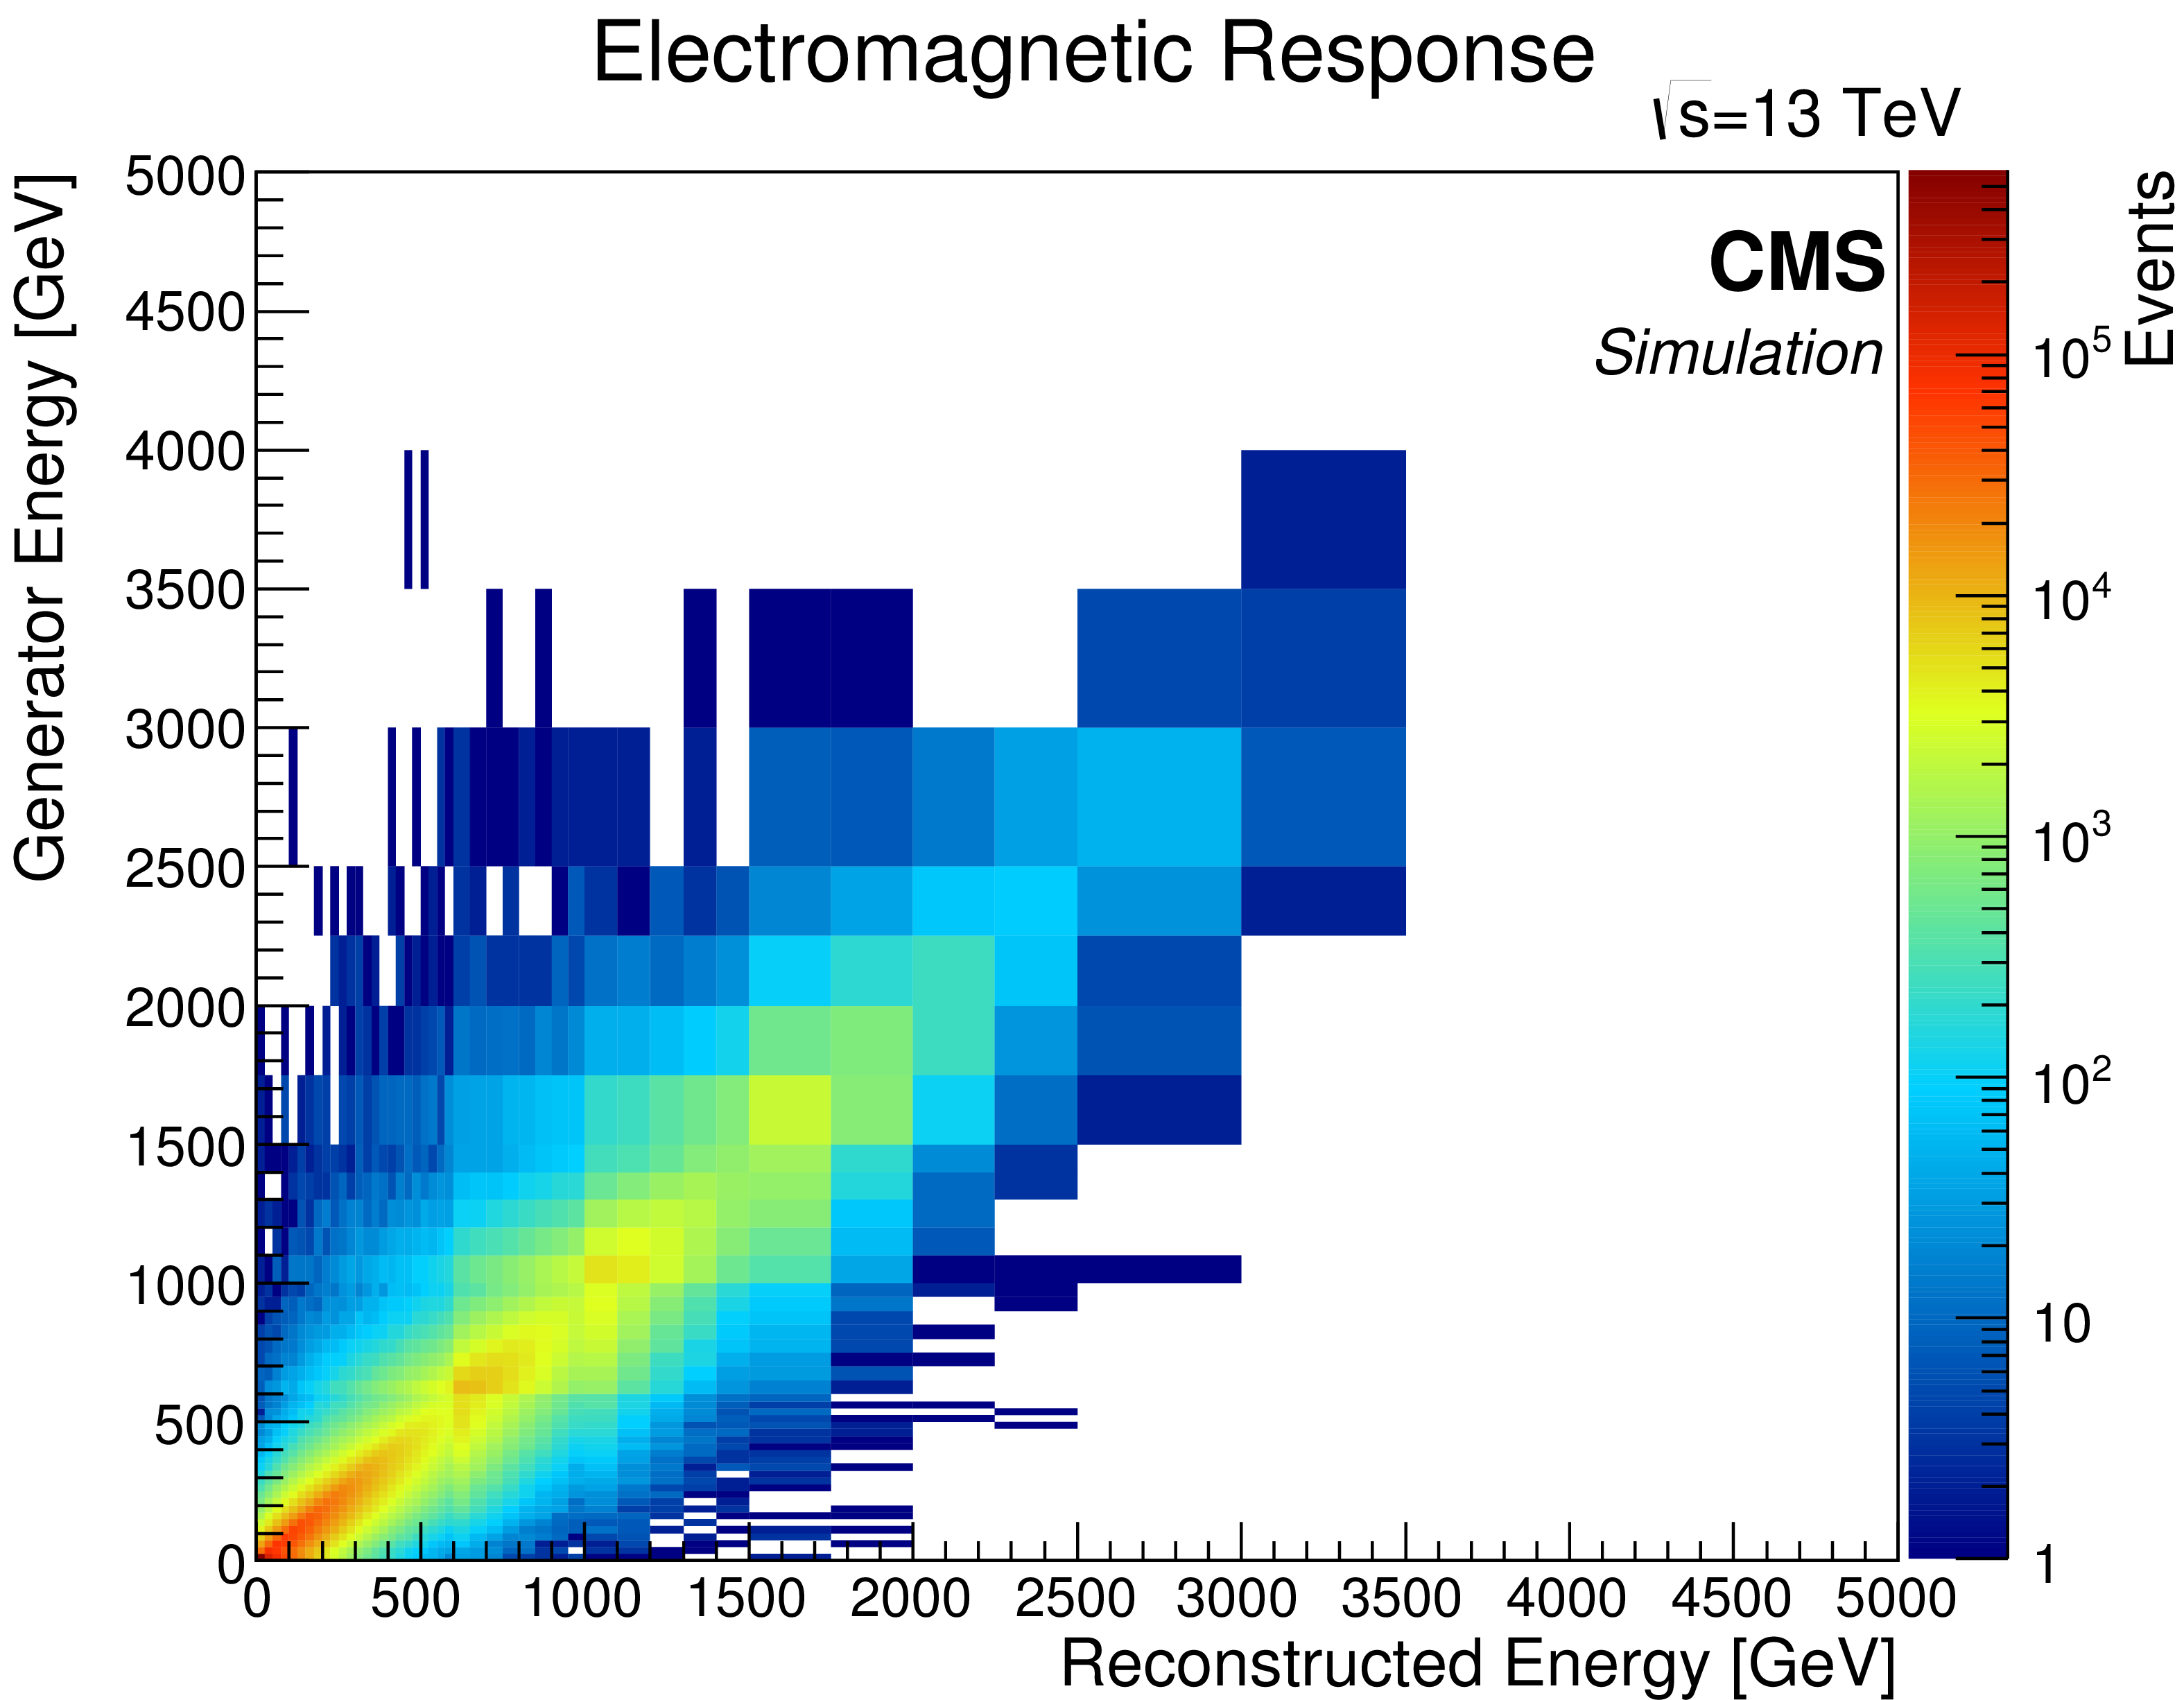
Figure 6-a:
Pythia8 CUETP8M1 response matrices for the total (a) electromagnetic (b) and hadronic (c) energy in CASTOR. The corresponding event selection is defined in the text. |
png pdf |
Figure 6-b:
Pythia8 CUETP8M1 response matrices for the total (a) electromagnetic (b) and hadronic (c) energy in CASTOR. The corresponding event selection is defined in the text. |

png pdf |
Figure 6-c:
Pythia8 CUETP8M1 response matrices for the total (a) electromagnetic (b) and hadronic (c) energy in CASTOR. The corresponding event selection is defined in the text. |
png pdf |
Figure 7-a:
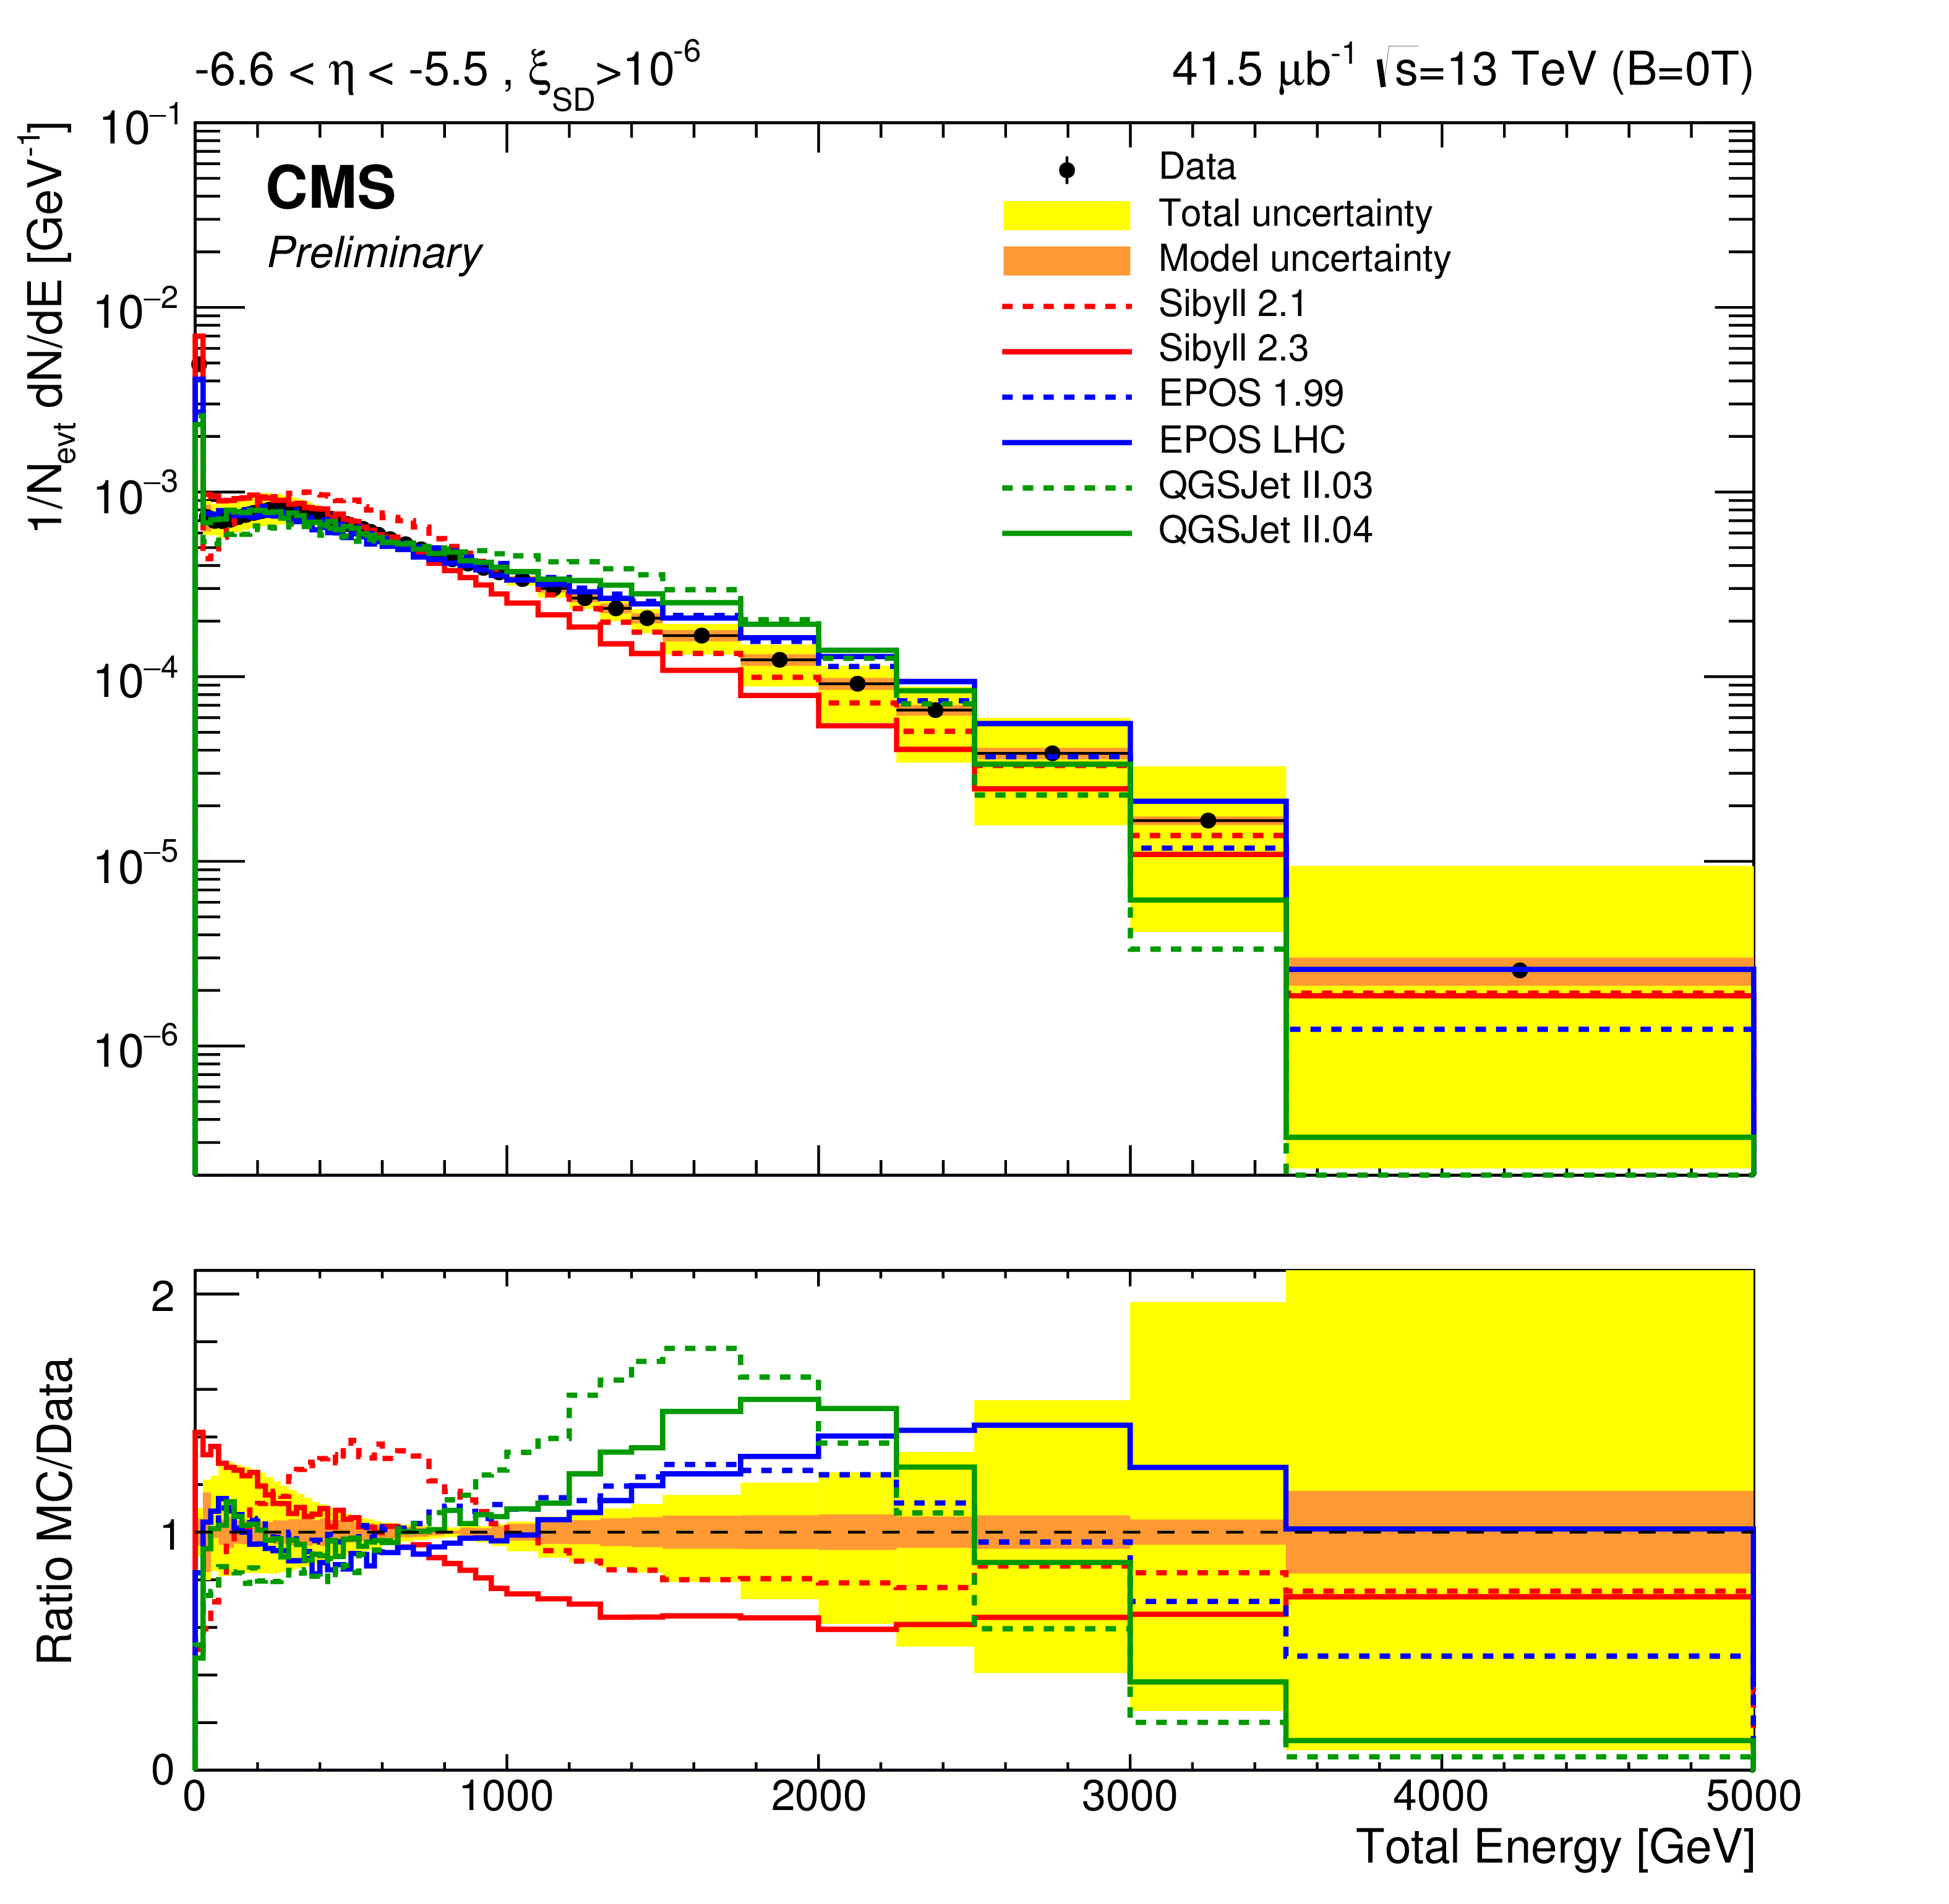
Normalized total energy spectrum in the acceptance of $-6.6<\eta < -5.2$ for events with $\xi _{\rm {SD}}>10^{-6}$. The panel (a) shows the data compared to different cosmic ray motivated models, the panel (b) to variations of Pythia8 and Herwig++ 2.7. |

png pdf |
Figure 7-b:
Normalized total energy spectrum in the acceptance of $-6.6<\eta < -5.2$ for events with $\xi _{\rm {SD}}>10^{-6}$. The panel (a) shows the data compared to different cosmic ray motivated models, the panel (b) to variations of Pythia8 and Herwig++ 2.7. |

png pdf |
Figure 8-a:
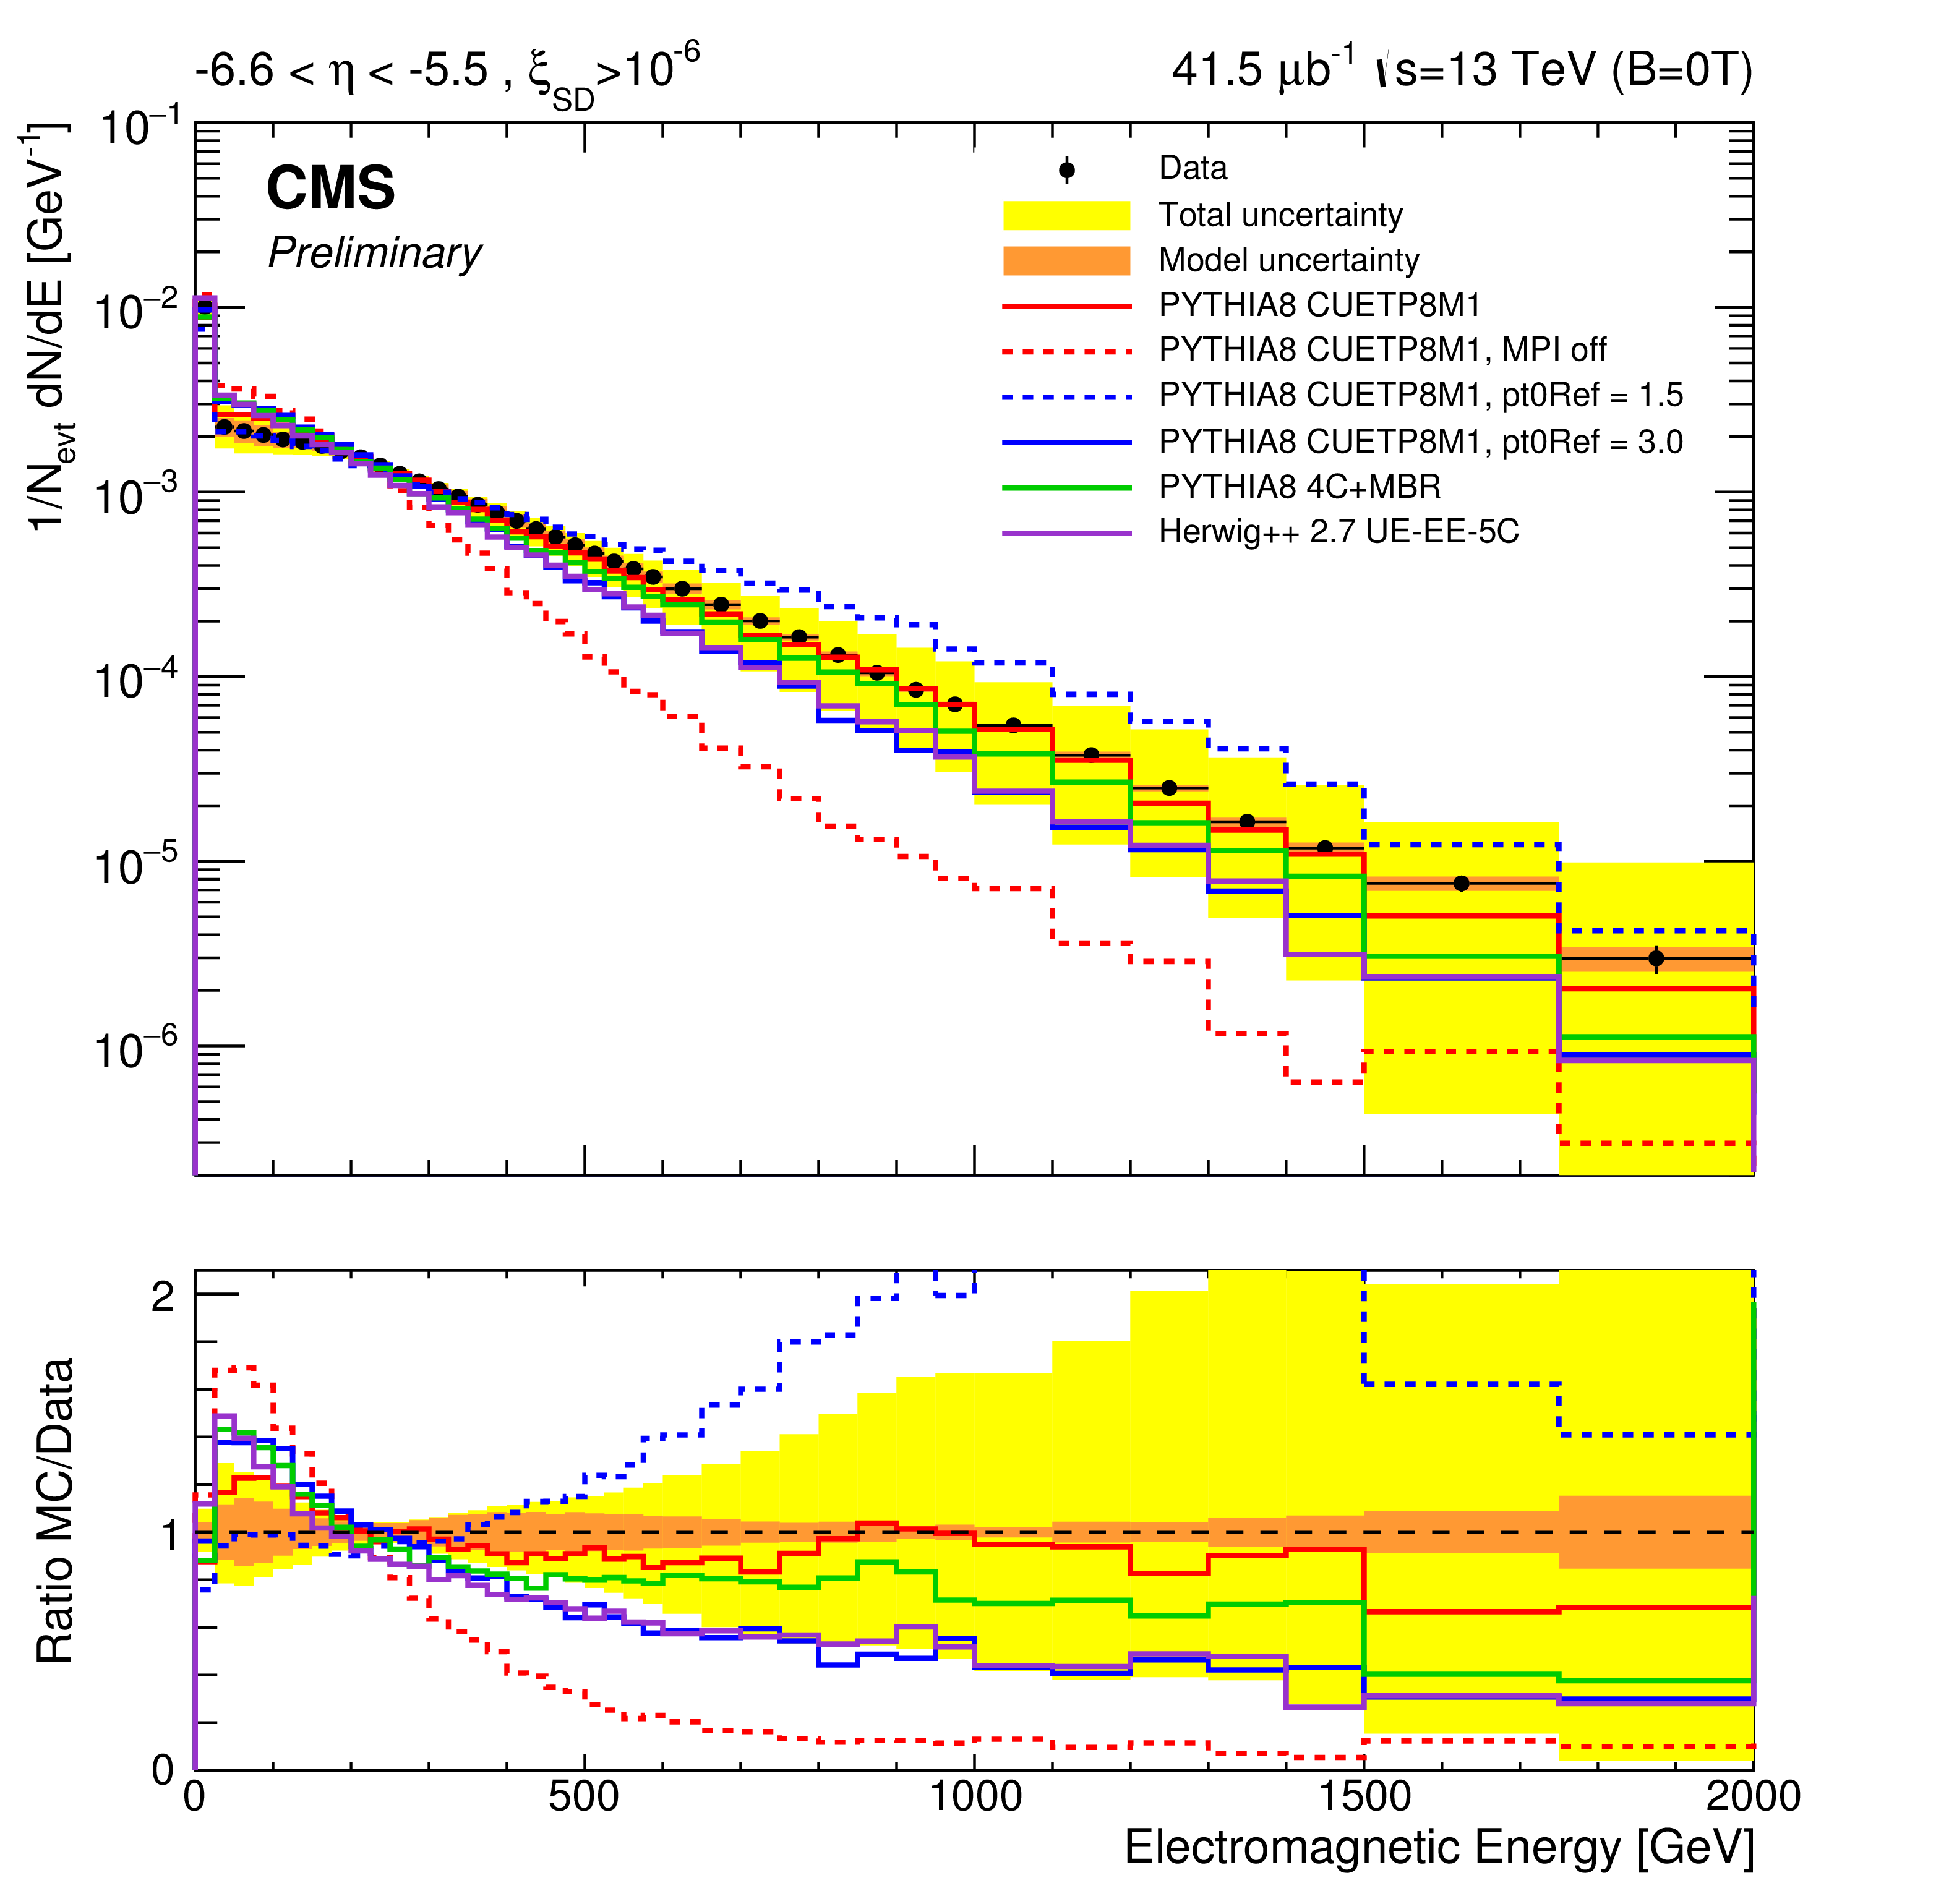
Normalized electromagnetic energy spectrum in the acceptance of $-6.6<\eta < -5.2$ for events with $\xi _{\rm {SD}}>10^{-6}$. The panel (a) shows the data compared to different cosmic ray motivated models, the panel (b) to variations of Pythia8 and Herwig++ 2.7. |
png pdf |
Figure 8-b:
Normalized electromagnetic energy spectrum in the acceptance of $-6.6<\eta < -5.2$ for events with $\xi _{\rm {SD}}>10^{-6}$. The panel (a) shows the data compared to different cosmic ray motivated models, the panel (b) to variations of Pythia8 and Herwig++ 2.7. |
png pdf |
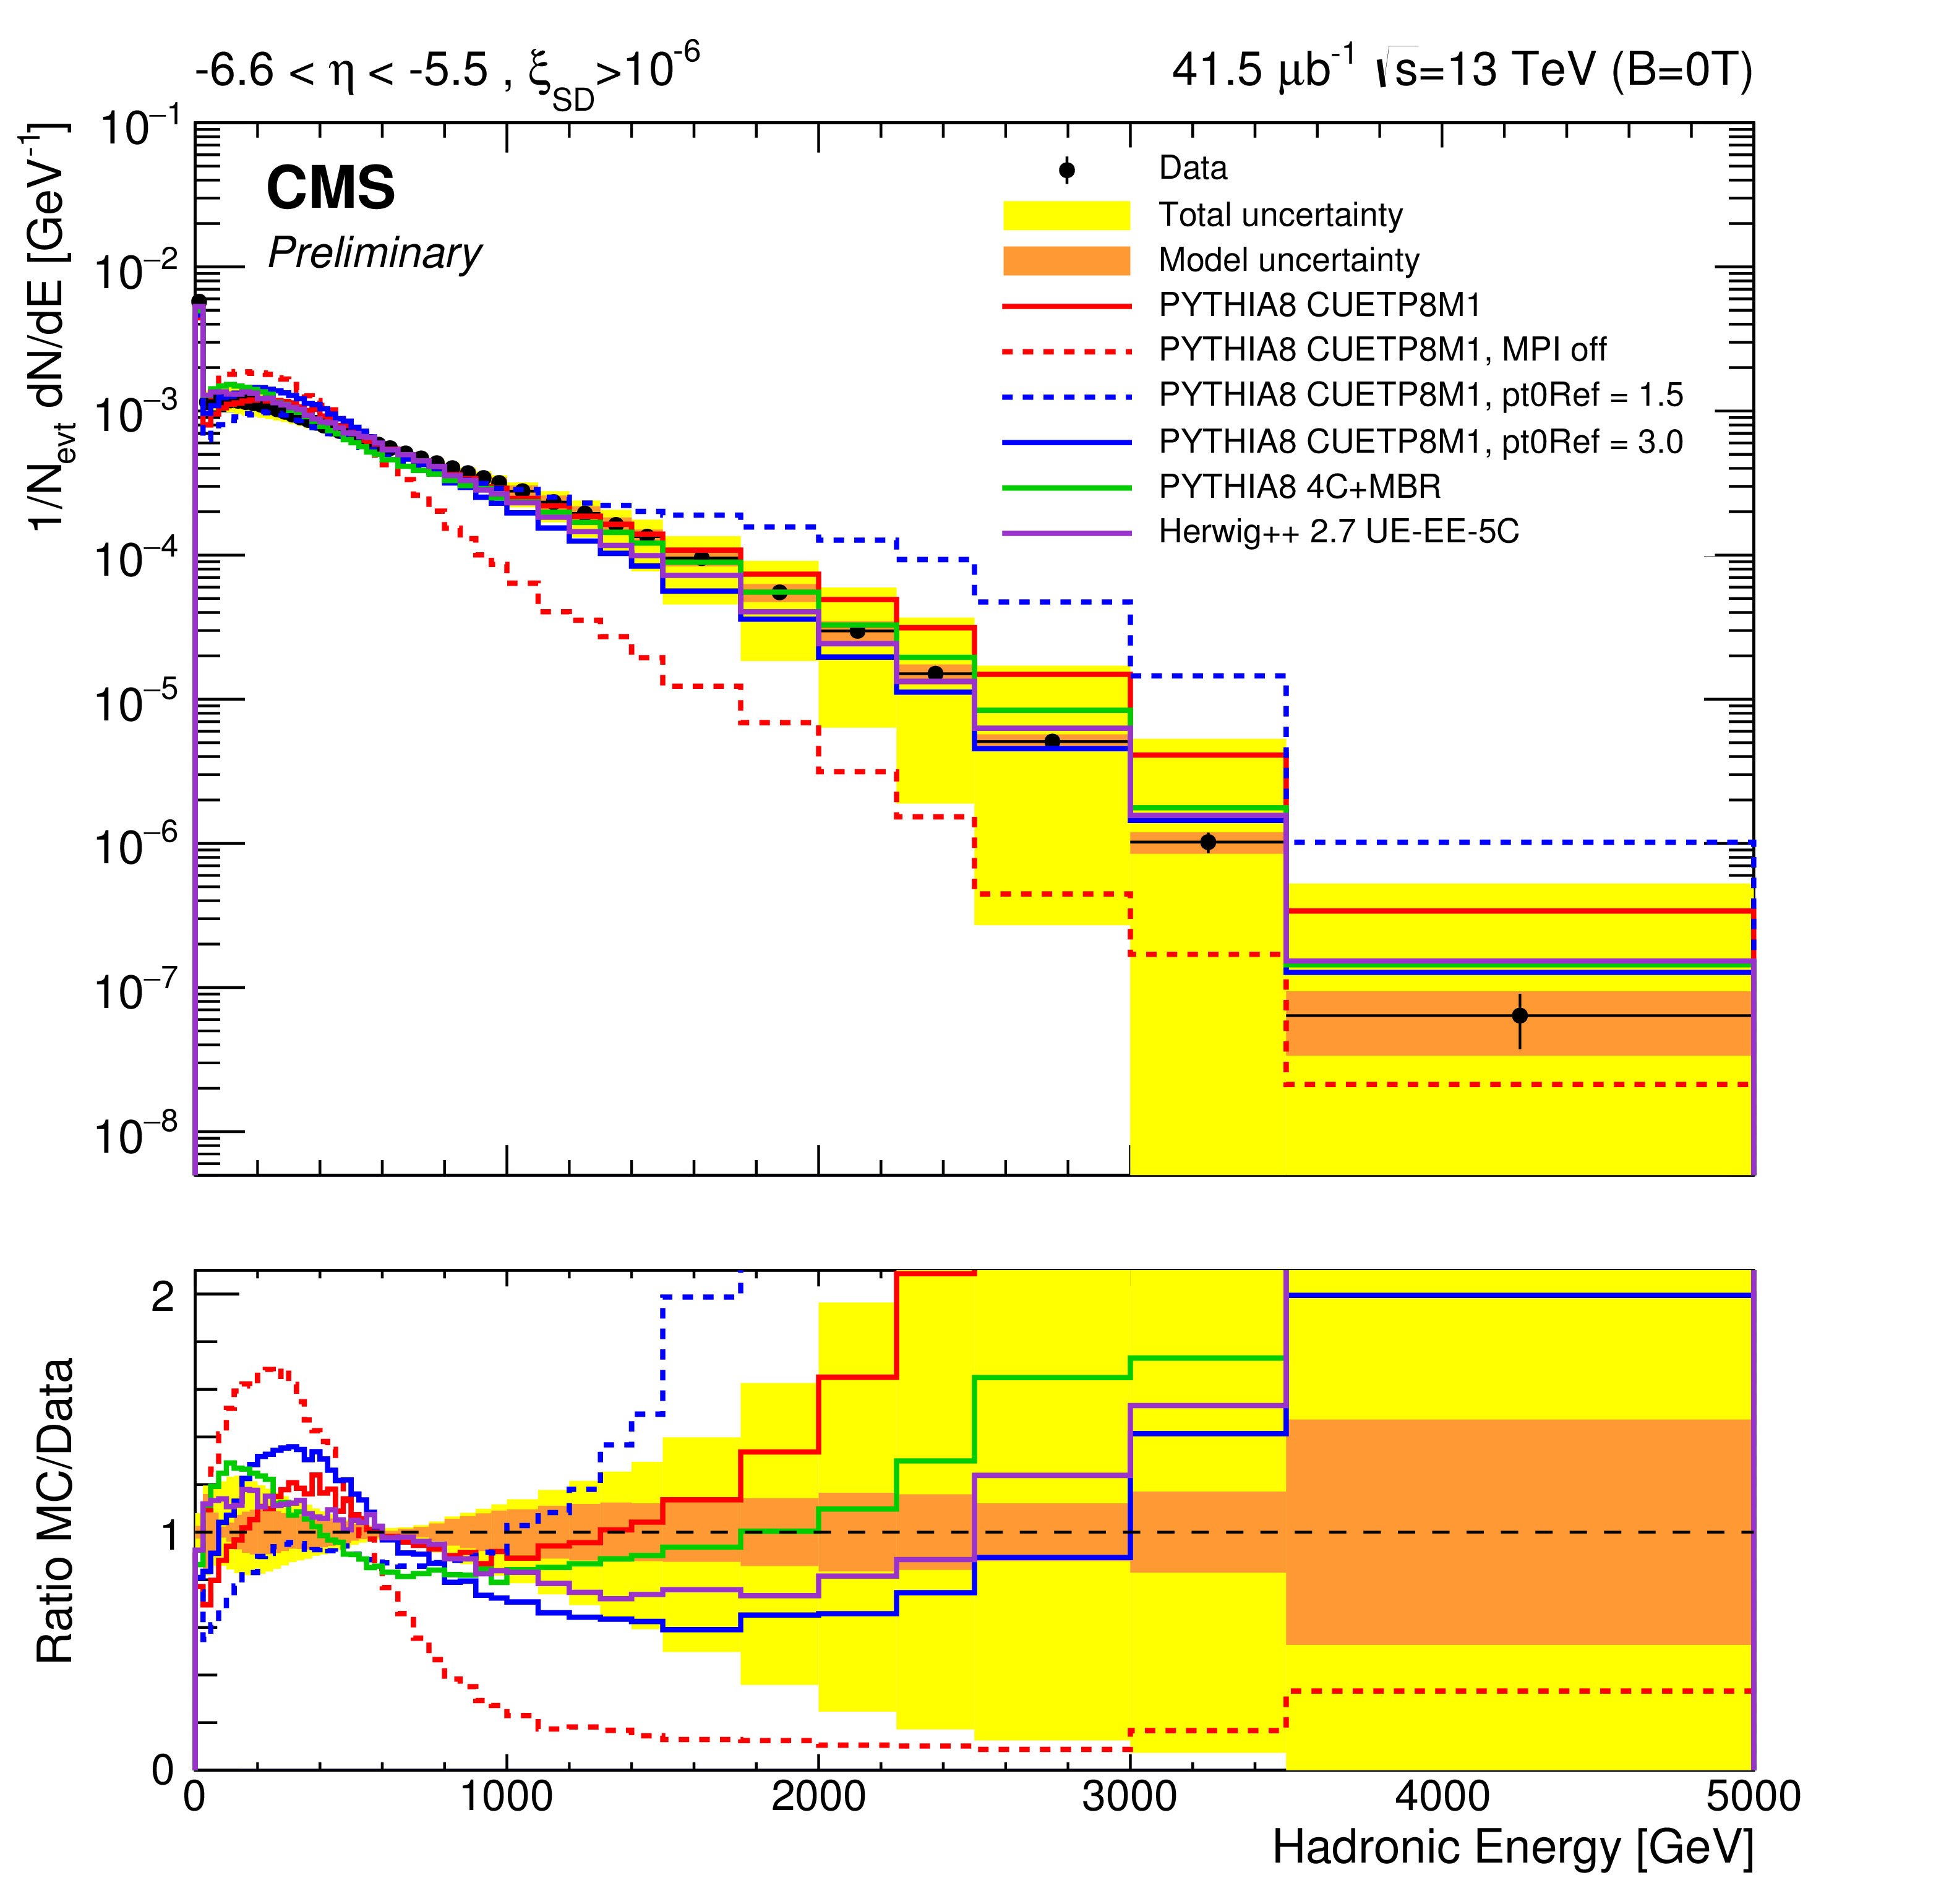
Figure 9-a:
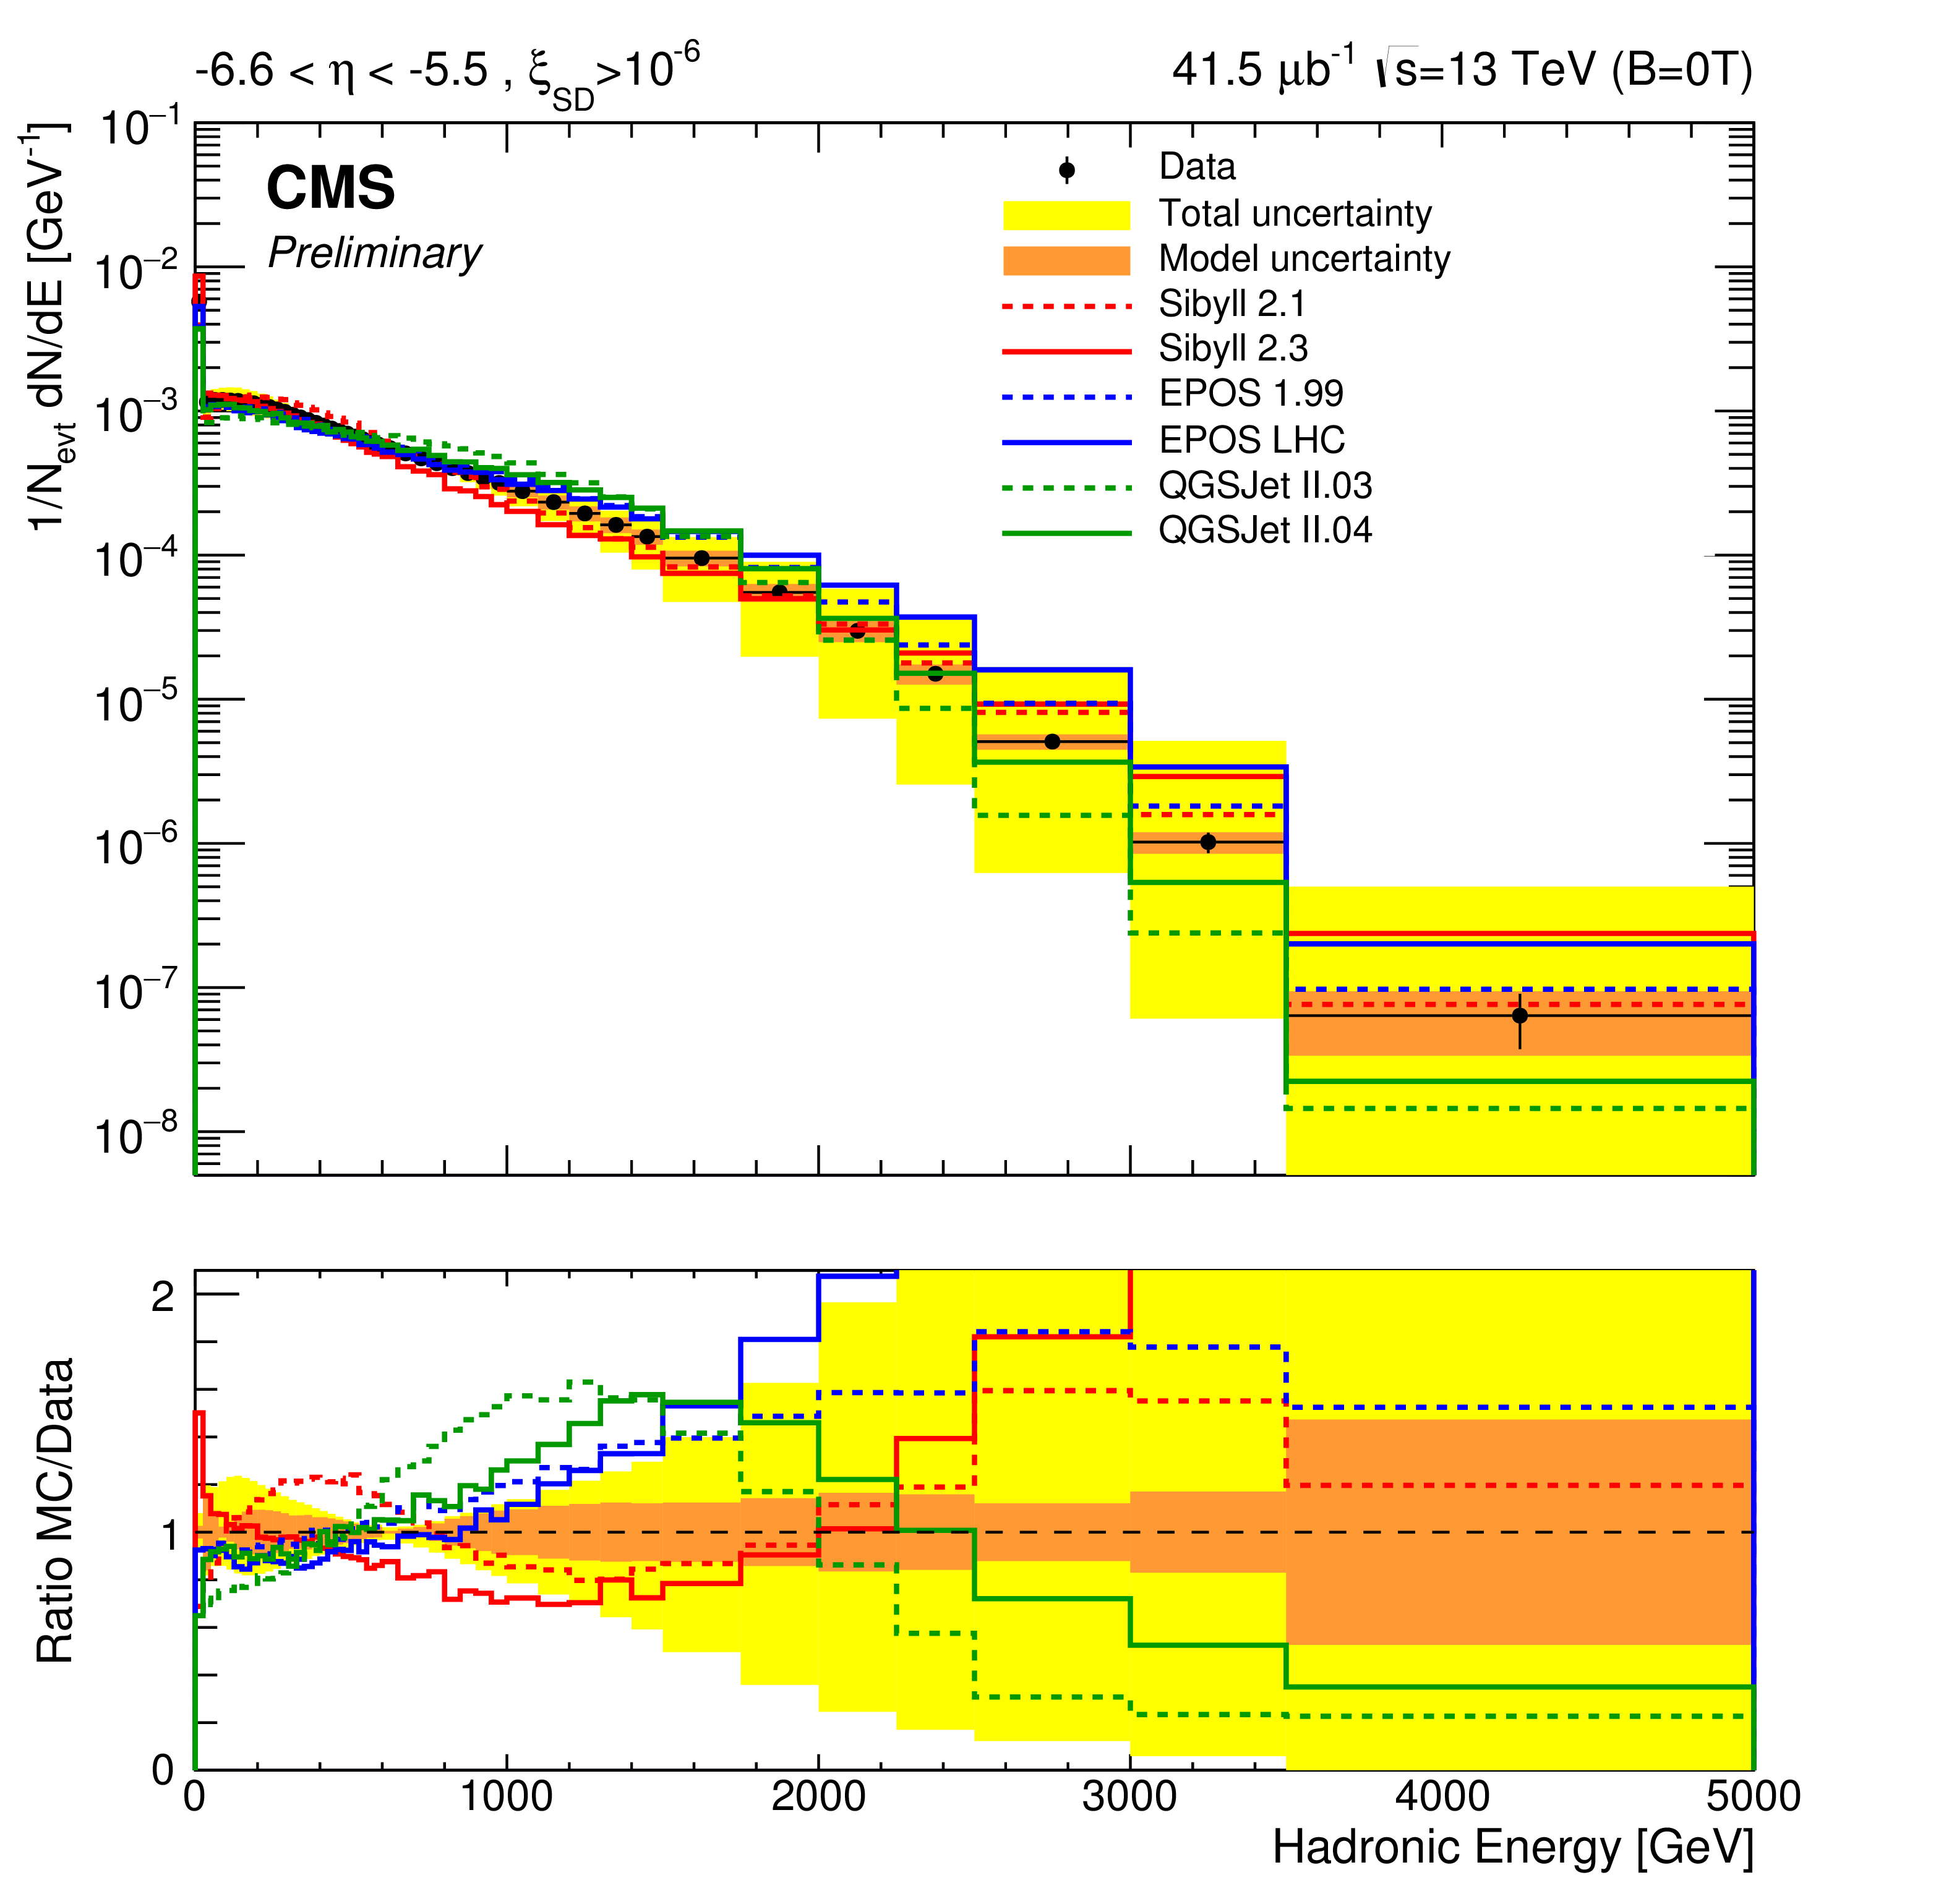
Normalized hadronic energy spectrum in the acceptance of $-6.6<\eta < -5.2$ for events with $\xi _{\rm {SD}}>10^{-6}$. The panel (a) shows the data compared to different cosmic ray motivated models, the panel (b) to variations of Pythia8 and Herwig++ 2.7. |
png pdf |
Figure 9-b:
Normalized hadronic energy spectrum in the acceptance of $-6.6<\eta < -5.2$ for events with $\xi _{\rm {SD}}>10^{-6}$. The panel (a) shows the data compared to different cosmic ray motivated models, the panel (b) to variations of Pythia8 and Herwig++ 2.7. |
| Tables | |

png pdf |
Table 1:
Components of the systematic uncertainty. |
| Summary |
|
The electromagnetic, hadronic and total energy spectra have been measured at 13 TeV with CASTOR and have been fully corrected for detector effects. The total and in particular the hadronic spectra both exhibit a peak at a few hundred GeV followed by a steep tail towards higher energies. The electromagnetic spectrum does not exhibit this structure. It has no bump. Thus, the structure seen in the total energy spectrum is due to the hadronic component. All spectra indicate a sharp peak at zero energy, which corresponds to the residual contribution of diffractive events after the event selection. However the used event selection is not optimized to characterize diffractive events in CASTOR. In Fig. 7, the distribution of the total energy is shown. Despite the significant systematic uncertainties, mainly due to the energy scale, the model predictions show clear differences to the measured data. The bump at a few hundred GeV is also visible in all model predictions. It is best described by QGSJetII.4. The PYTHIA 8 tunes tend to overestimate the contribution of this soft part to the spectrum just as Herwig++ UE-EE-5C which shows the weakest bump-like structure. The high energy tail on the other hand is described by all models within the experimental uncertainties. Only QGSJetII.4 has a too flat total and hadronic spectrum in the range 0.5 TeV $ The electromagnetic spectrum is shown in Fig. 8 and well described by essentially all presented models. Only Pythia8 4C+MBR and Sibyll 2.3 have some problems to model the slope in the soft part of the spectrum up to about 500 GeV. It turns out, that also the electromagnetic energy distribution is very sensitive to MPI. Fig. 9 illustrates the hadronic energy distribution. While the cosmic ray models perform well, EPOS LHC and QGSJetII predict a larger fraction of hadronic energy in the range of 1000-2500 GeV. Sibyll 2.3 on the other hand significantly underestimates this intermediate region and reproduces only a weak bump-like structure. All PYTHIA 8 tunes overestimate the soft region of hadronic energy. At the same time, the high-energy part is also generally overestimated. Thus, PYTHIA 8 clearly favors a different shape compared to data. None of the models consistently describe the shape of all the observations. QGSJetII.4 and Sibyll 2.1 are overall closest to the data, while Pythia8 4C+MBR and Herwig++ UE-EE-5C are furthest away. Furthermore, the presented measurement is sensitive to properties of the multi-parton intercation and the underlying event. The prediction of Pythia8 CUETP8M1 without multi-parton interactions is ruled out by the data and is too steep in all spectra. It is furthermore shown, that the data is very sensitive to changes in the scaling parameter pT0Ref which is the MPI $p_{\mathrm{T}}$ cut-off at the nominal reference energy of 7000 GeV for CUETP8M1. Large deviations from the CUETP8M1 default value of 2.4024 GeV change the MPI-associated activity and are inconsistent with the data. Concerning the cosmic ray motivated models, it can be observed that the changes introduced after the first tuning to LHC collision data at 900 GeV, 7, and 8 TeV tend to improve the agreement to the measurement, especially for QGSJetII.3 and EPOS 1.99. Only the recent Sibyll 2.3 update has not improved the agreement with respect to the previous version Sibyll 2.1. This is in particular interesting, since Sibyll 2.1 had a very good overall agreement with the data. Since an increased fraction of energy directed to hadronic energy has the effect to produce more muons in extensive air showers, the presented data will be very important to better understand the muon production in air showers in the future. Due to the rather complicated shape of all presented spectra, no conclusive answer about this can be given here. However, the data indicate that EPOS and QGSJettII are already at the upper edge of hadronic particle production. In Sibyll, on the other hand, there is significant extra room to boost muon production via additional hadronic energy. |
|
|
Compact Muon Solenoid LHC, CERN |
|

|

|

|

|

|