

Compact Muon Solenoid
LHC, CERN
| CMS-PAS-FSQ-16-003 | ||
| Measurement of the very forward inclusive jet cross section in pp collisions at $\sqrt{s}=$ 13 TeV with CMS | ||
| CMS Collaboration | ||
| April 2016 | ||
| Abstract: The measurement of very forward jets at 13 TeV in proton-proton collisions with CMS is reported. Such jets, in particular when correlated to other objects, are the most sensitive probes of the small-x parton dynamics in the proton. In this paper we demonstrate the fundamental capabilities of jet reconstruction with CMS using the CASTOR detector at a pseudorapidity of $-6.6<\eta<-5.2$. The data is corrected for all detector effects and compared to model calculations. Models based on Gribov-Regge calculations tend to predict a slightly softer spectrum in contrast to PYTHIA tunes. The data indicates a spectrum more consistent with the shape predicted by PYTHIA, however, the data are compatible with all models within the experimental uncertainties. | ||
| Links: CDS record (PDF) ; inSPIRE record ; CADI line (restricted) ; | ||
| Figures | |

png pdf |
Figure 1-a:
a: Multiplicity distribution of reconstructed jets in CASTOR. b: Distribution of the number of ranges of CASTOR towers merged into a jet. Both plots are for jets with $p_{\mathrm{T}} >$ 3 GeV. Simulations are done with CASTOR at measured position and the magnetic field of CMS switched off. |

png pdf |
Figure 1-b:
a: Multiplicity distribution of reconstructed jets in CASTOR. b: Distribution of the number of ranges of CASTOR towers merged into a jet. Both plots are for jets with $p_{\mathrm{T}} >$ 3 GeV. Simulations are done with CASTOR at measured position and the magnetic field of CMS switched off. |
png pdf |
Figure 2:
Reconstructed uncorrected jet-$ {p_{\mathrm {T}}}$ spectrum. Simulations are done with CASTOR at measured position. During data taking the magnet field was turned off. |
png pdf |
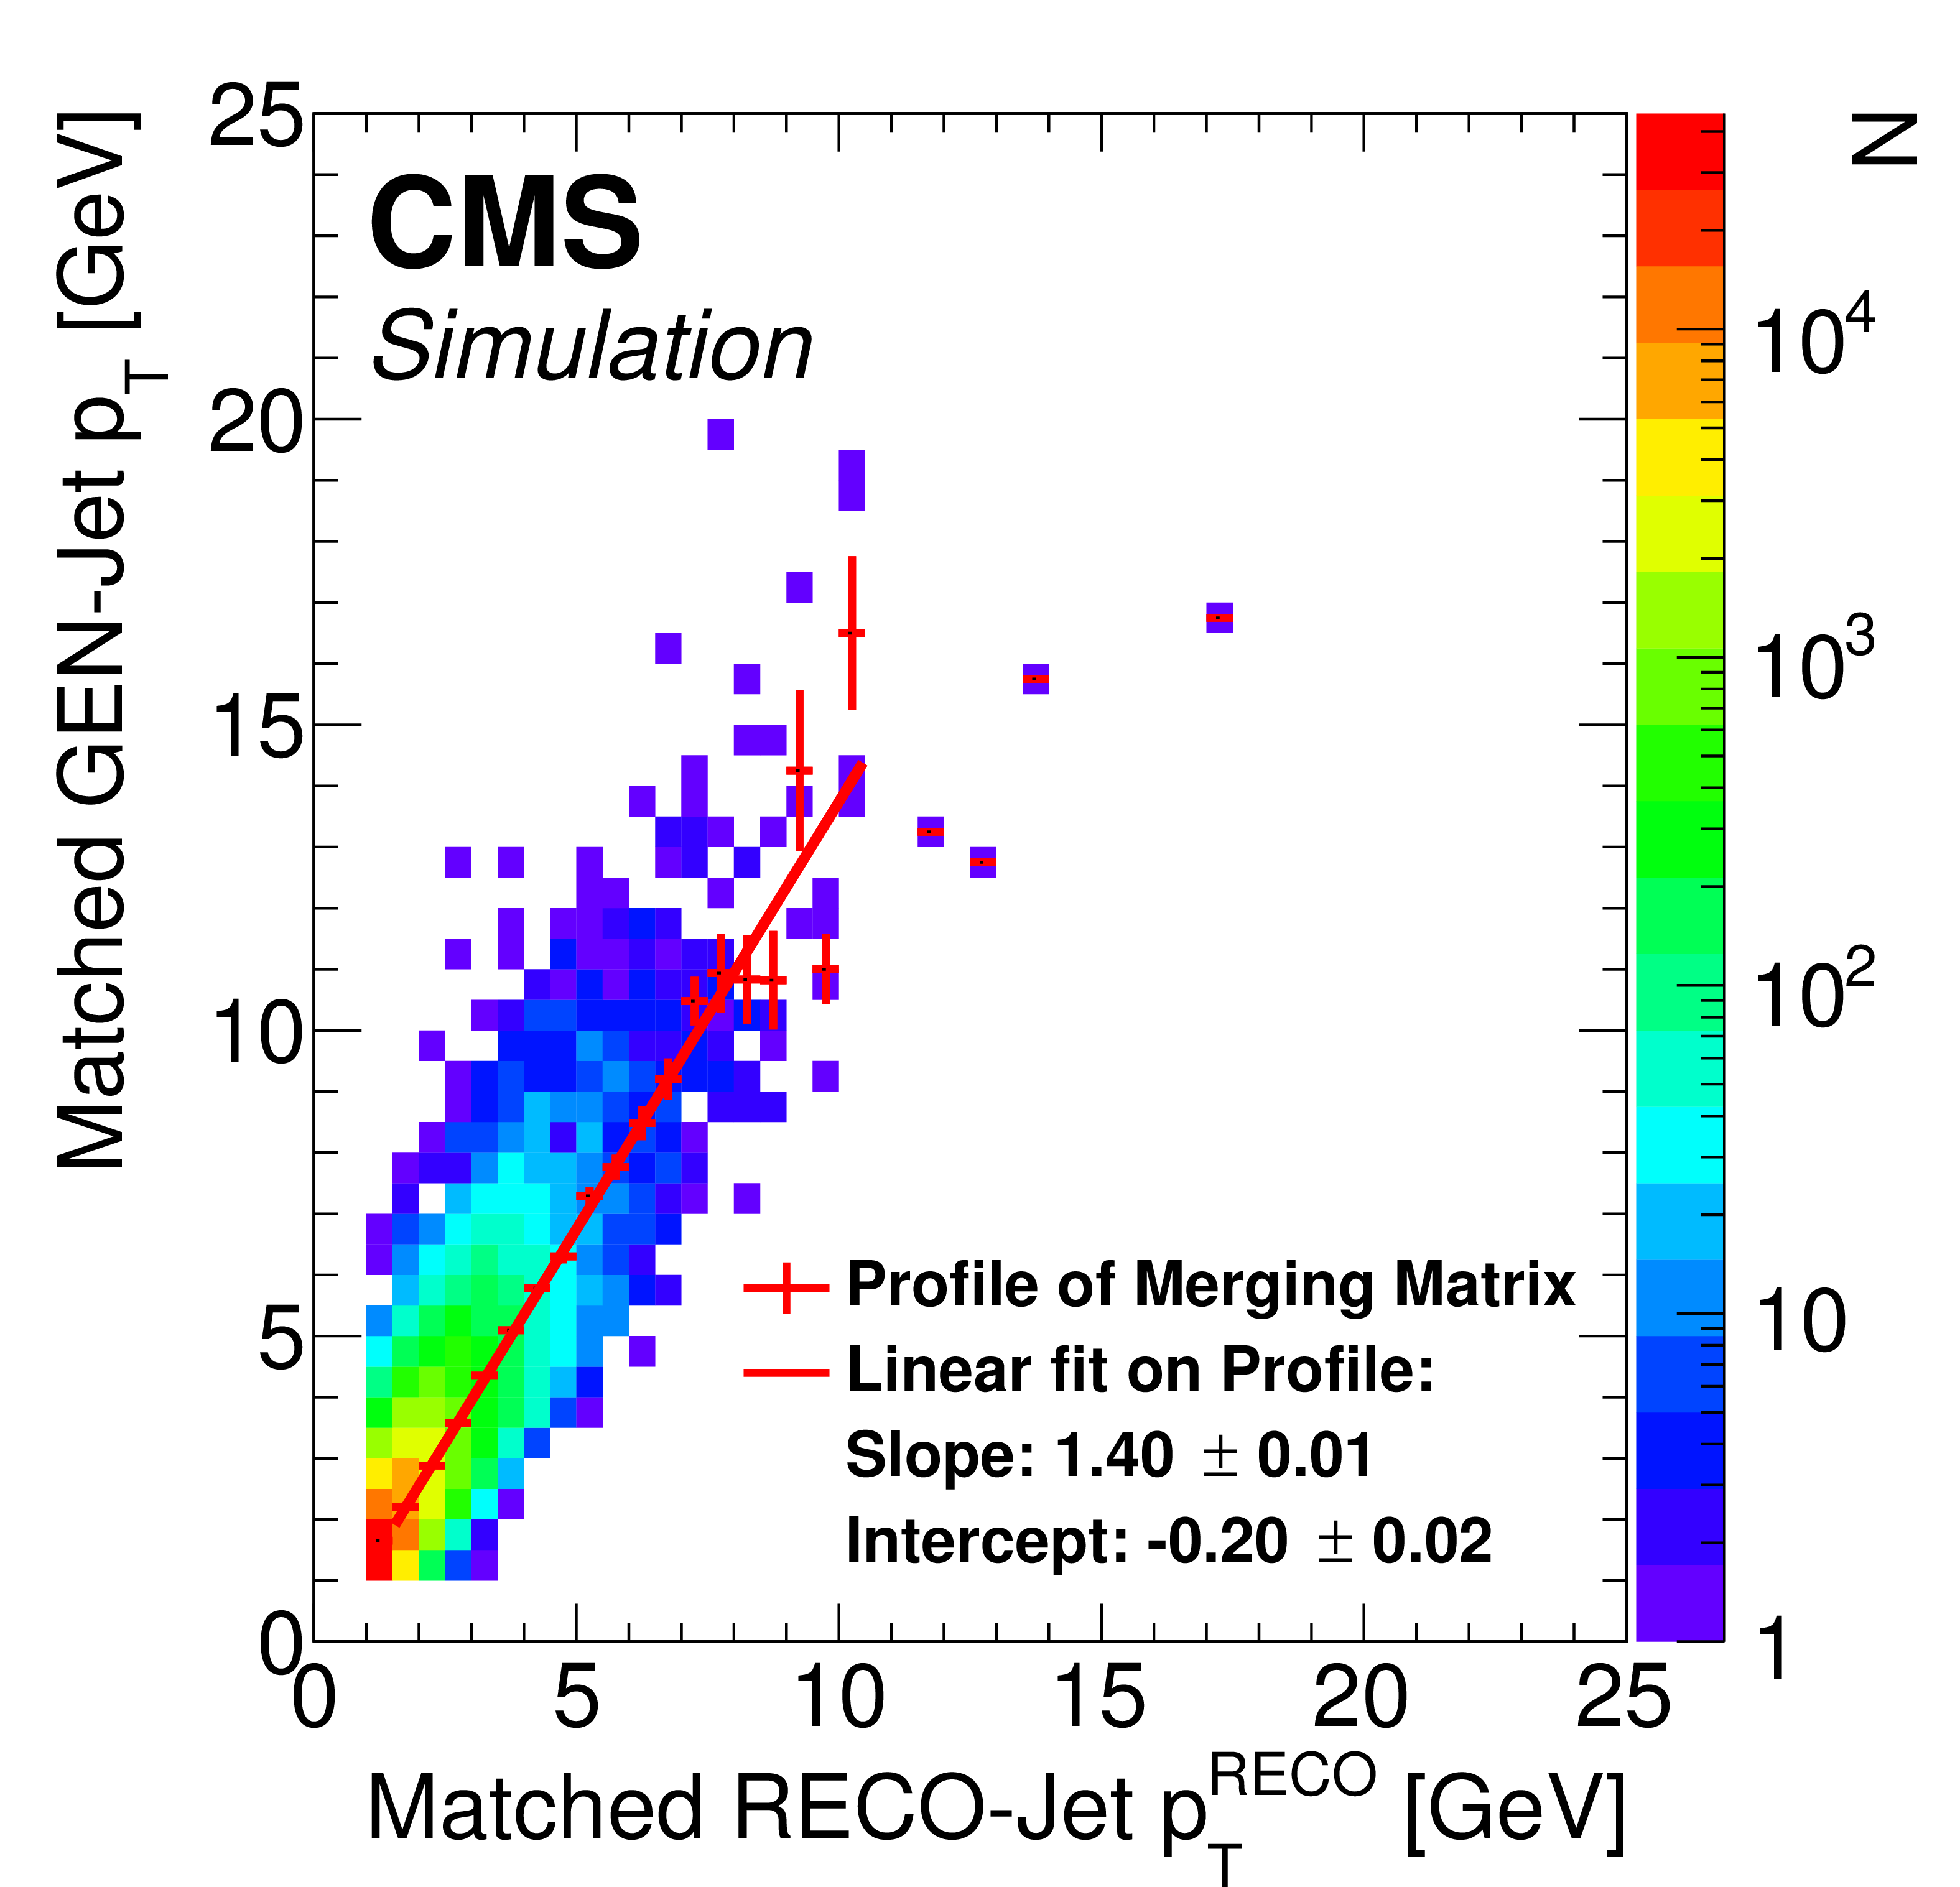
Figure 3:
The jet ${p_{\mathrm {T}}}$ calibration curve determined from Monte Carlo simulations with EPOS-LHC. Shown is the correlation between reconstructed jet-$ {p_{\mathrm {T}}}$ to generated jet-$ {p_{\mathrm {T}}}$ for a tight high-quality isolated jet selection. The red dots show the average value including the RMS of it, which is parameterized with a linear function in order to obtain the calibration relation. |
png pdf |
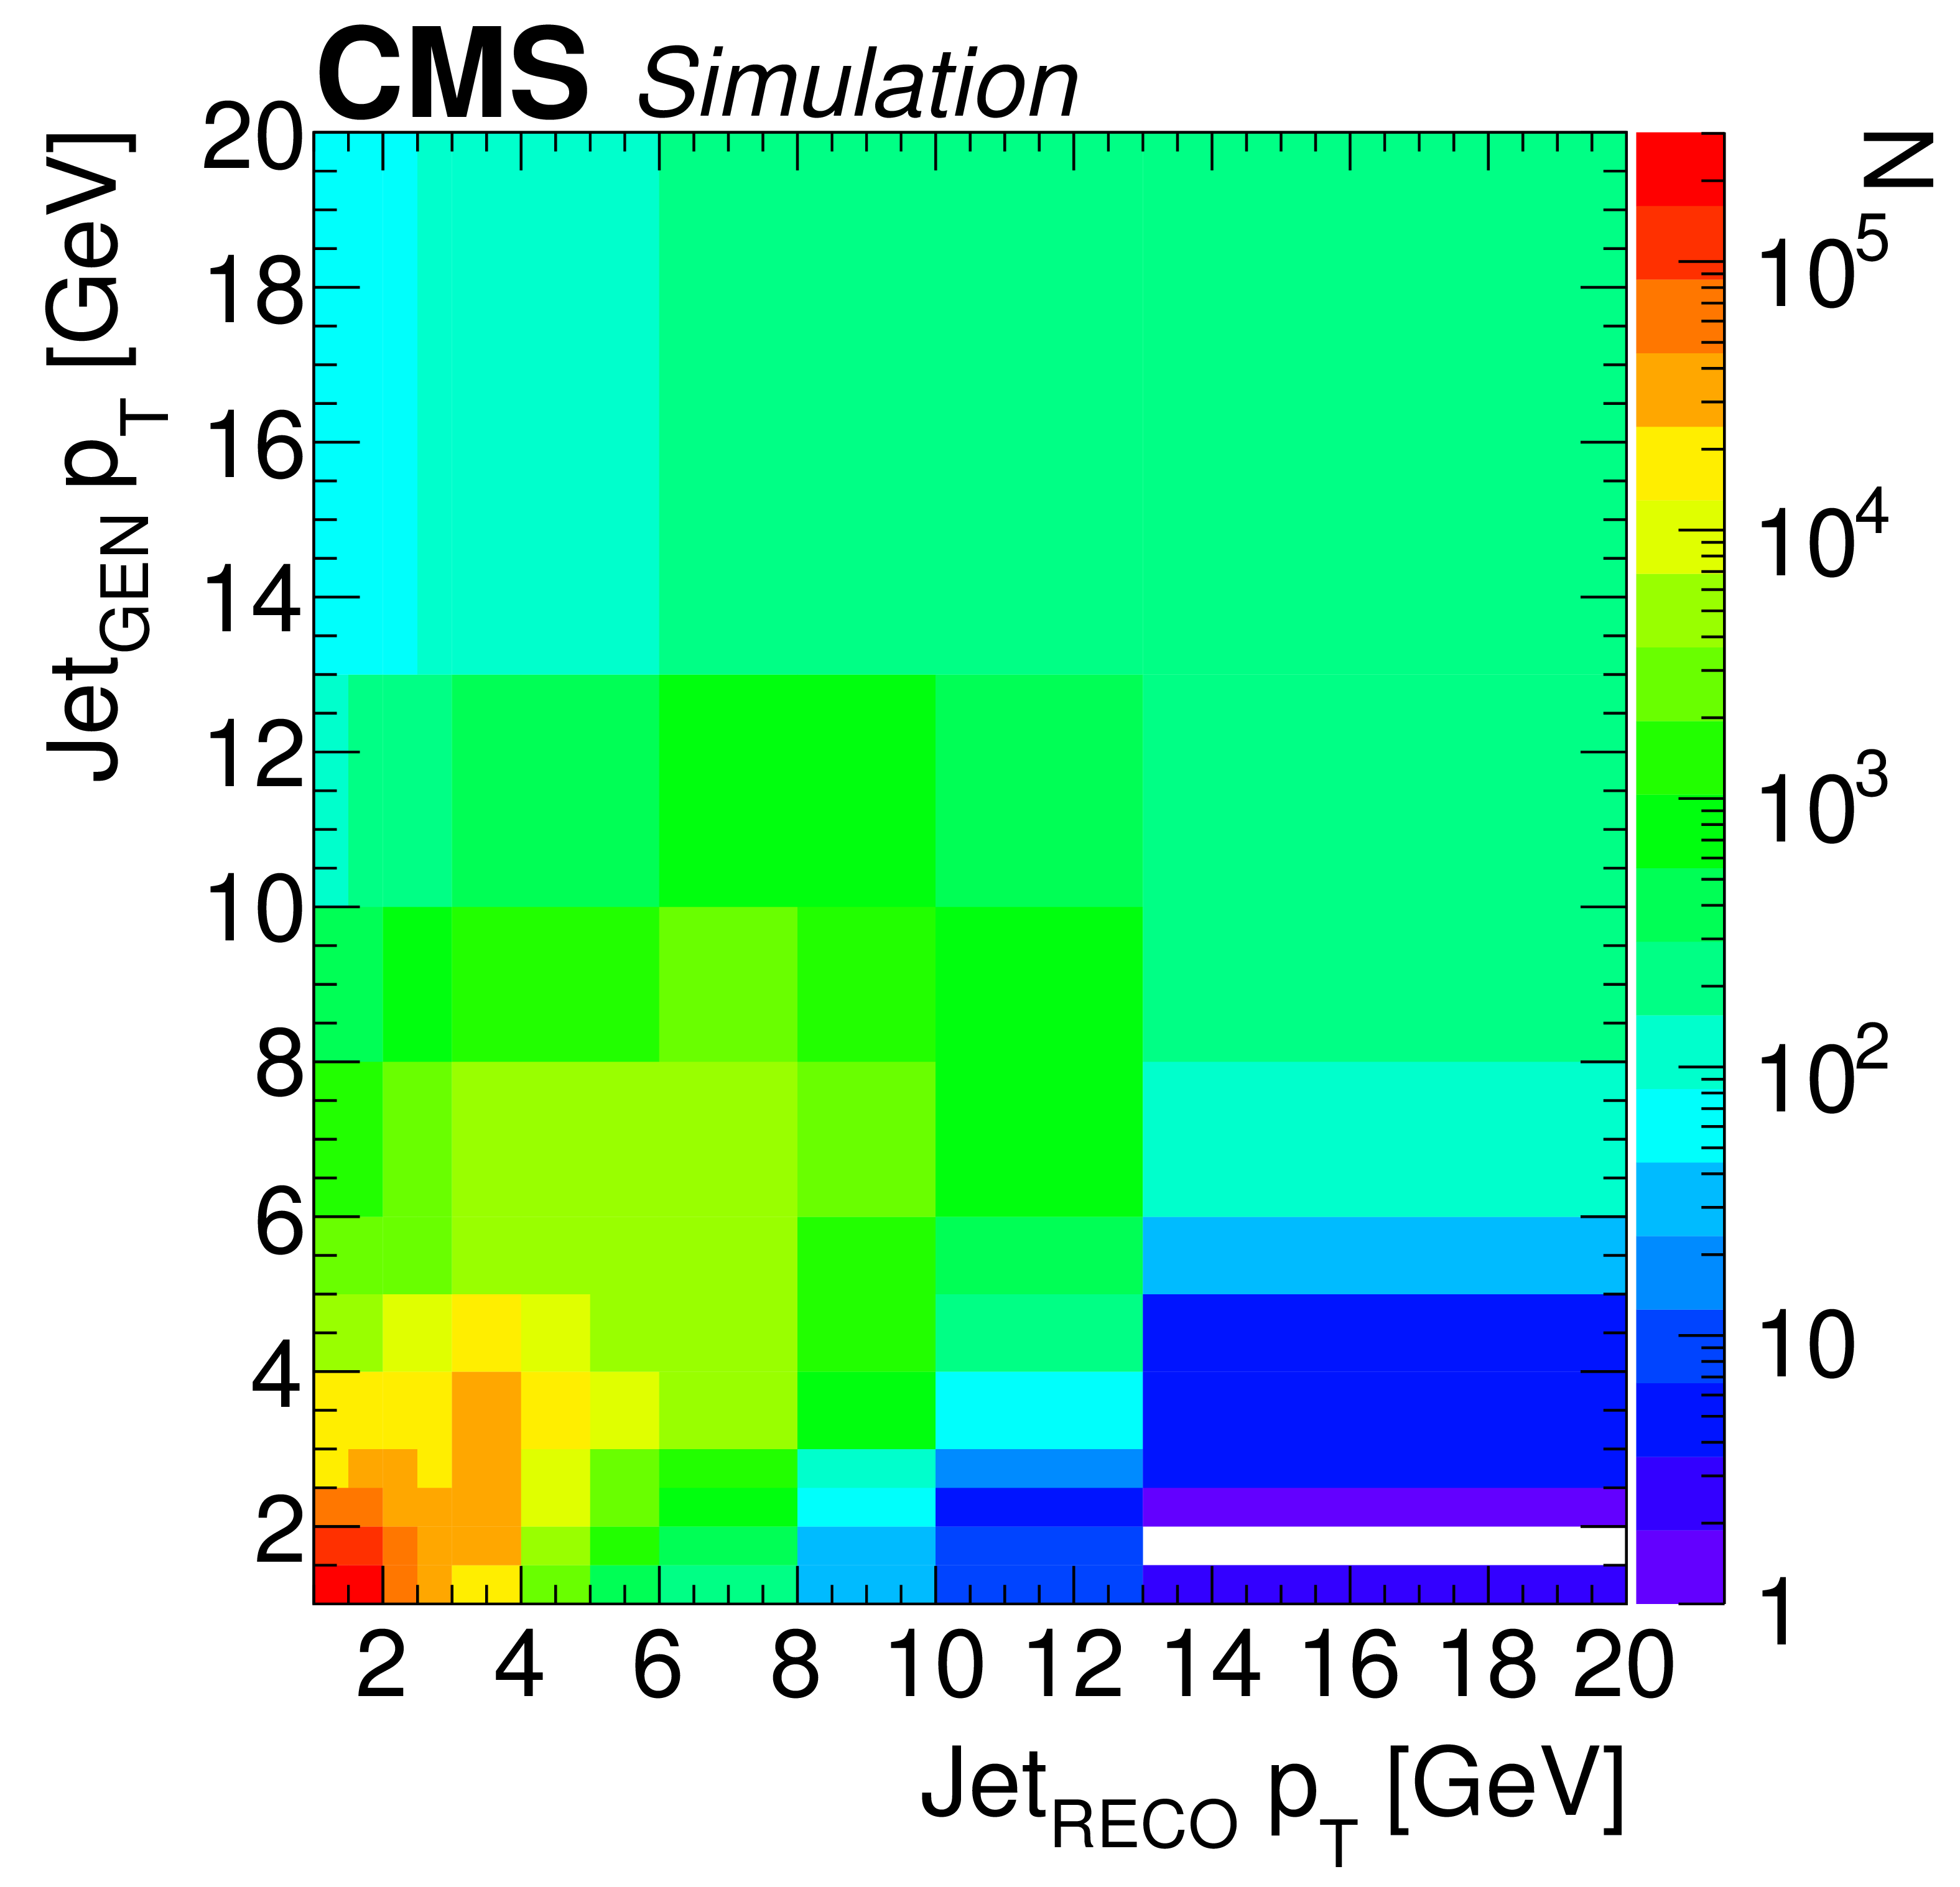
Figure 4-a:
Response matrix showing the distribution of reconstructed CASTOR jet-$ {p_{\mathrm {T}}}$ to their matched generator jet-$ {p_{\mathrm {T}}} $. a: Pythia8 CUETP8M1-Tune. b: Pythia8 4C-Tune with MBR. c: EPOS-LHC. |

png pdf |
Figure 4-b:
Response matrix showing the distribution of reconstructed CASTOR jet-$ {p_{\mathrm {T}}}$ to their matched generator jet-$ {p_{\mathrm {T}}} $. a: Pythia8 CUETP8M1-Tune. b: Pythia8 4C-Tune with MBR. c: EPOS-LHC. |

png pdf |
Figure 4-c:
Response matrix showing the distribution of reconstructed CASTOR jet-$ {p_{\mathrm {T}}}$ to their matched generator jet-$ {p_{\mathrm {T}}} $. a: Pythia8 CUETP8M1-Tune. b: Pythia8 4C-Tune with MBR. c: EPOS-LHC. |

png pdf |
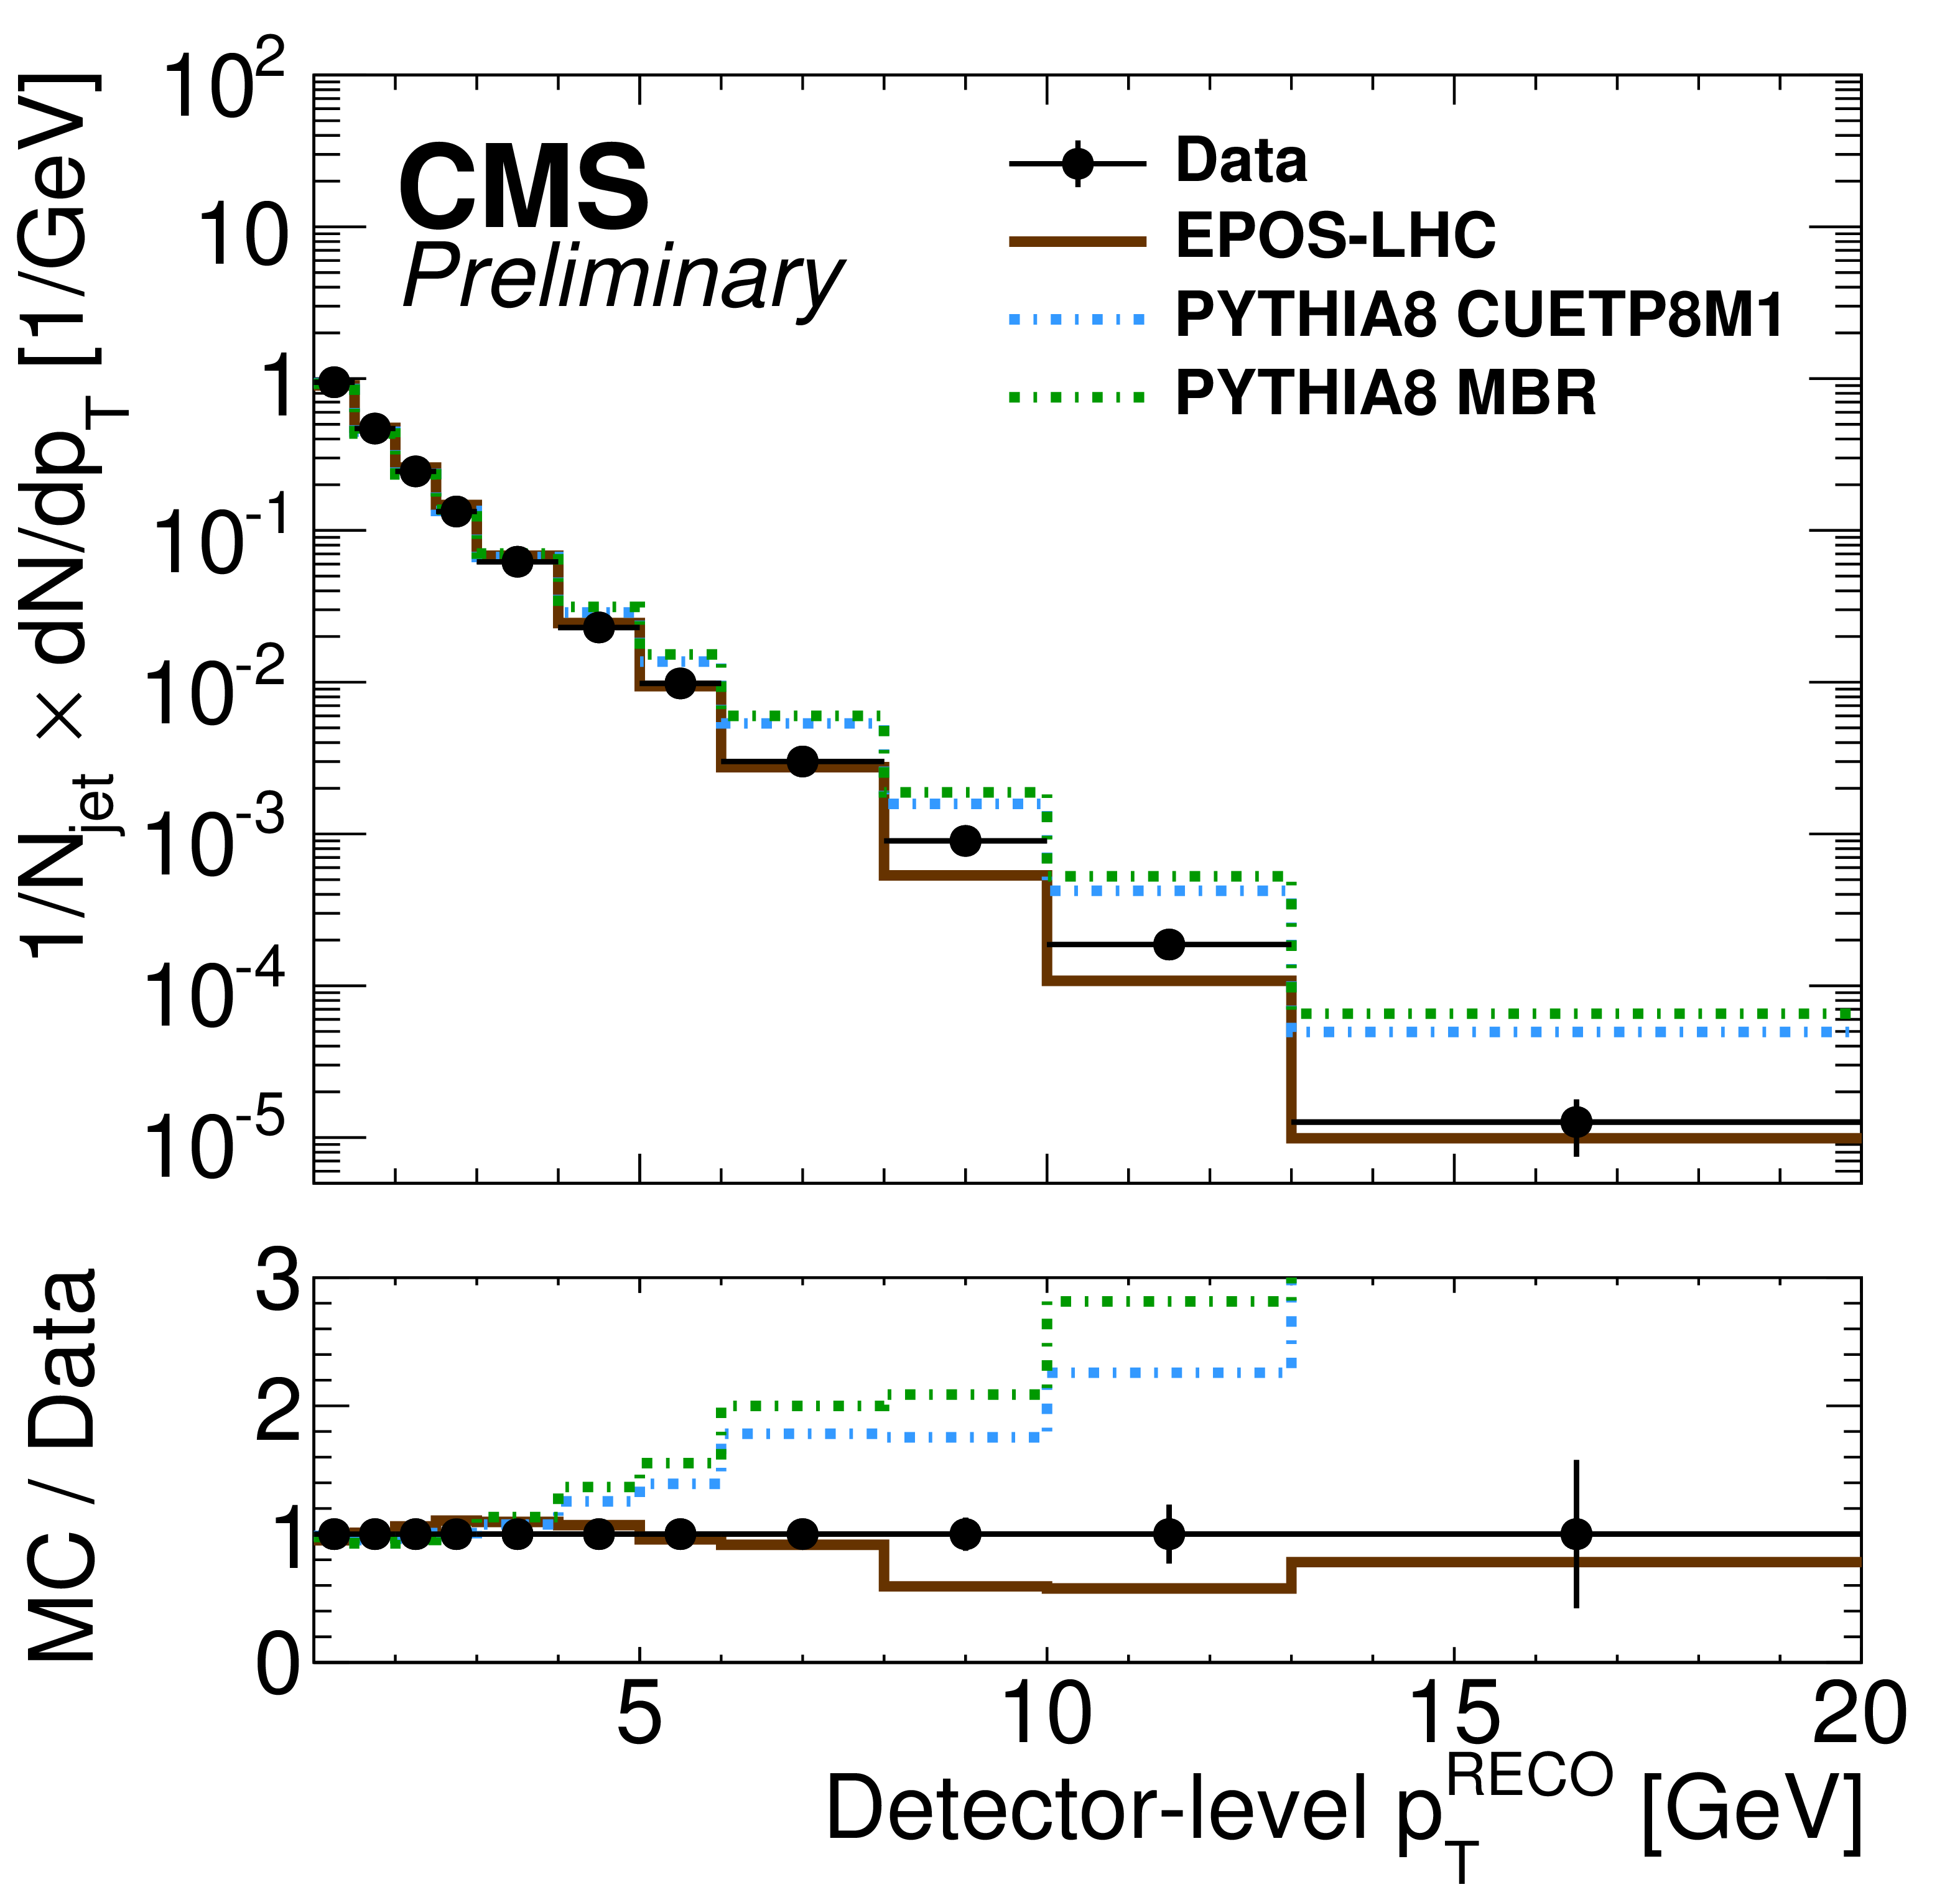
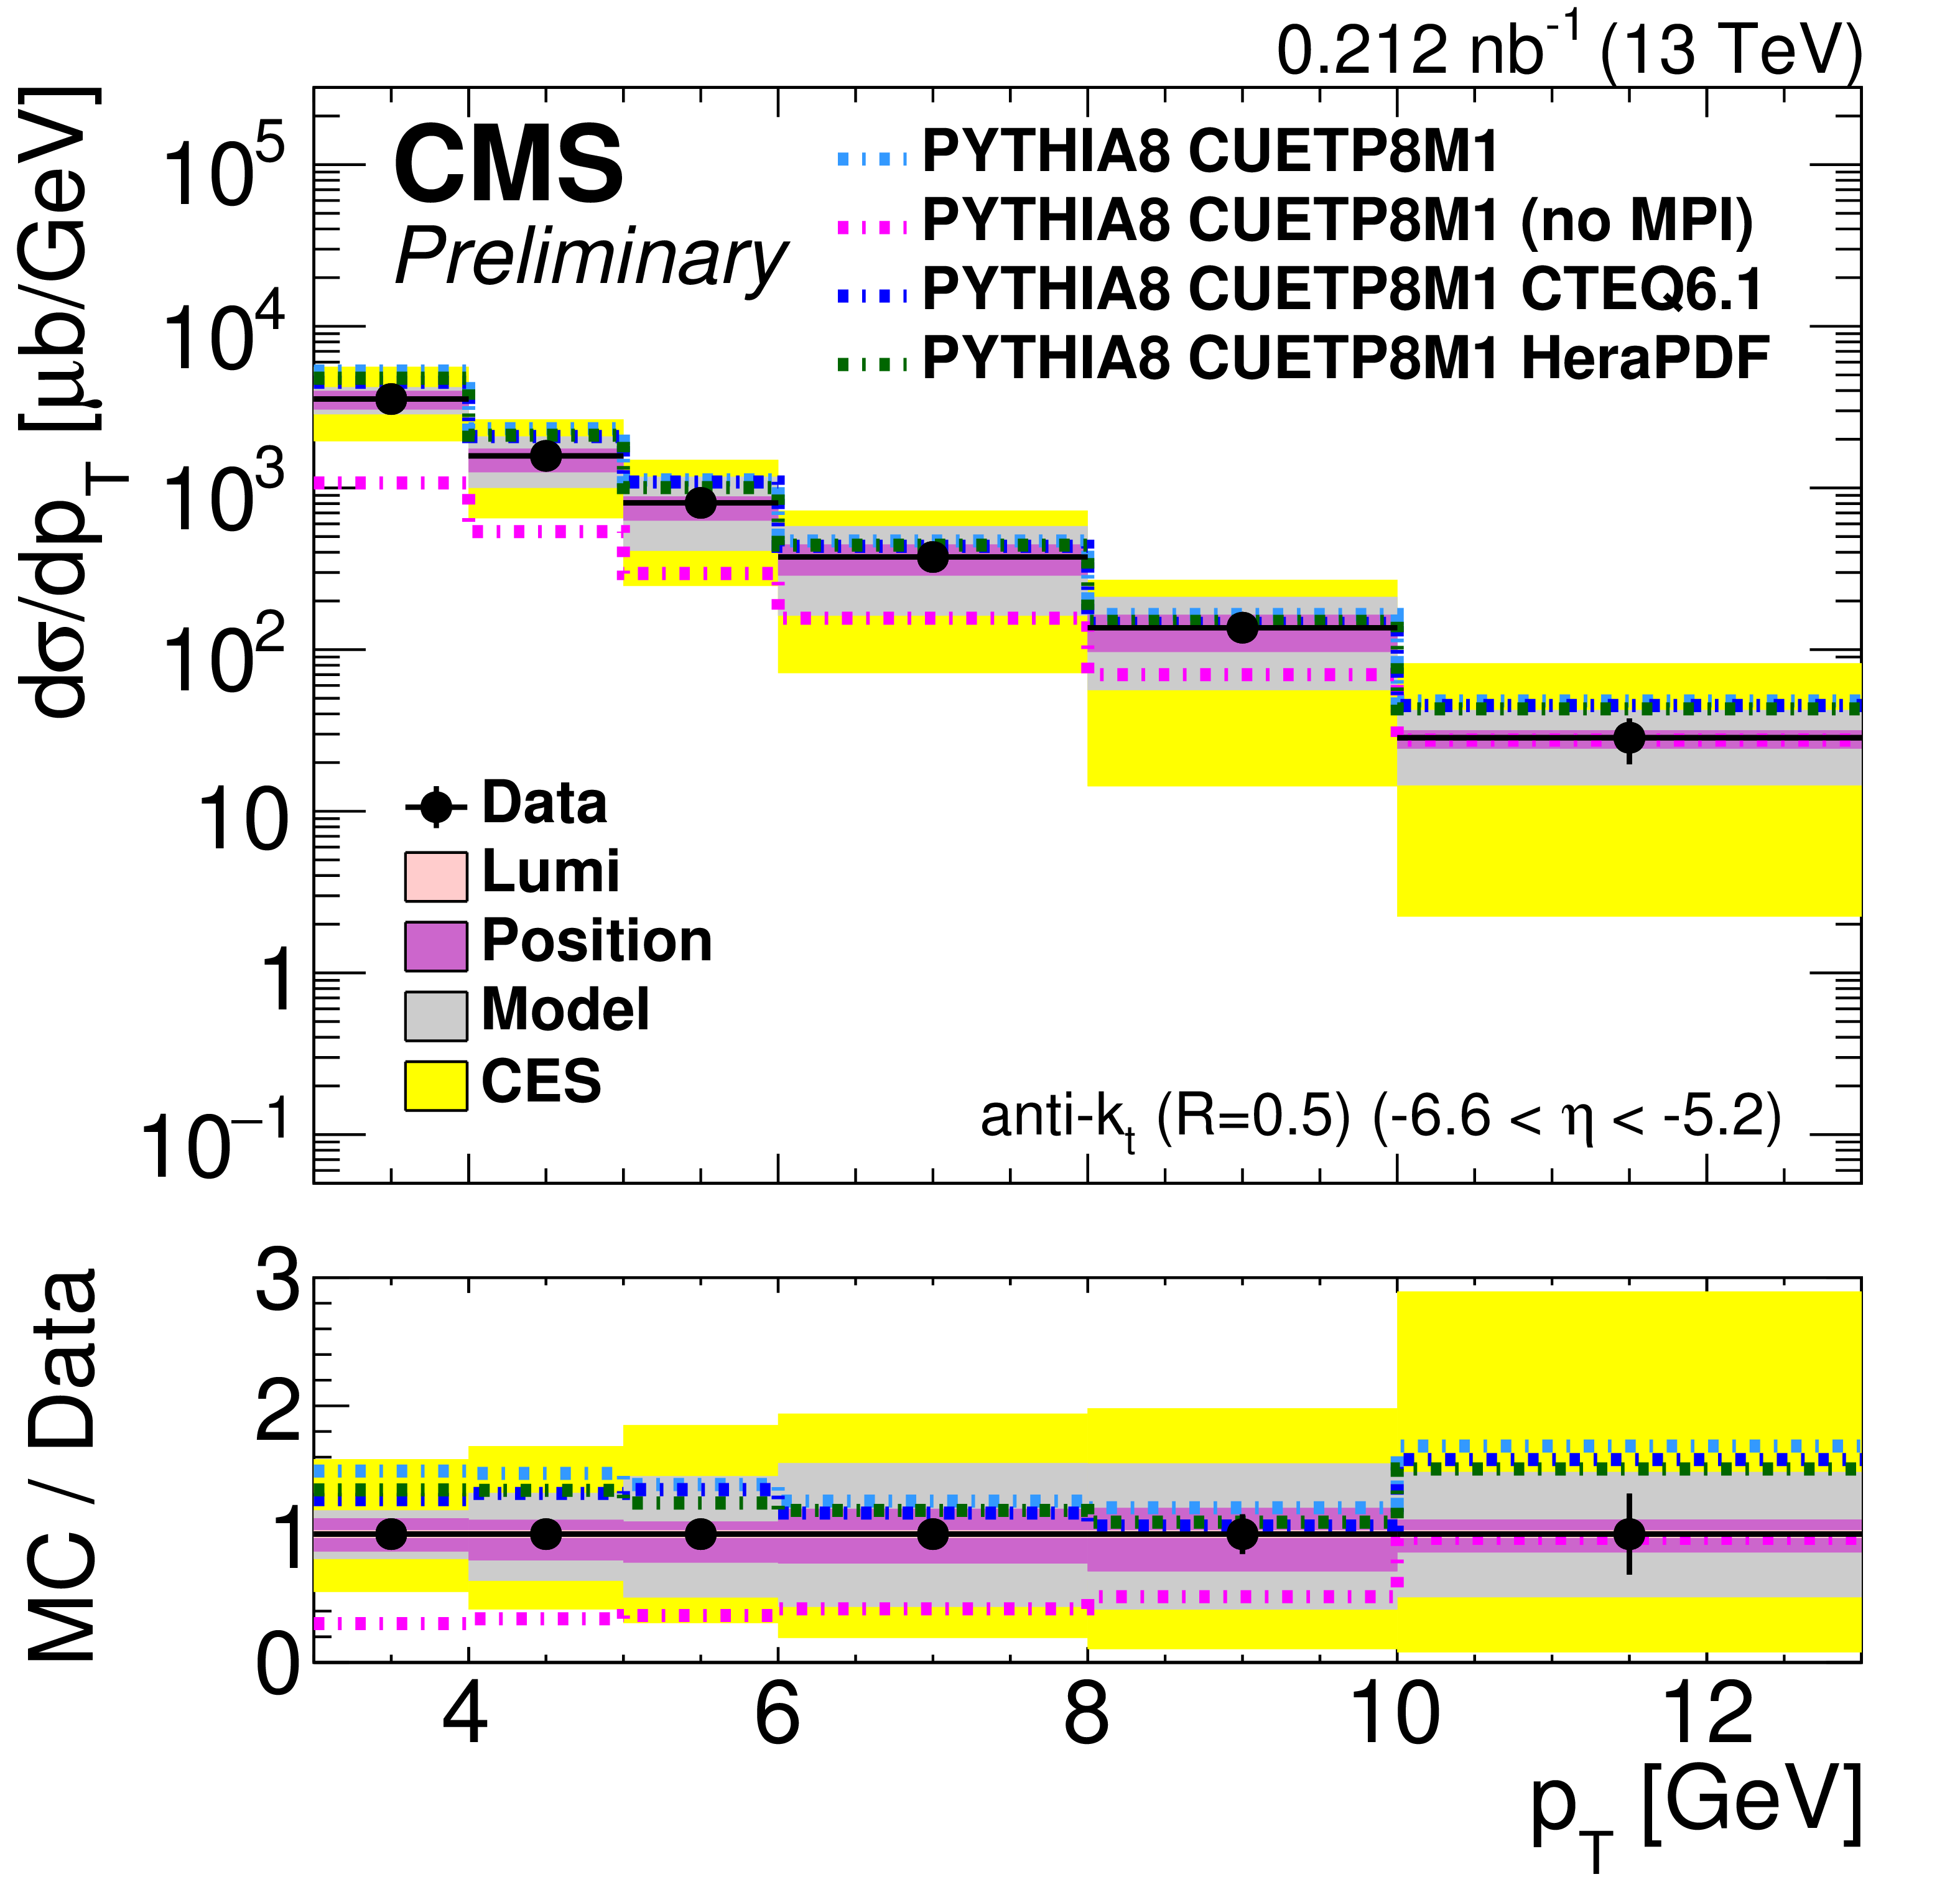
Figure 5-a:
Final unfolded differential jet-$ {p_{\mathrm {T}}}$ spectrum in CASTOR compared to different model predictions. a: the cross section. b: the jet yield normalized by number of visible jets. |

png pdf |
Figure 5-b:
Final unfolded differential jet-$ {p_{\mathrm {T}}}$ spectrum in CASTOR compared to different model predictions. a: the cross section. b: the jet yield normalized by number of visible jets. |
png pdf |
Figure 6-a:
Final unfolded differential jet-$ {p_{\mathrm {T}}}$ spectrum in CASTOR compared to different model predictions. a: the cross section. b: the jet yield normalized by number of visible jets. |

png pdf |
Figure 6-b:
Final unfolded differential jet-$ {p_{\mathrm {T}}}$ spectrum in CASTOR compared to different model predictions. a: the cross section. b: the jet yield normalized by number of visible jets. |

png pdf |
Figure 7:
The final covariance matrix of the statistical errors of the unfolded jet-$ {p_{\mathrm {T}}} $ spectrum with EPOS. The entries marked with a black box indicate negative values. |
| Tables | |
png pdf |
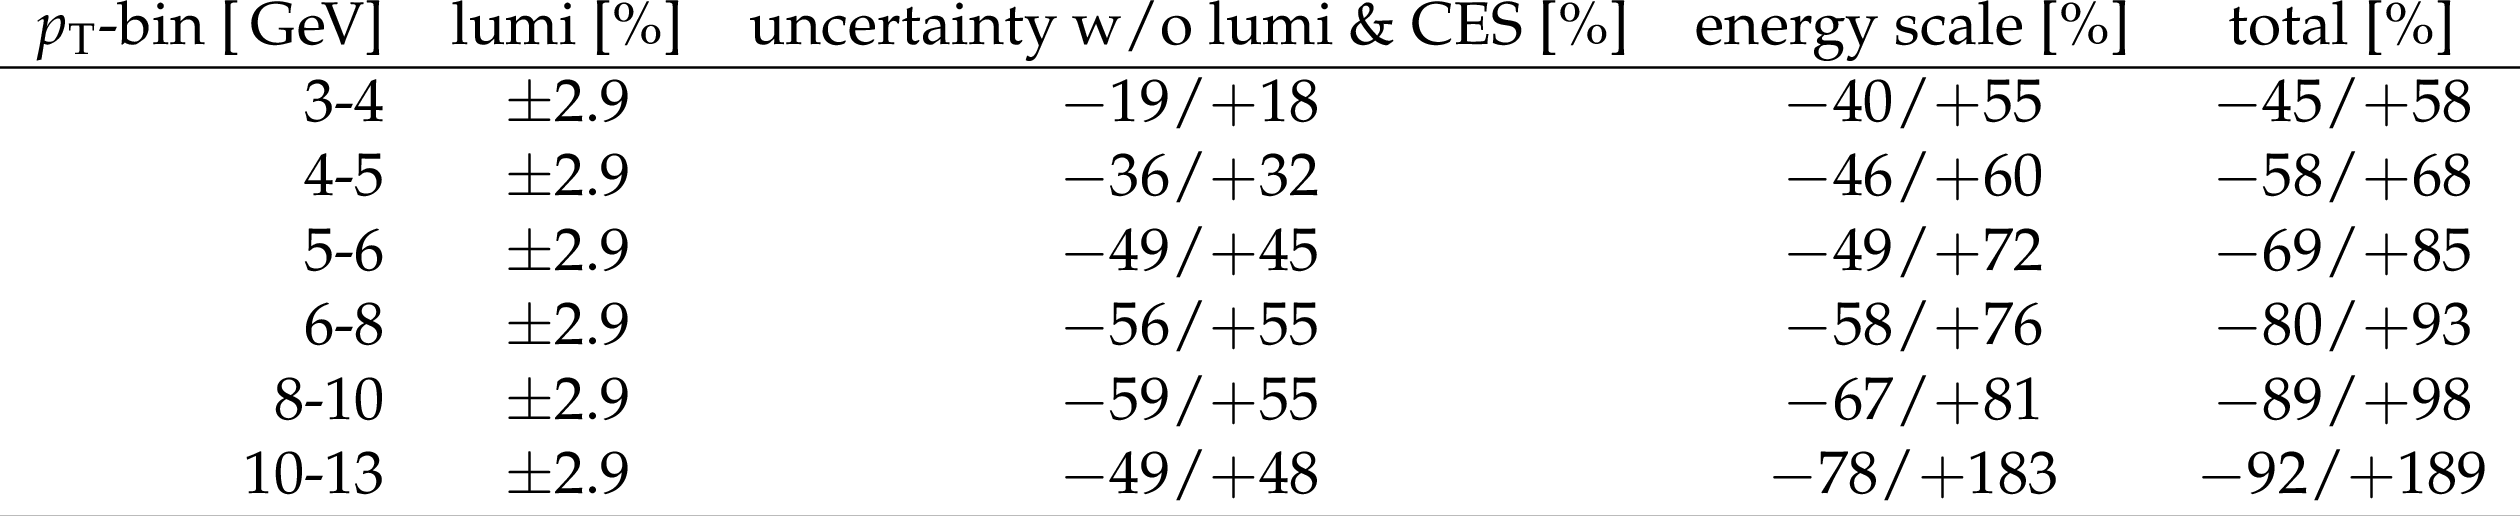
Table 1:
Summary of systematic uncertainties in different ${p_{\mathrm {T}}}$ bins when the result is normalized by luminosity. |

png pdf |
Table 2:
Summary of systematic uncertainties in different ${p_{\mathrm {T}}}$ bins when the result is normalized by number of events. |
| Summary |
| In Fig.5 and Fig.6 (b) the differential jet cross section in the pseudorapidity interval $-6.6<\eta<-5.2$ in proton-proton collisions at 13 TeV fully corrected for all detector effects is shown in the range 3 $ < p_{\mathrm{T}} < $ 13 GeV. The covariance matrix of this data is illustrated in Fig.7. In the right panel of Fig.5 and Fig.6 the jet yield normalized by the number of jets in the visible $p_{\mathrm{T}}$-range is shown. Due to the significant experimental uncertainties all of the models are essentially consistent with the data. However, it is interesting to note that all the PYTHIA tunes tend to slightly overpredict the cross section, while the two Gribov-Regge models EPOS-LHC and QGSJetII.4 tend to underpredict the cross section. The data favours a cross section in between these two extremes. The shape of EPOS-LHC and QGSJetII.4 is a bit softer than the data indicate, while all PYTHIA versions tend to reproduce the shape very well. The presented differential spectra have only a moderate sensitivity to the underlying PDF set of the model, however, they are very sensitive to MPI. |
|
|
Compact Muon Solenoid LHC, CERN |
|

|

|

|

|

|