

Compact Muon Solenoid
LHC, CERN
| CMS-PAS-FSQ-16-009 | ||
| Measurement of double parton scattering in same-sign WW production in p-p collisions at $\sqrt{s}= $ 13 TeV with the CMS experiment | ||
| CMS Collaboration | ||
| March 2017 | ||
| Abstract: Same-sign $\mathrm{ W^{\pm} W^{\pm} }$ production in which the bosons originate from two distinct parton-parton interactions within the same proton-proton collision is studied in the $\mu^{\pm}\mu^{\pm}$ and $\mathrm{e}^{\pm}\mu^{\pm}$ final states. A data set of 35.9 fb$^{-1}$ of proton-proton collisions at $\sqrt{s}= $ 13 TeV, recorded with the CMS detector at the LHC in 2016, is used. A multivariate classifier is trained to distinguish the signal process from the main background components. A measurement of the double-parton scattering process WW is performed on these data. A cross section of 1.09$^{+0.50}_{-0.49}$ pb is extracted for the inclusive WW double parton scattering process, which is compatible with the Monte-Carlo prediction of 1.64 pb. | ||
| Links: CDS record (PDF) ; inSPIRE record ; CADI line (restricted) ; | ||
| Figures | |
png pdf |
Figure 1:
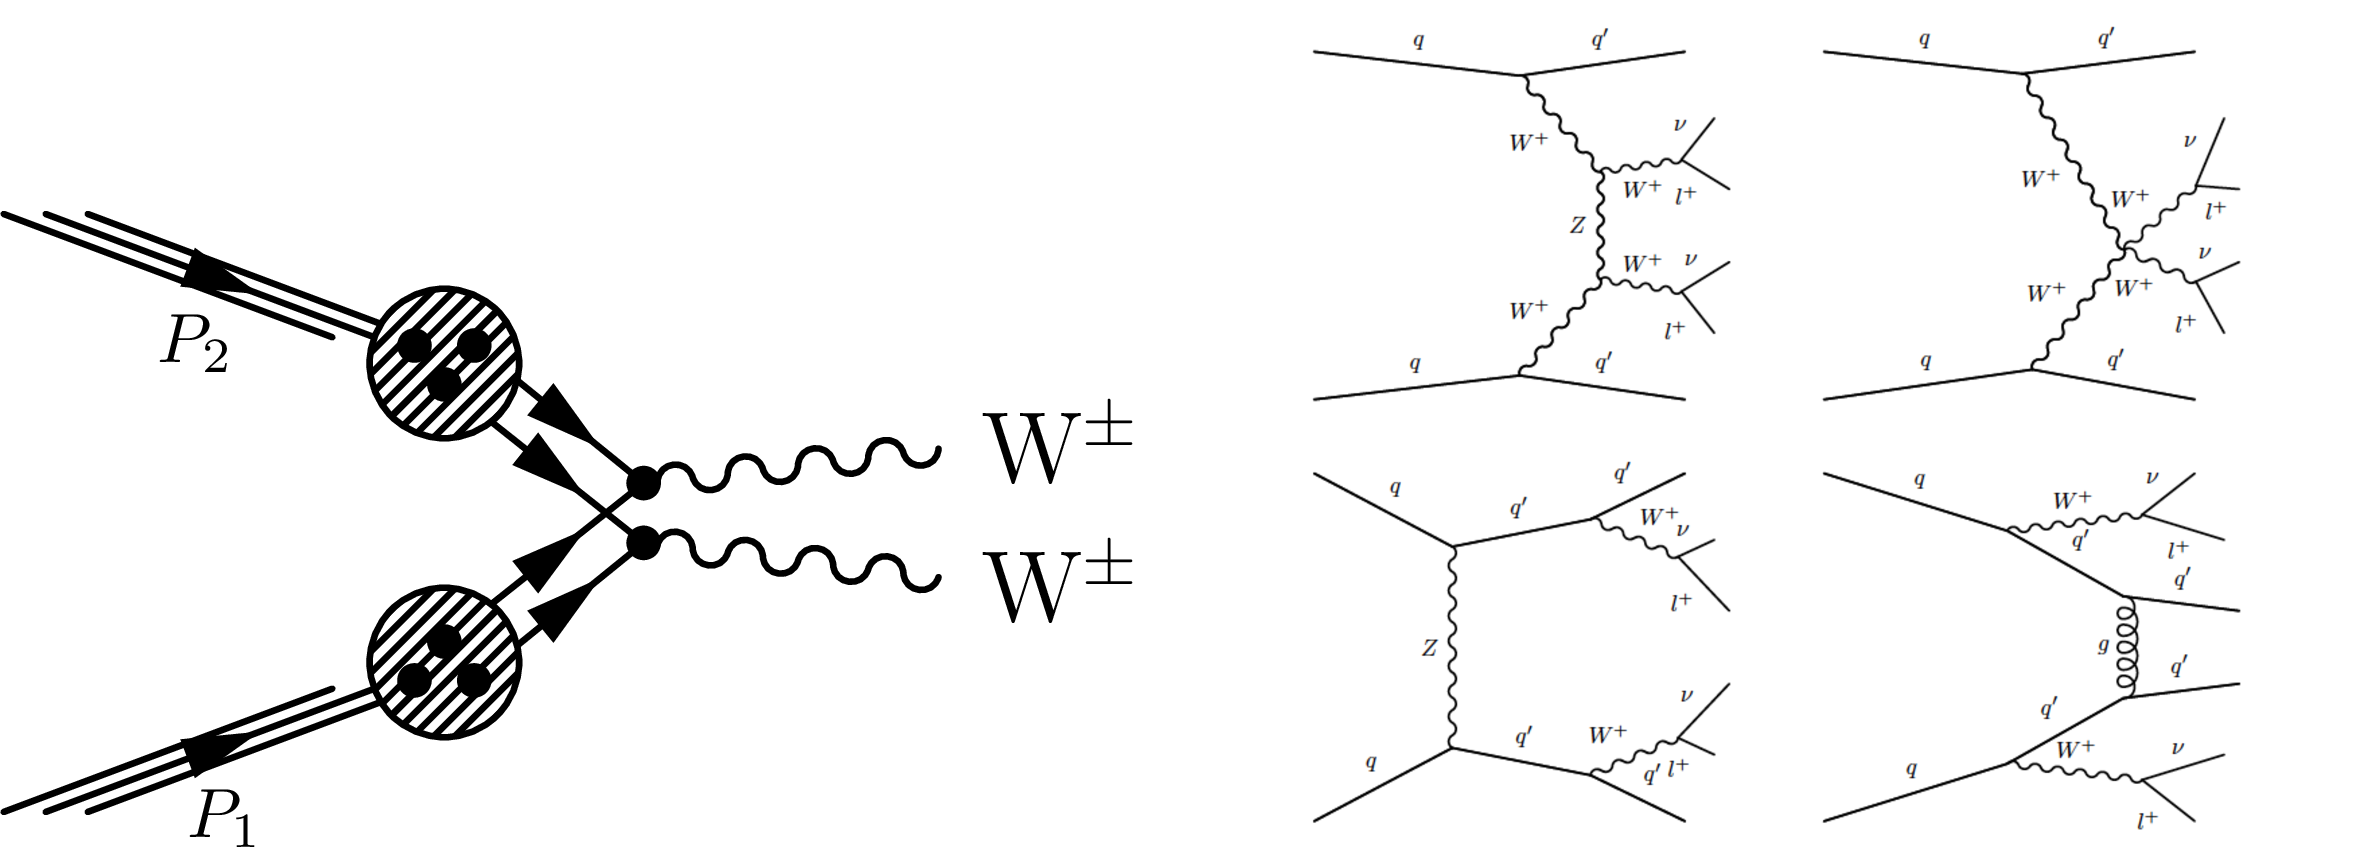
Schematic diagram of the $\mathrm{ W^{\pm }W^{\pm } }$ DPS process (left) and the leading Feynman diagrams of the corresponding SPS process $\mathrm{ W^{\pm }W^{\pm }jj }$ (right). |
png pdf |
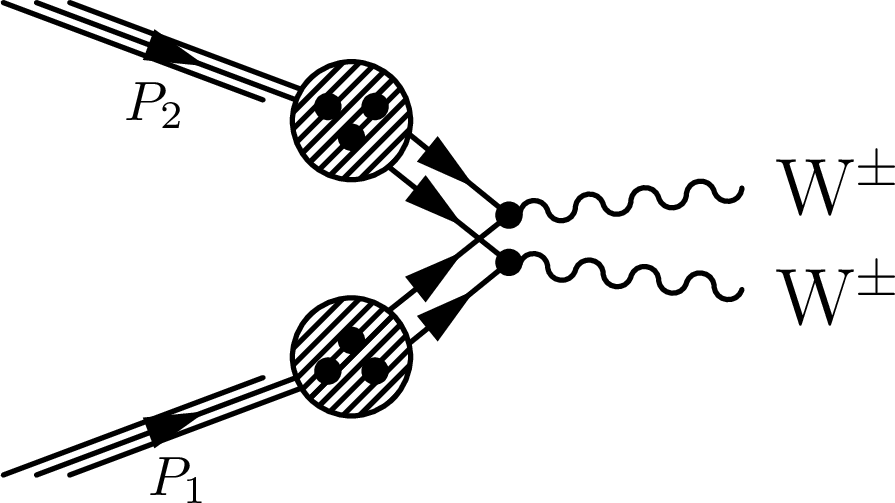
Figure 1-a:
Schematic diagram of the $\mathrm{ W^{\pm }W^{\pm } }$ DPS process. |

png pdf |
Figure 1-b:
Leading Feynman diagrams of the corresponding SPS process $\mathrm{ W^{\pm }W^{\pm }jj }$. |
png pdf |
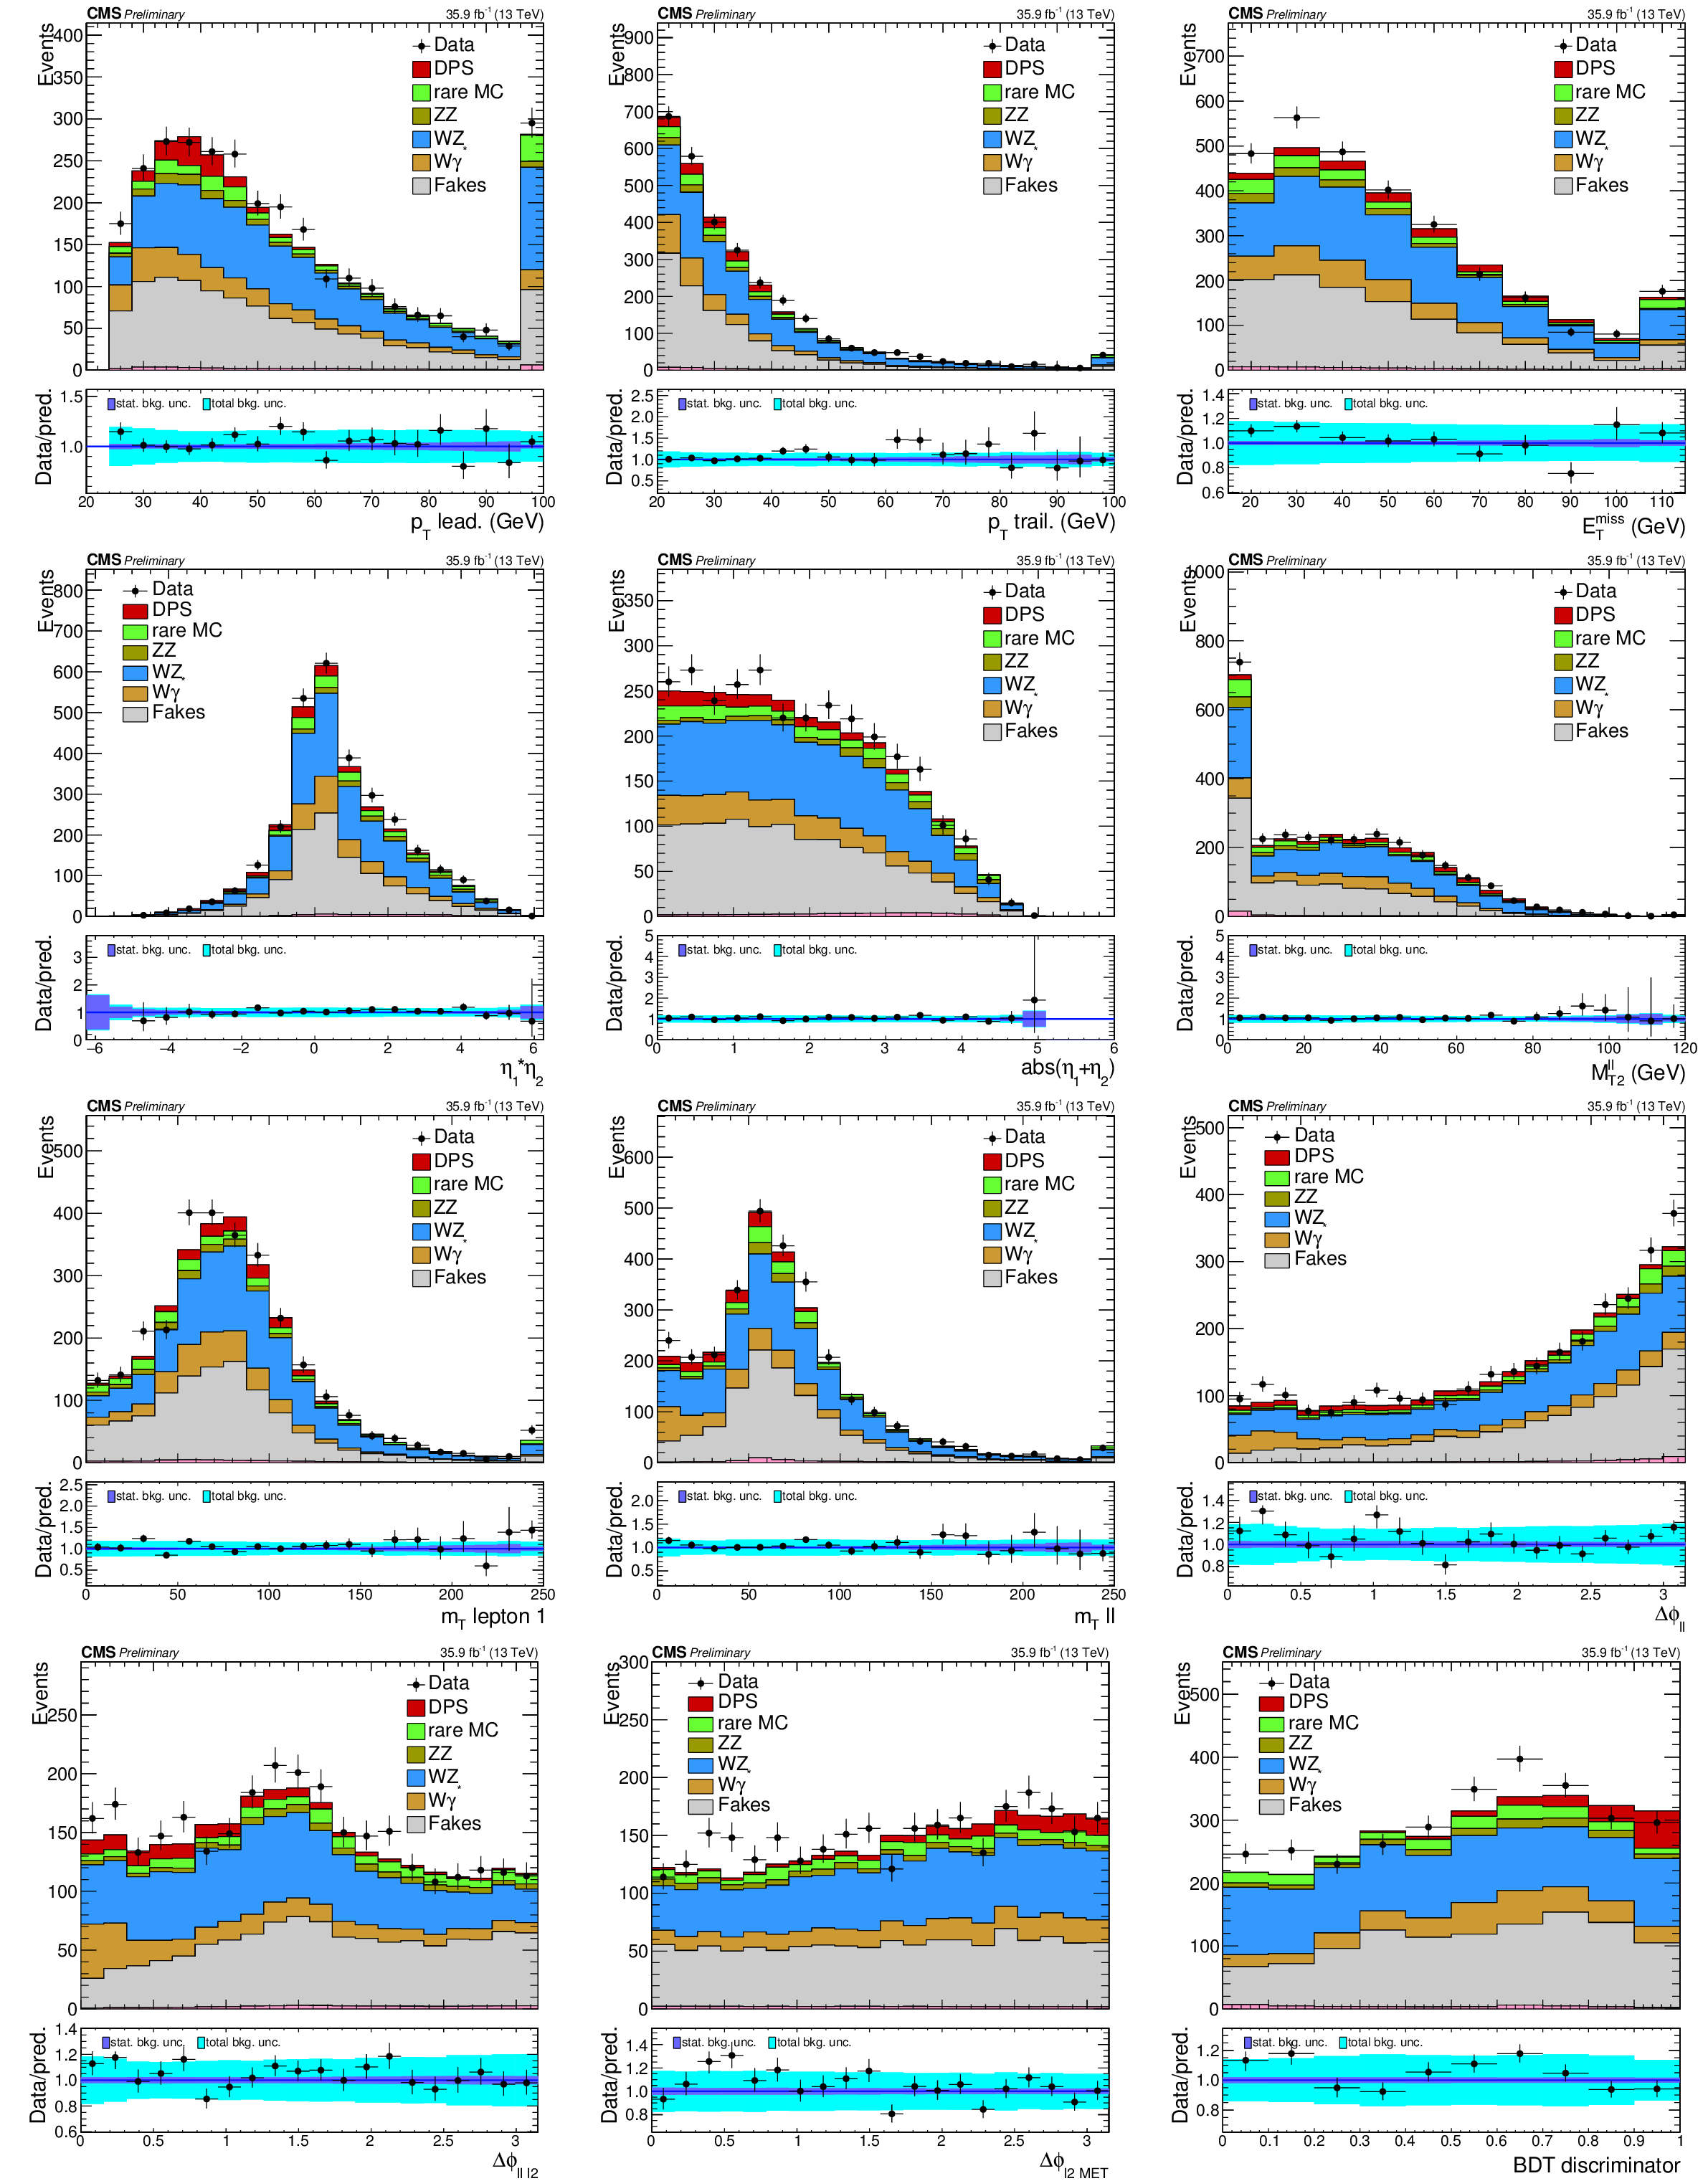
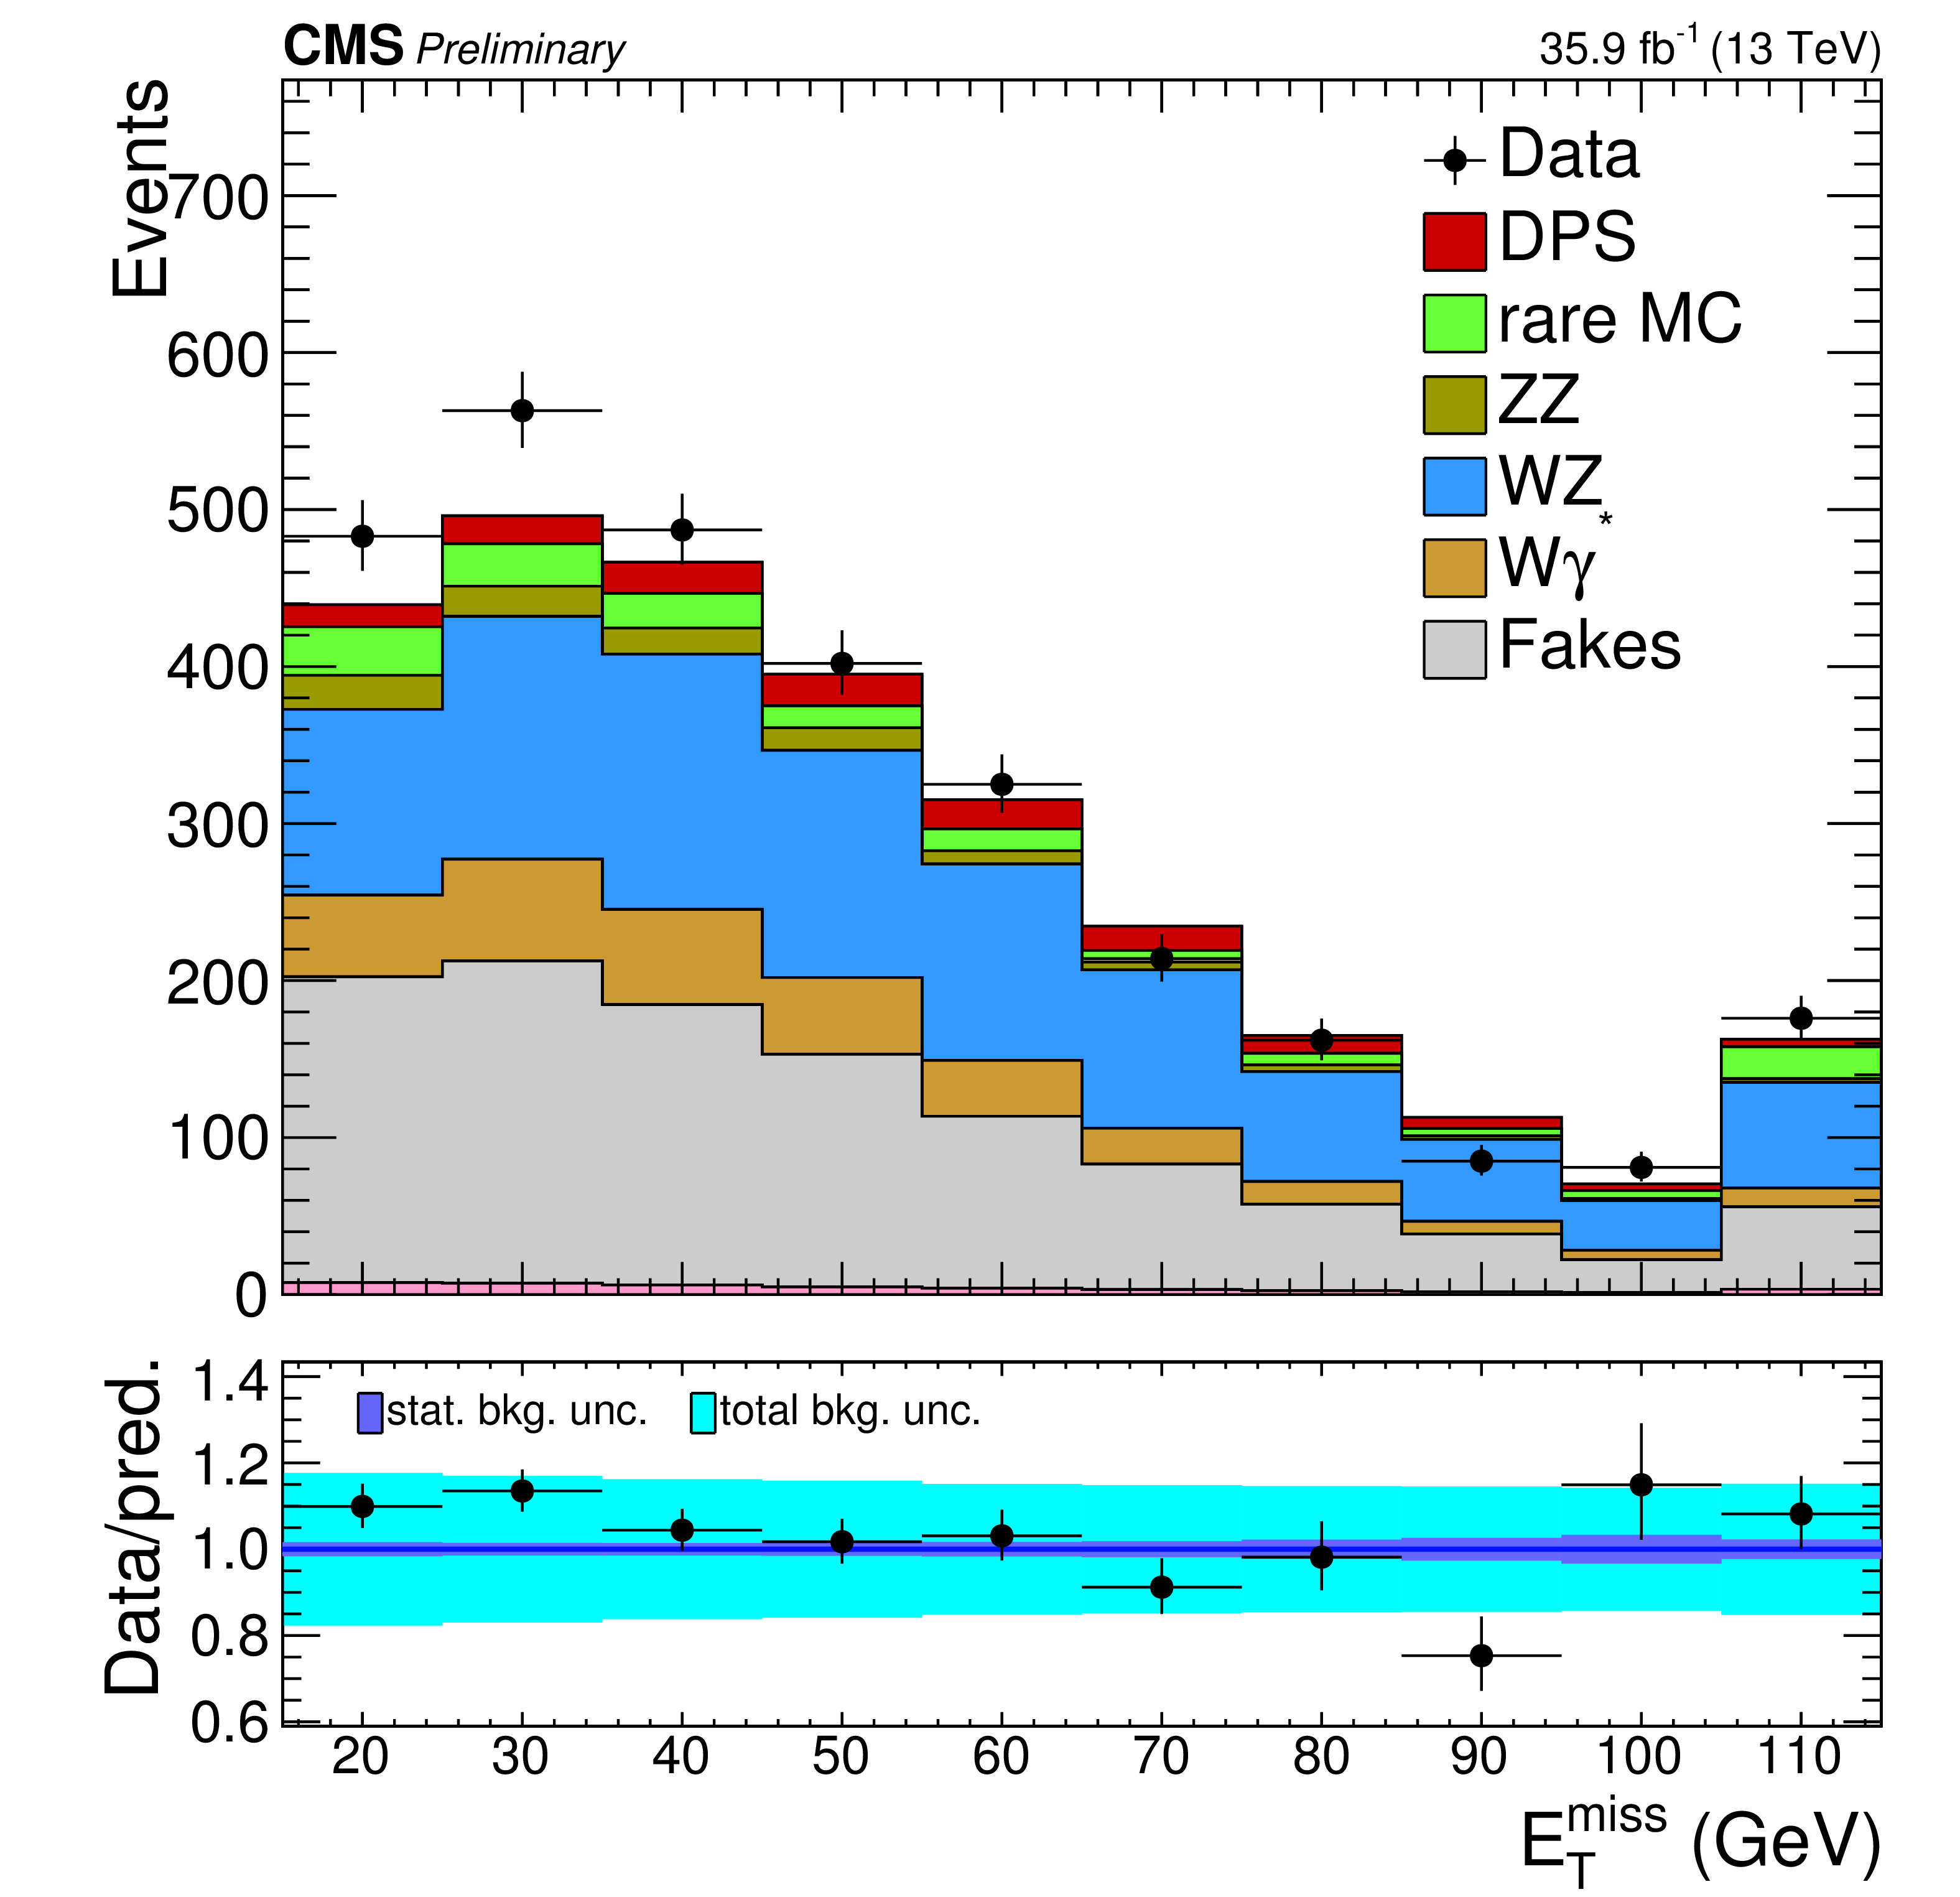
Figure 2:
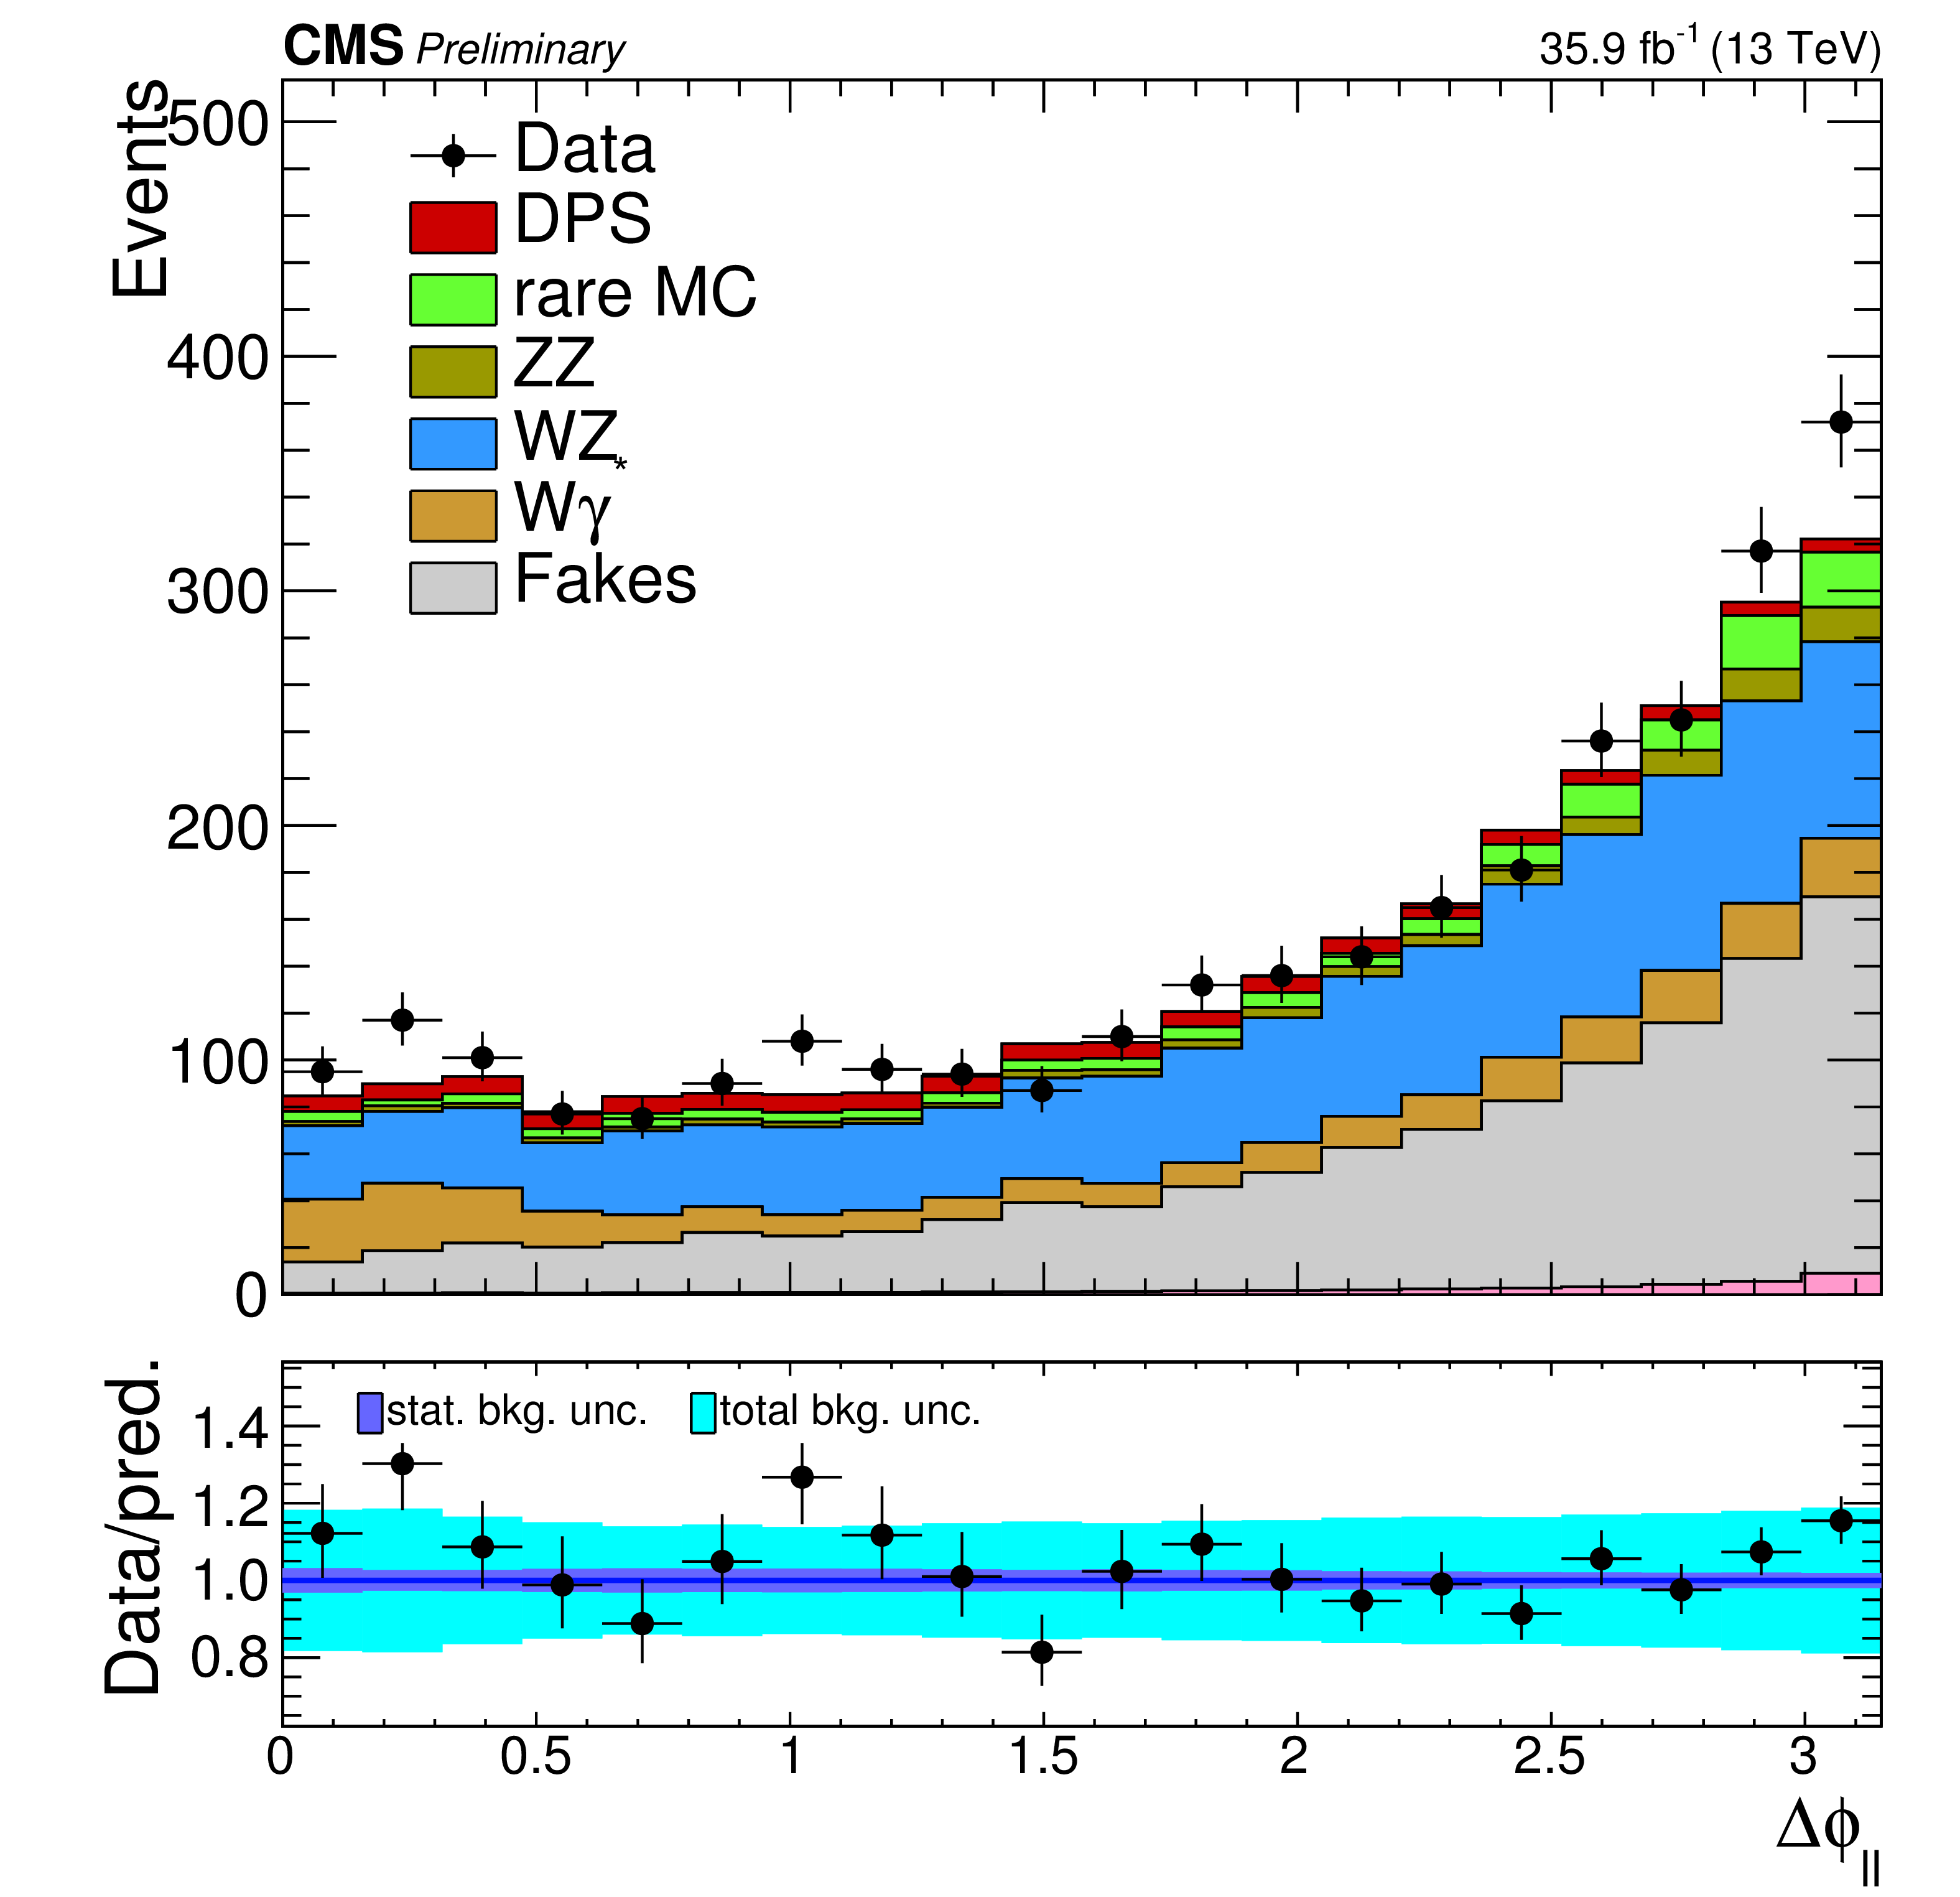
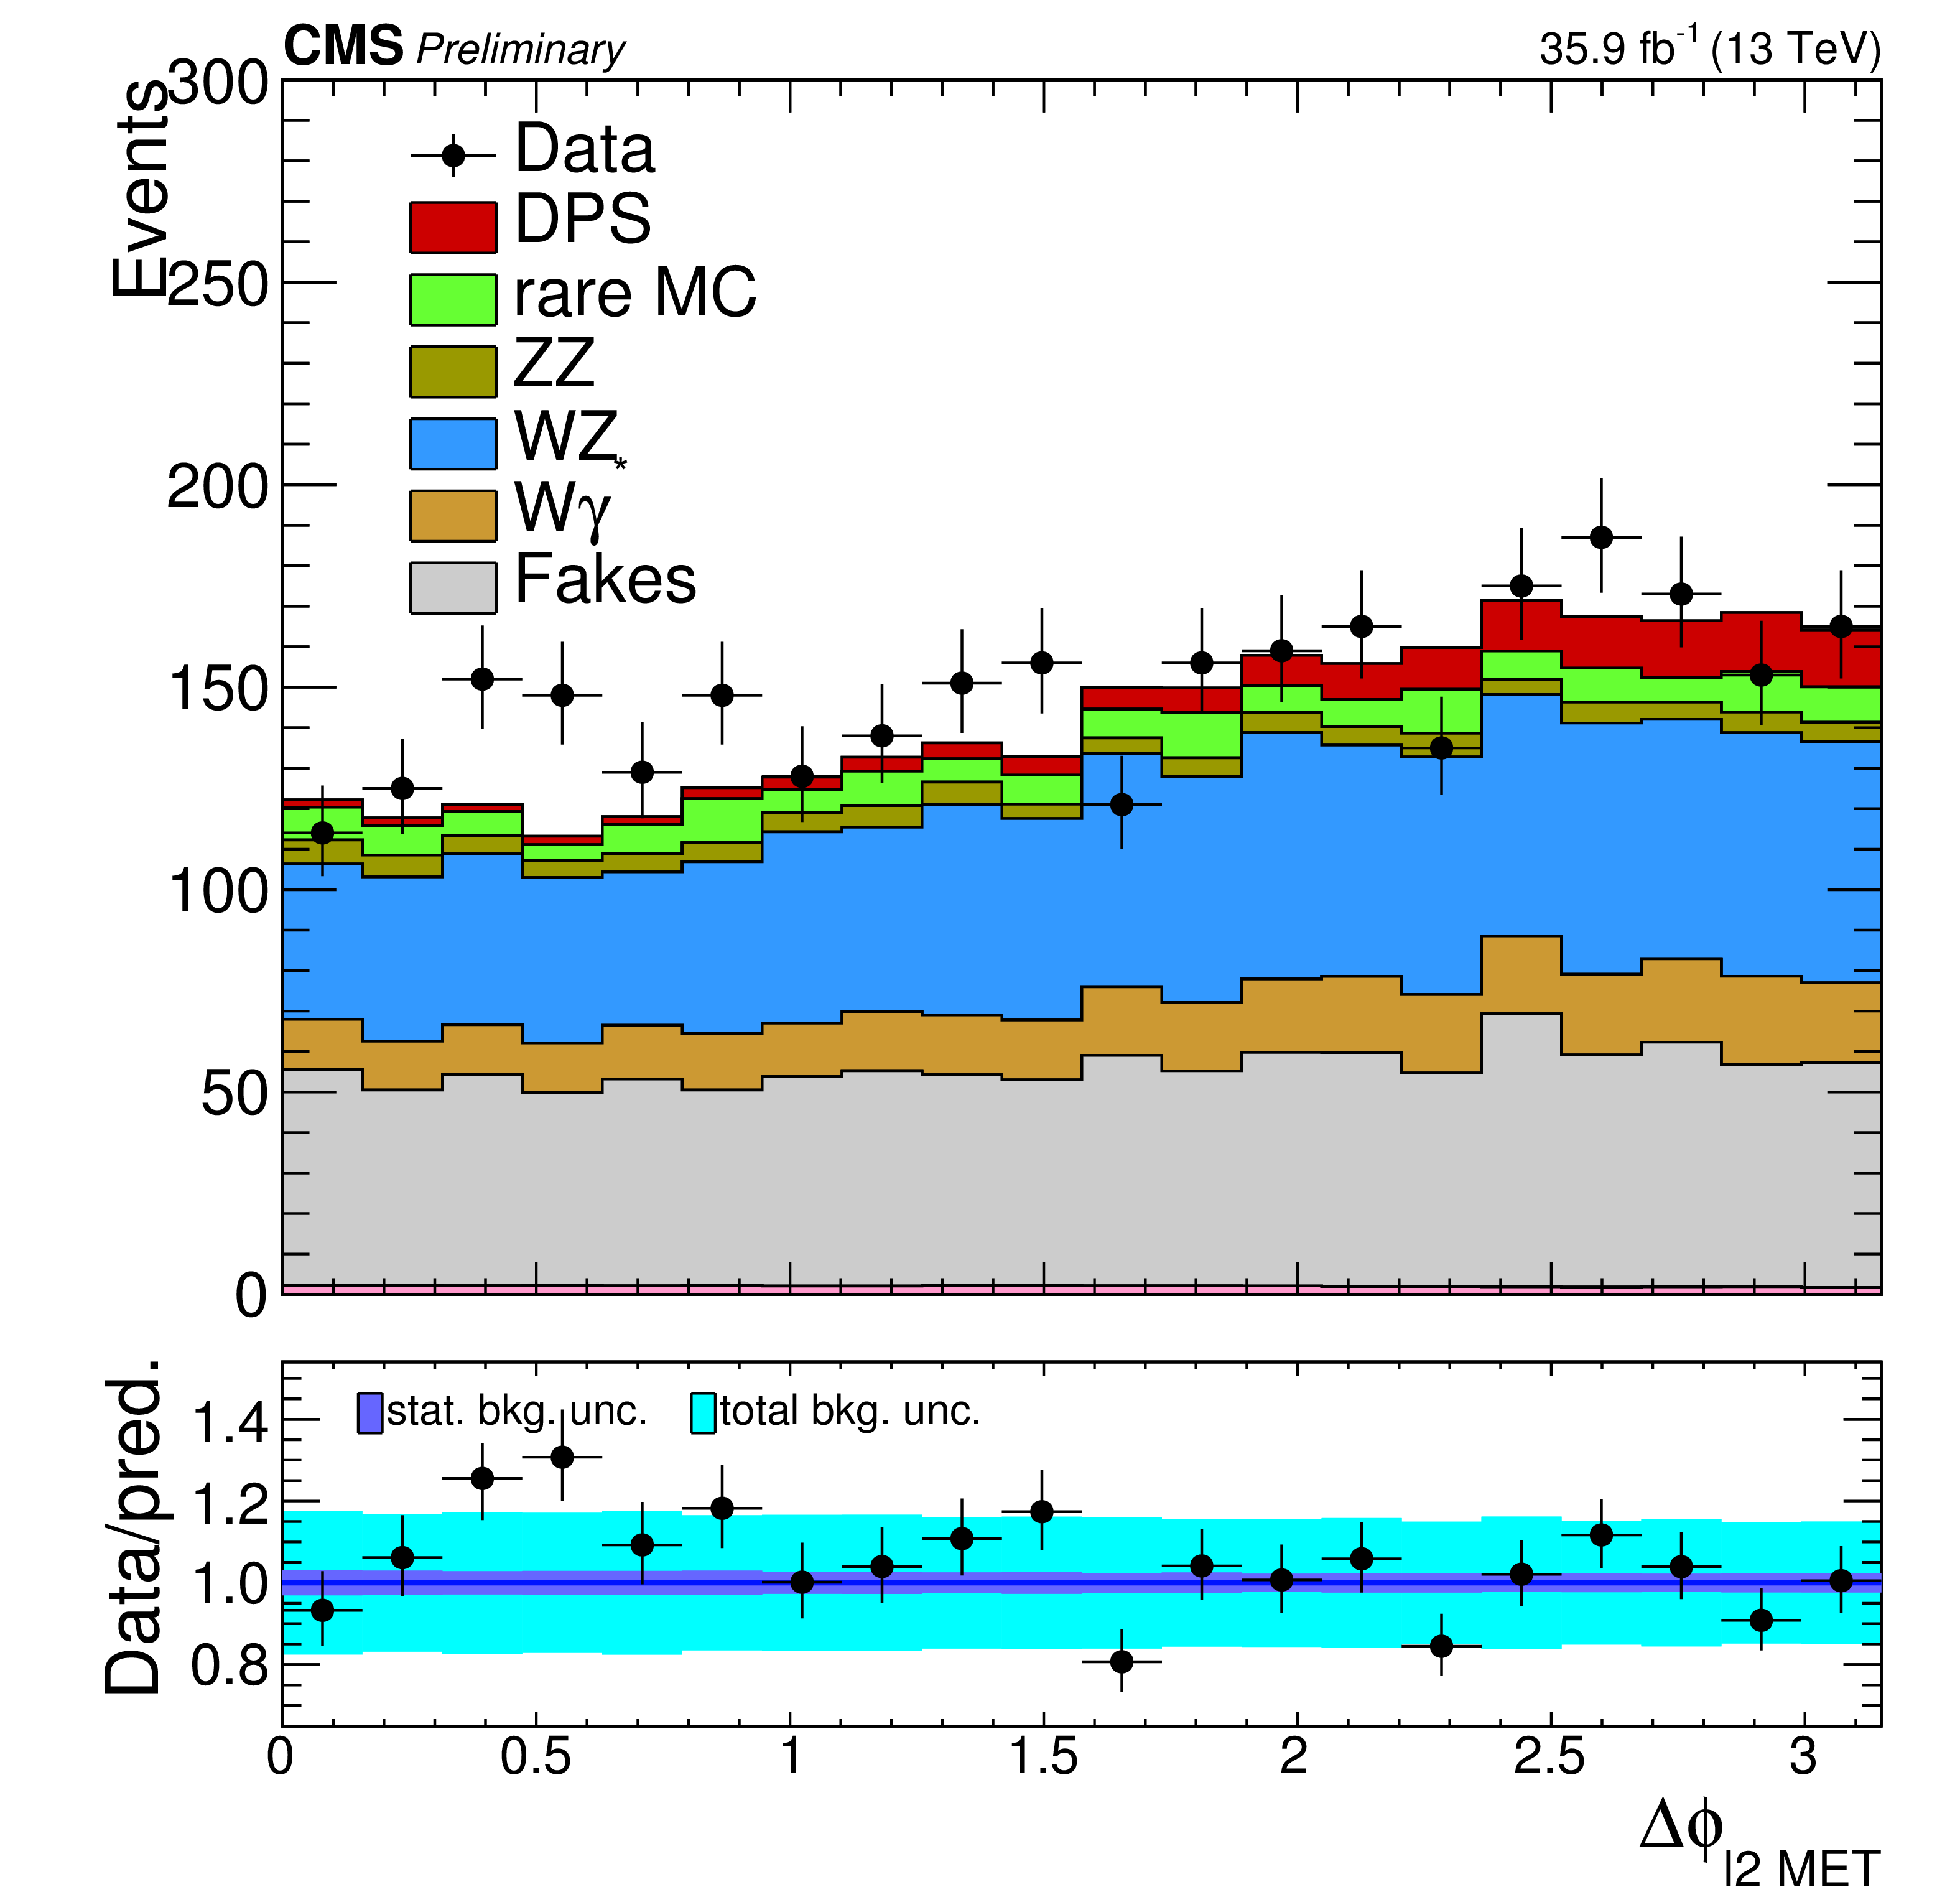
Input variables to the BDT training. All backgrounds and the signal are shown in colored histograms with the data shown in black markers. The statistical (dark blue), and systematic (light blue) uncertainty bands are shown in the ratio below the distributions. The variables are from left to right and top to bottom: $p_{\mathrm{T,1}}$, $p_{\mathrm{T,2}}$, ${E_{\mathrm {T}}^{\text {miss}}} $, $\eta _1 \times \eta _2$, $|\eta _1 + \eta _2|$, $M_{\mathrm{T2}}^{\ell \ell }$ , $M_{\mathrm{T},(\ell _1, {E_{\mathrm {T}}^{\text {miss}}} )}$, $M_{\mathrm{T},(\ell _1,\ell _2)}$, $|\Delta \phi _{(\ell _1,\ell _2)}|$, $|\Delta \phi _{(\ell \ell ,\ell _2)}|$, $|\Delta \phi _{(\ell _2, {E_{\mathrm {T}}^{\text {miss}}} )}|$, and the BDT discriminator output distribution. |

png pdf |
Figure 2-a:
The $p_{\mathrm{T,1}}$ distribution. All backgrounds and the signal are shown in colored histograms with the data shown in black markers. The statistical (dark blue), and systematic (light blue) uncertainty bands are shown in the ratio below the distributions. |
png pdf |
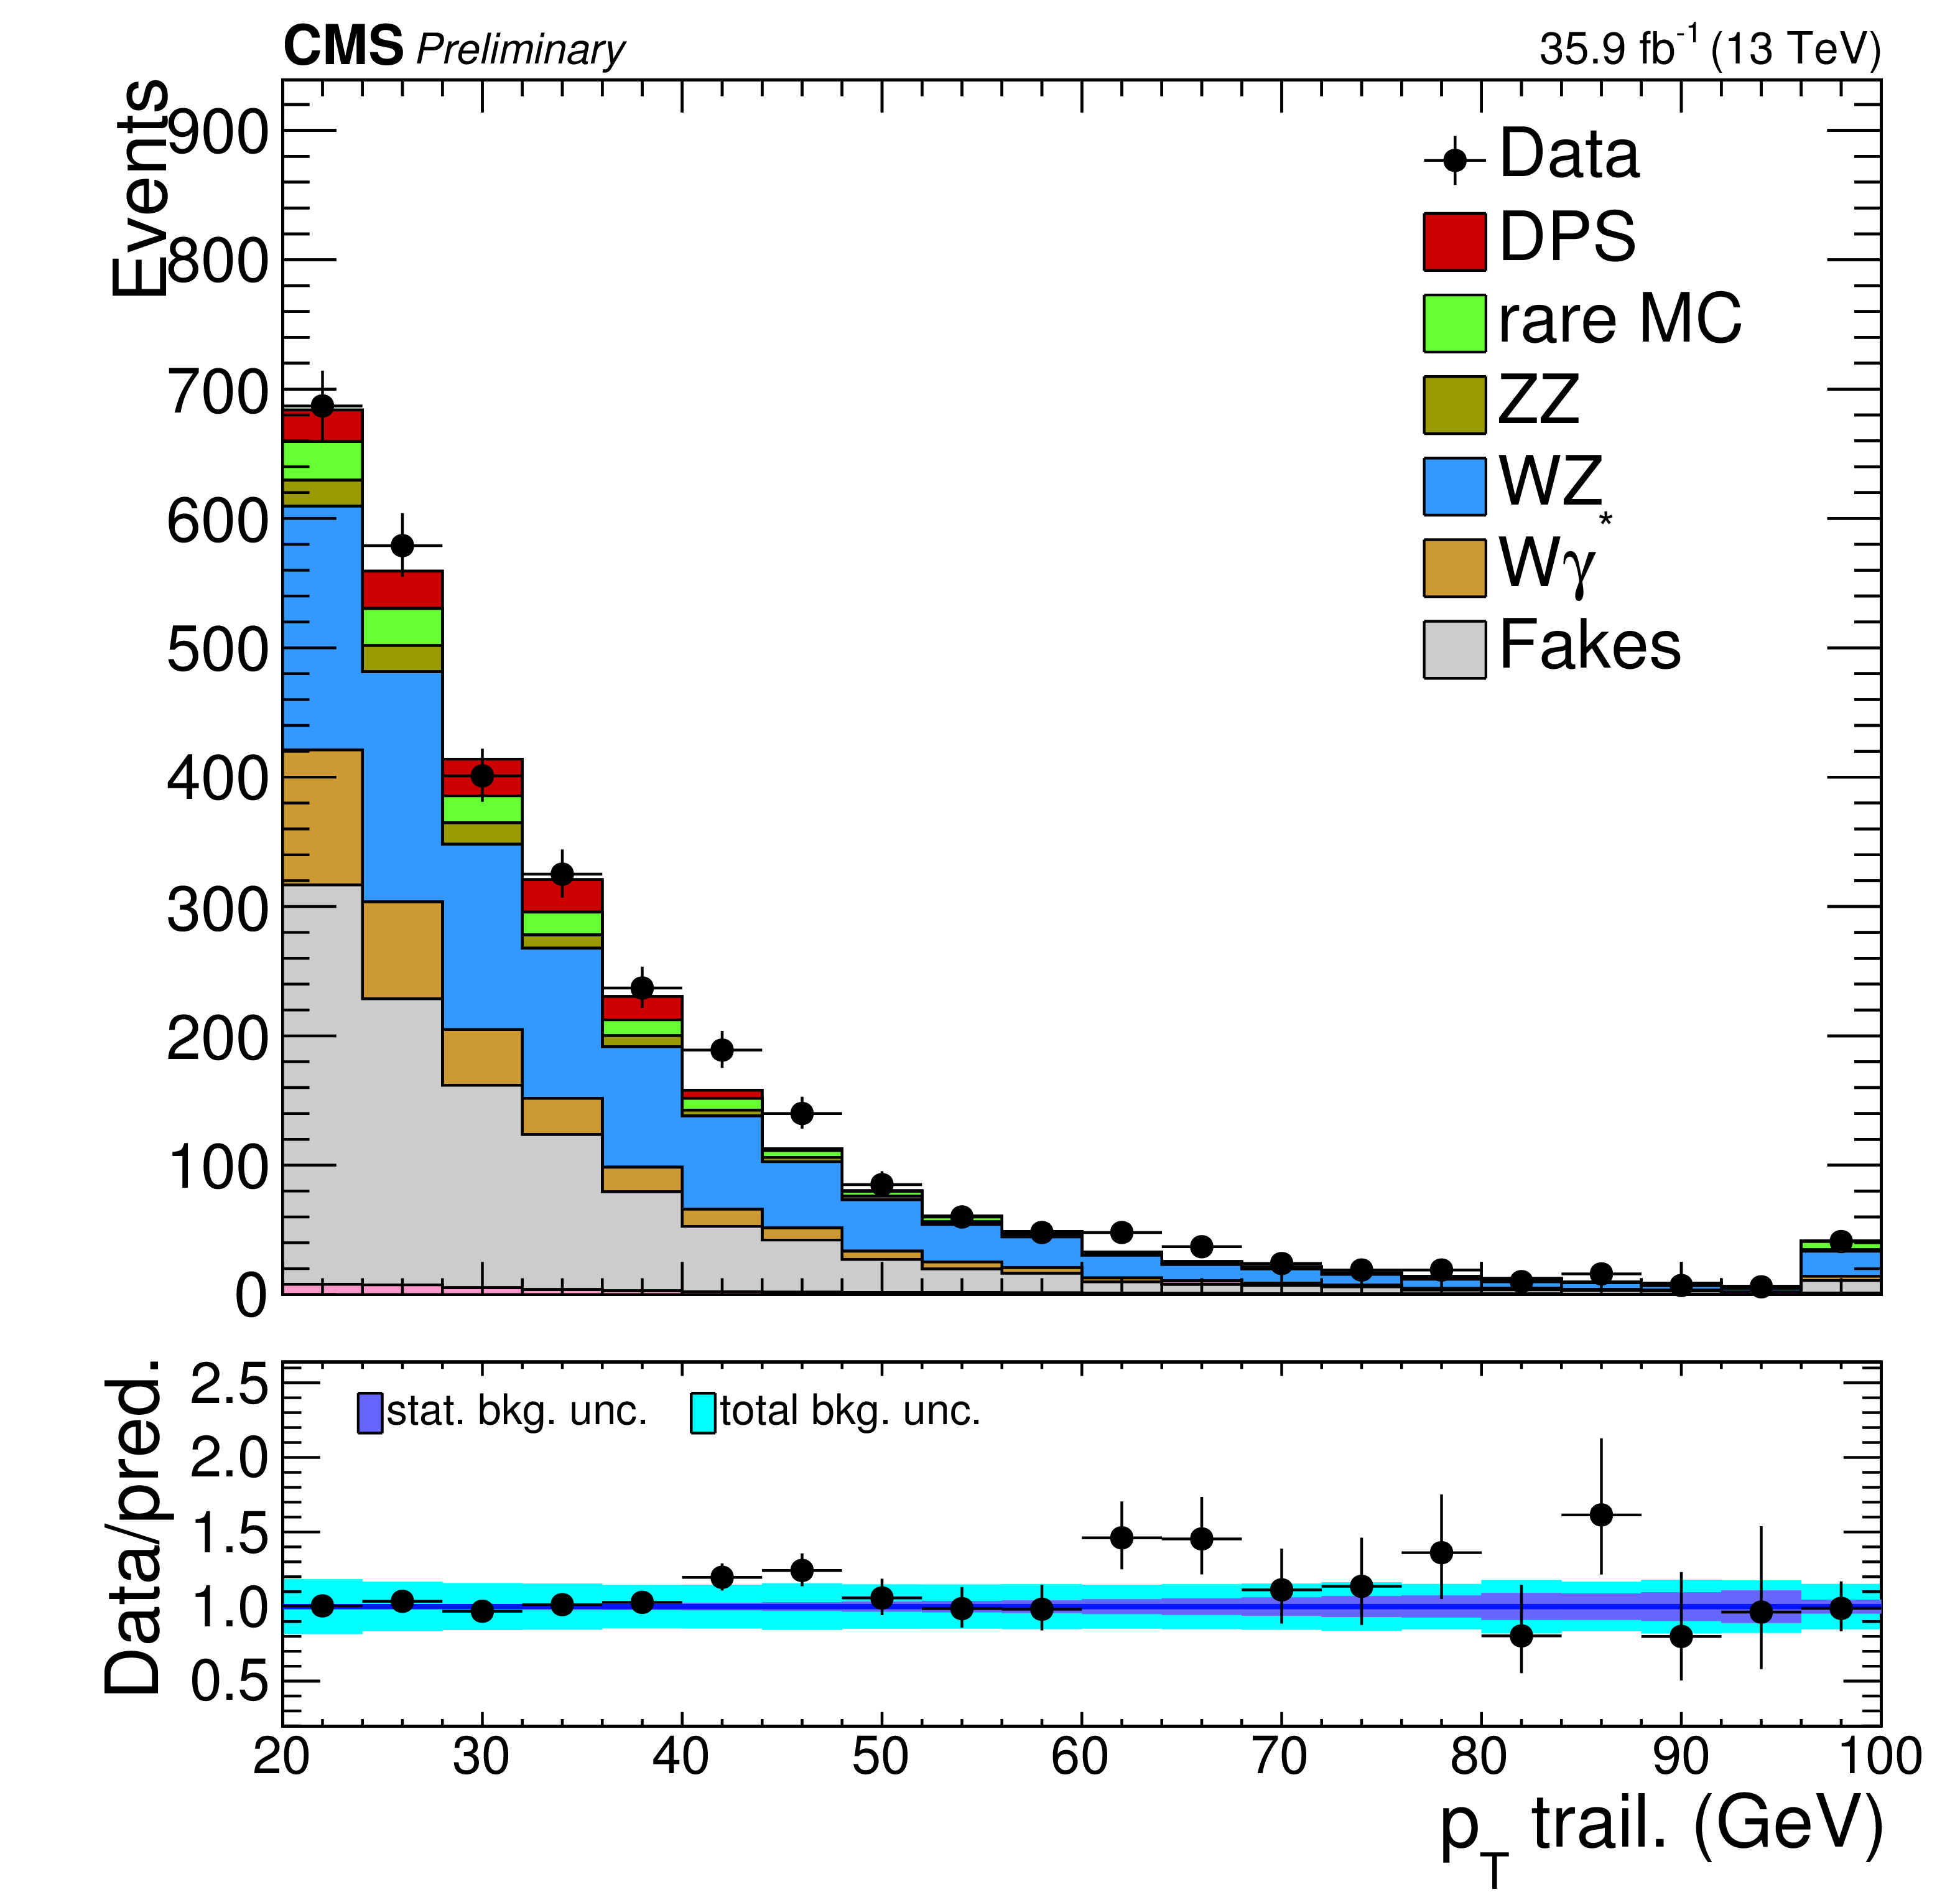
Figure 2-b:
The $p_{\mathrm{T,2}}$ distribution. All backgrounds and the signal are shown in colored histograms with the data shown in black markers. The statistical (dark blue), and systematic (light blue) uncertainty bands are shown in the ratio below the distributions. |
png pdf |
Figure 2-c:
The ${E_{\mathrm {T}}^{\text {miss}}} $ distribution. All backgrounds and the signal are shown in colored histograms with the data shown in black markers. The statistical (dark blue), and systematic (light blue) uncertainty bands are shown in the ratio below the distributions. |

png pdf |
Figure 2-d:
The $\eta _1 \times \eta _2$ distribution. All backgrounds and the signal are shown in colored histograms with the data shown in black markers. The statistical (dark blue), and systematic (light blue) uncertainty bands are shown in the ratio below the distributions. |

png pdf |
Figure 2-e:
The $|\eta _1 + \eta _2|$ distribution. All backgrounds and the signal are shown in colored histograms with the data shown in black markers. The statistical (dark blue), and systematic (light blue) uncertainty bands are shown in the ratio below the distributions. |
png pdf |
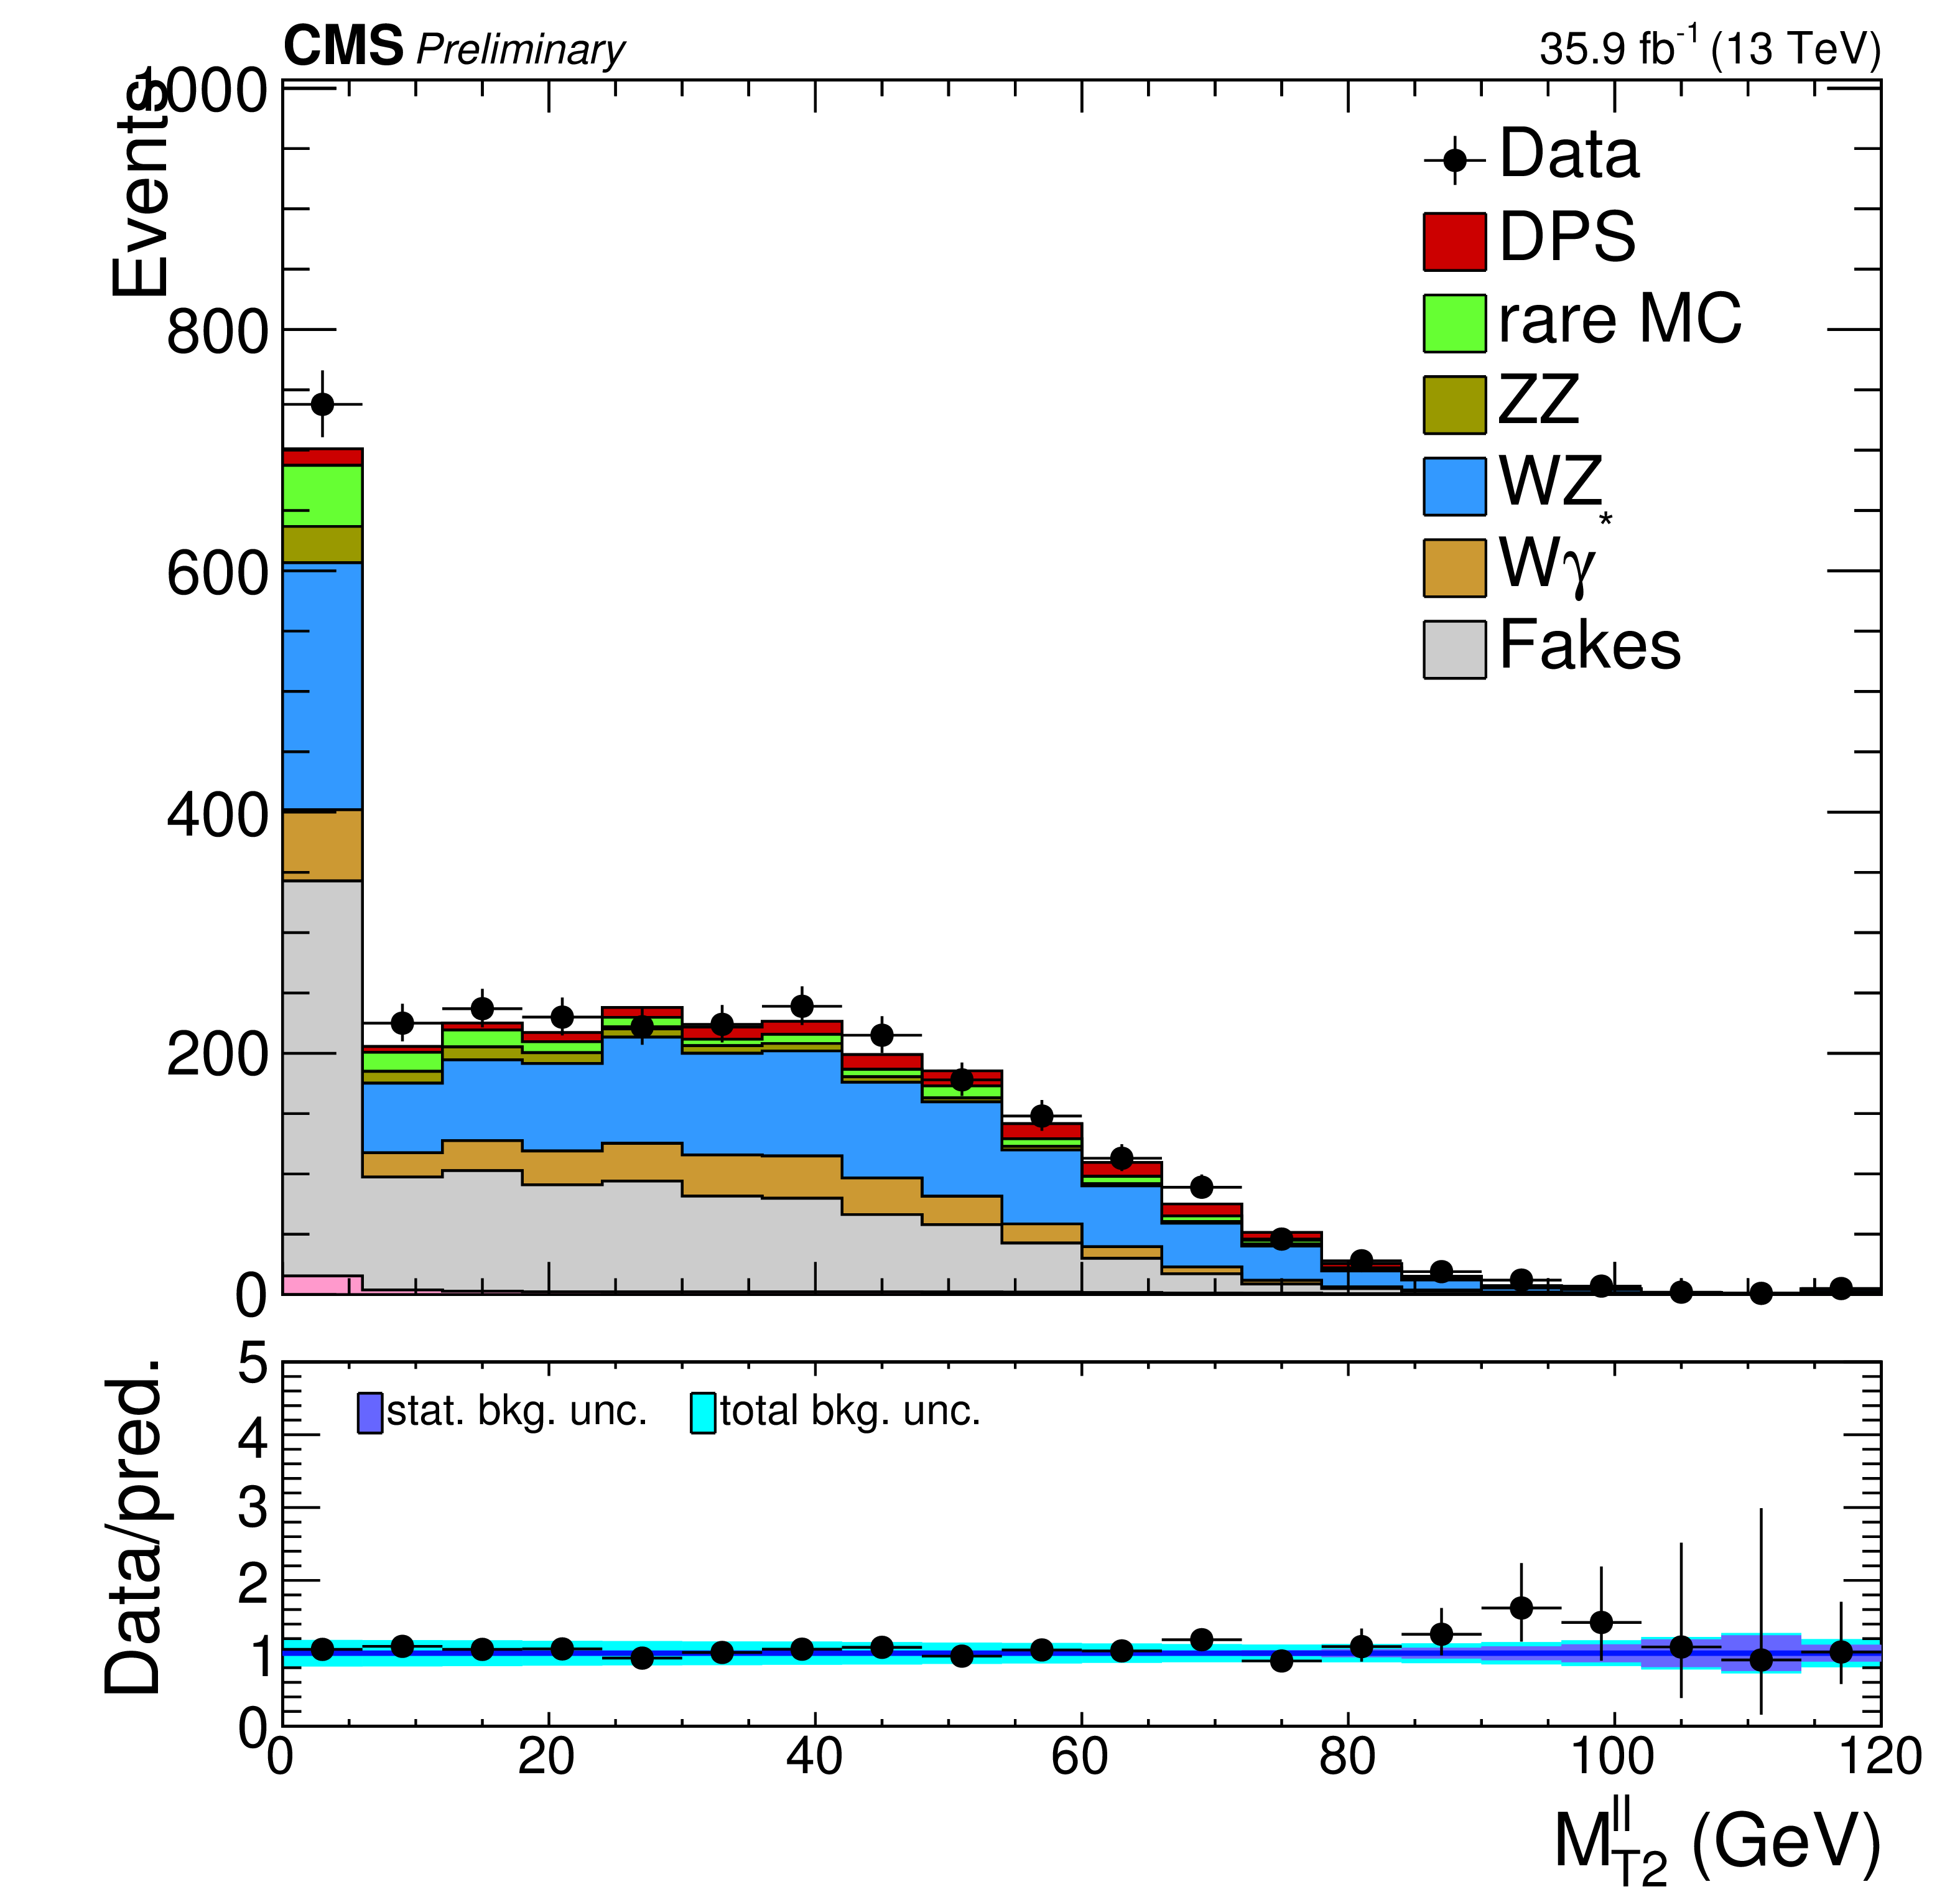
Figure 2-f:
The $M_{\mathrm{T2}}^{\ell \ell }$ distribution. All backgrounds and the signal are shown in colored histograms with the data shown in black markers. The statistical (dark blue), and systematic (light blue) uncertainty bands are shown in the ratio below the distributions. |
png pdf |
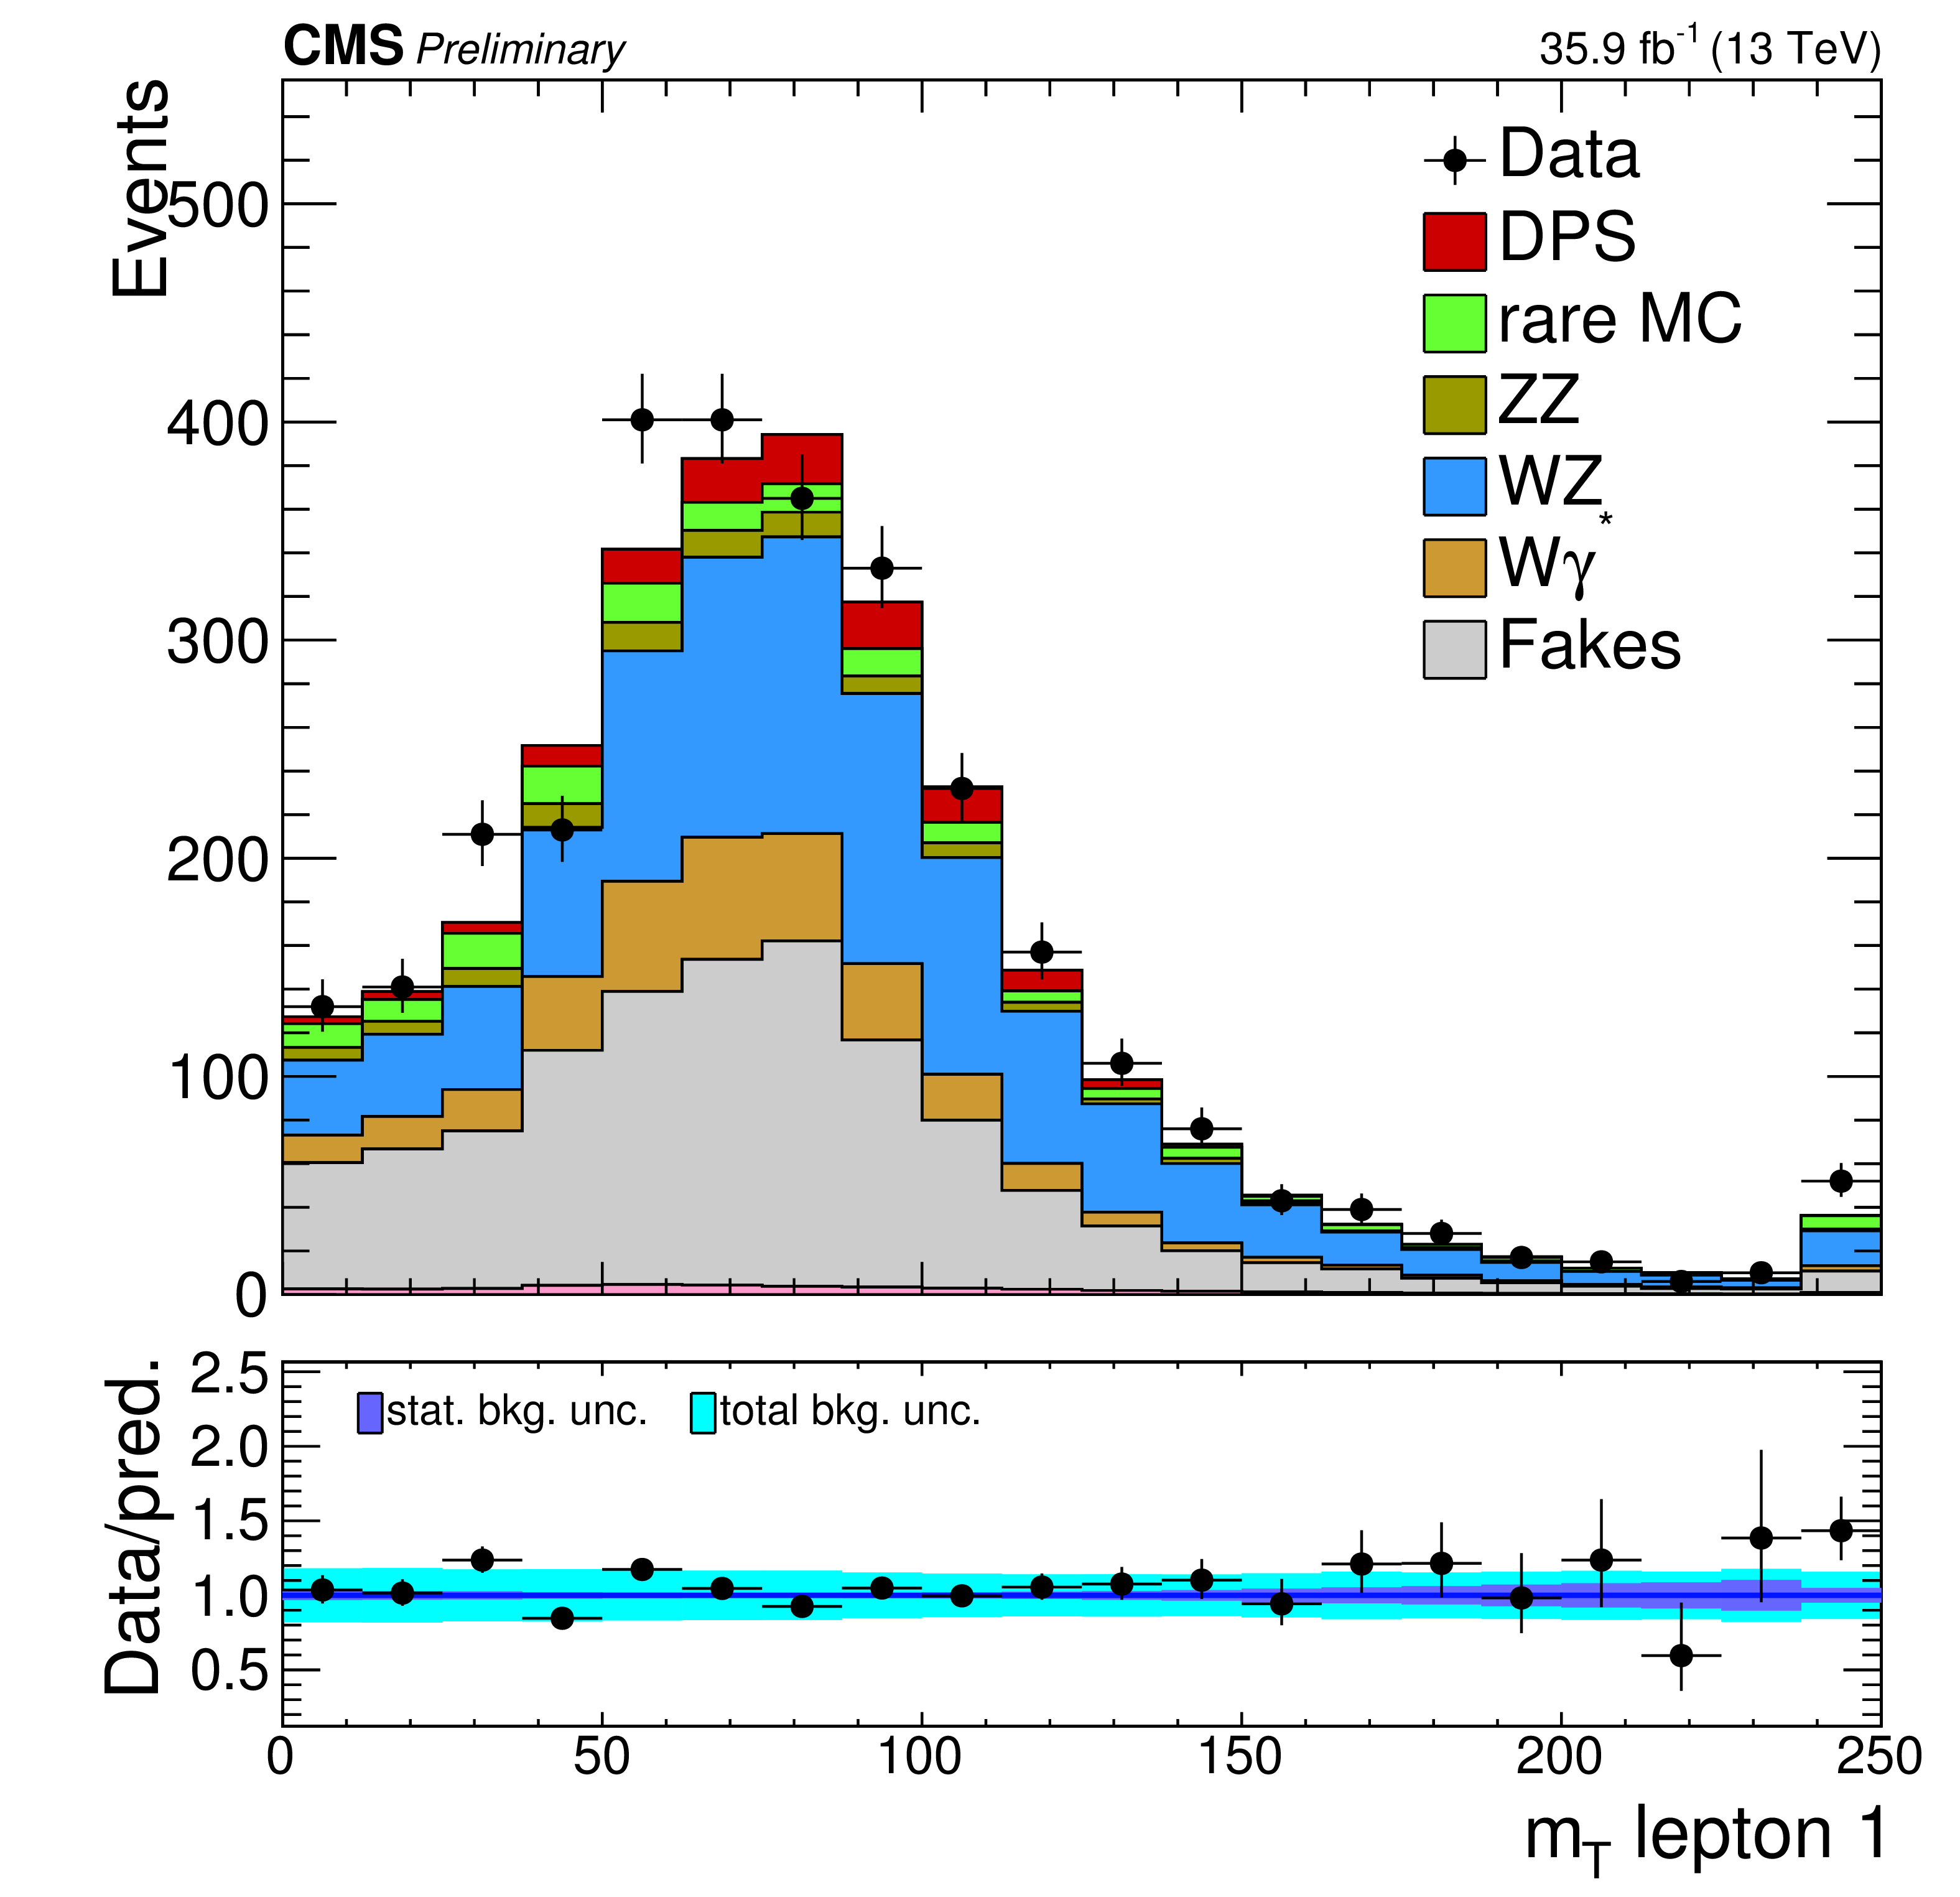
Figure 2-g:
The $M_{\mathrm{T},(\ell _1, {E_{\mathrm {T}}^{\text {miss}}} )}$ distribution. All backgrounds and the signal are shown in colored histograms with the data shown in black markers. The statistical (dark blue), and systematic (light blue) uncertainty bands are shown in the ratio below the distributions. |
png pdf |
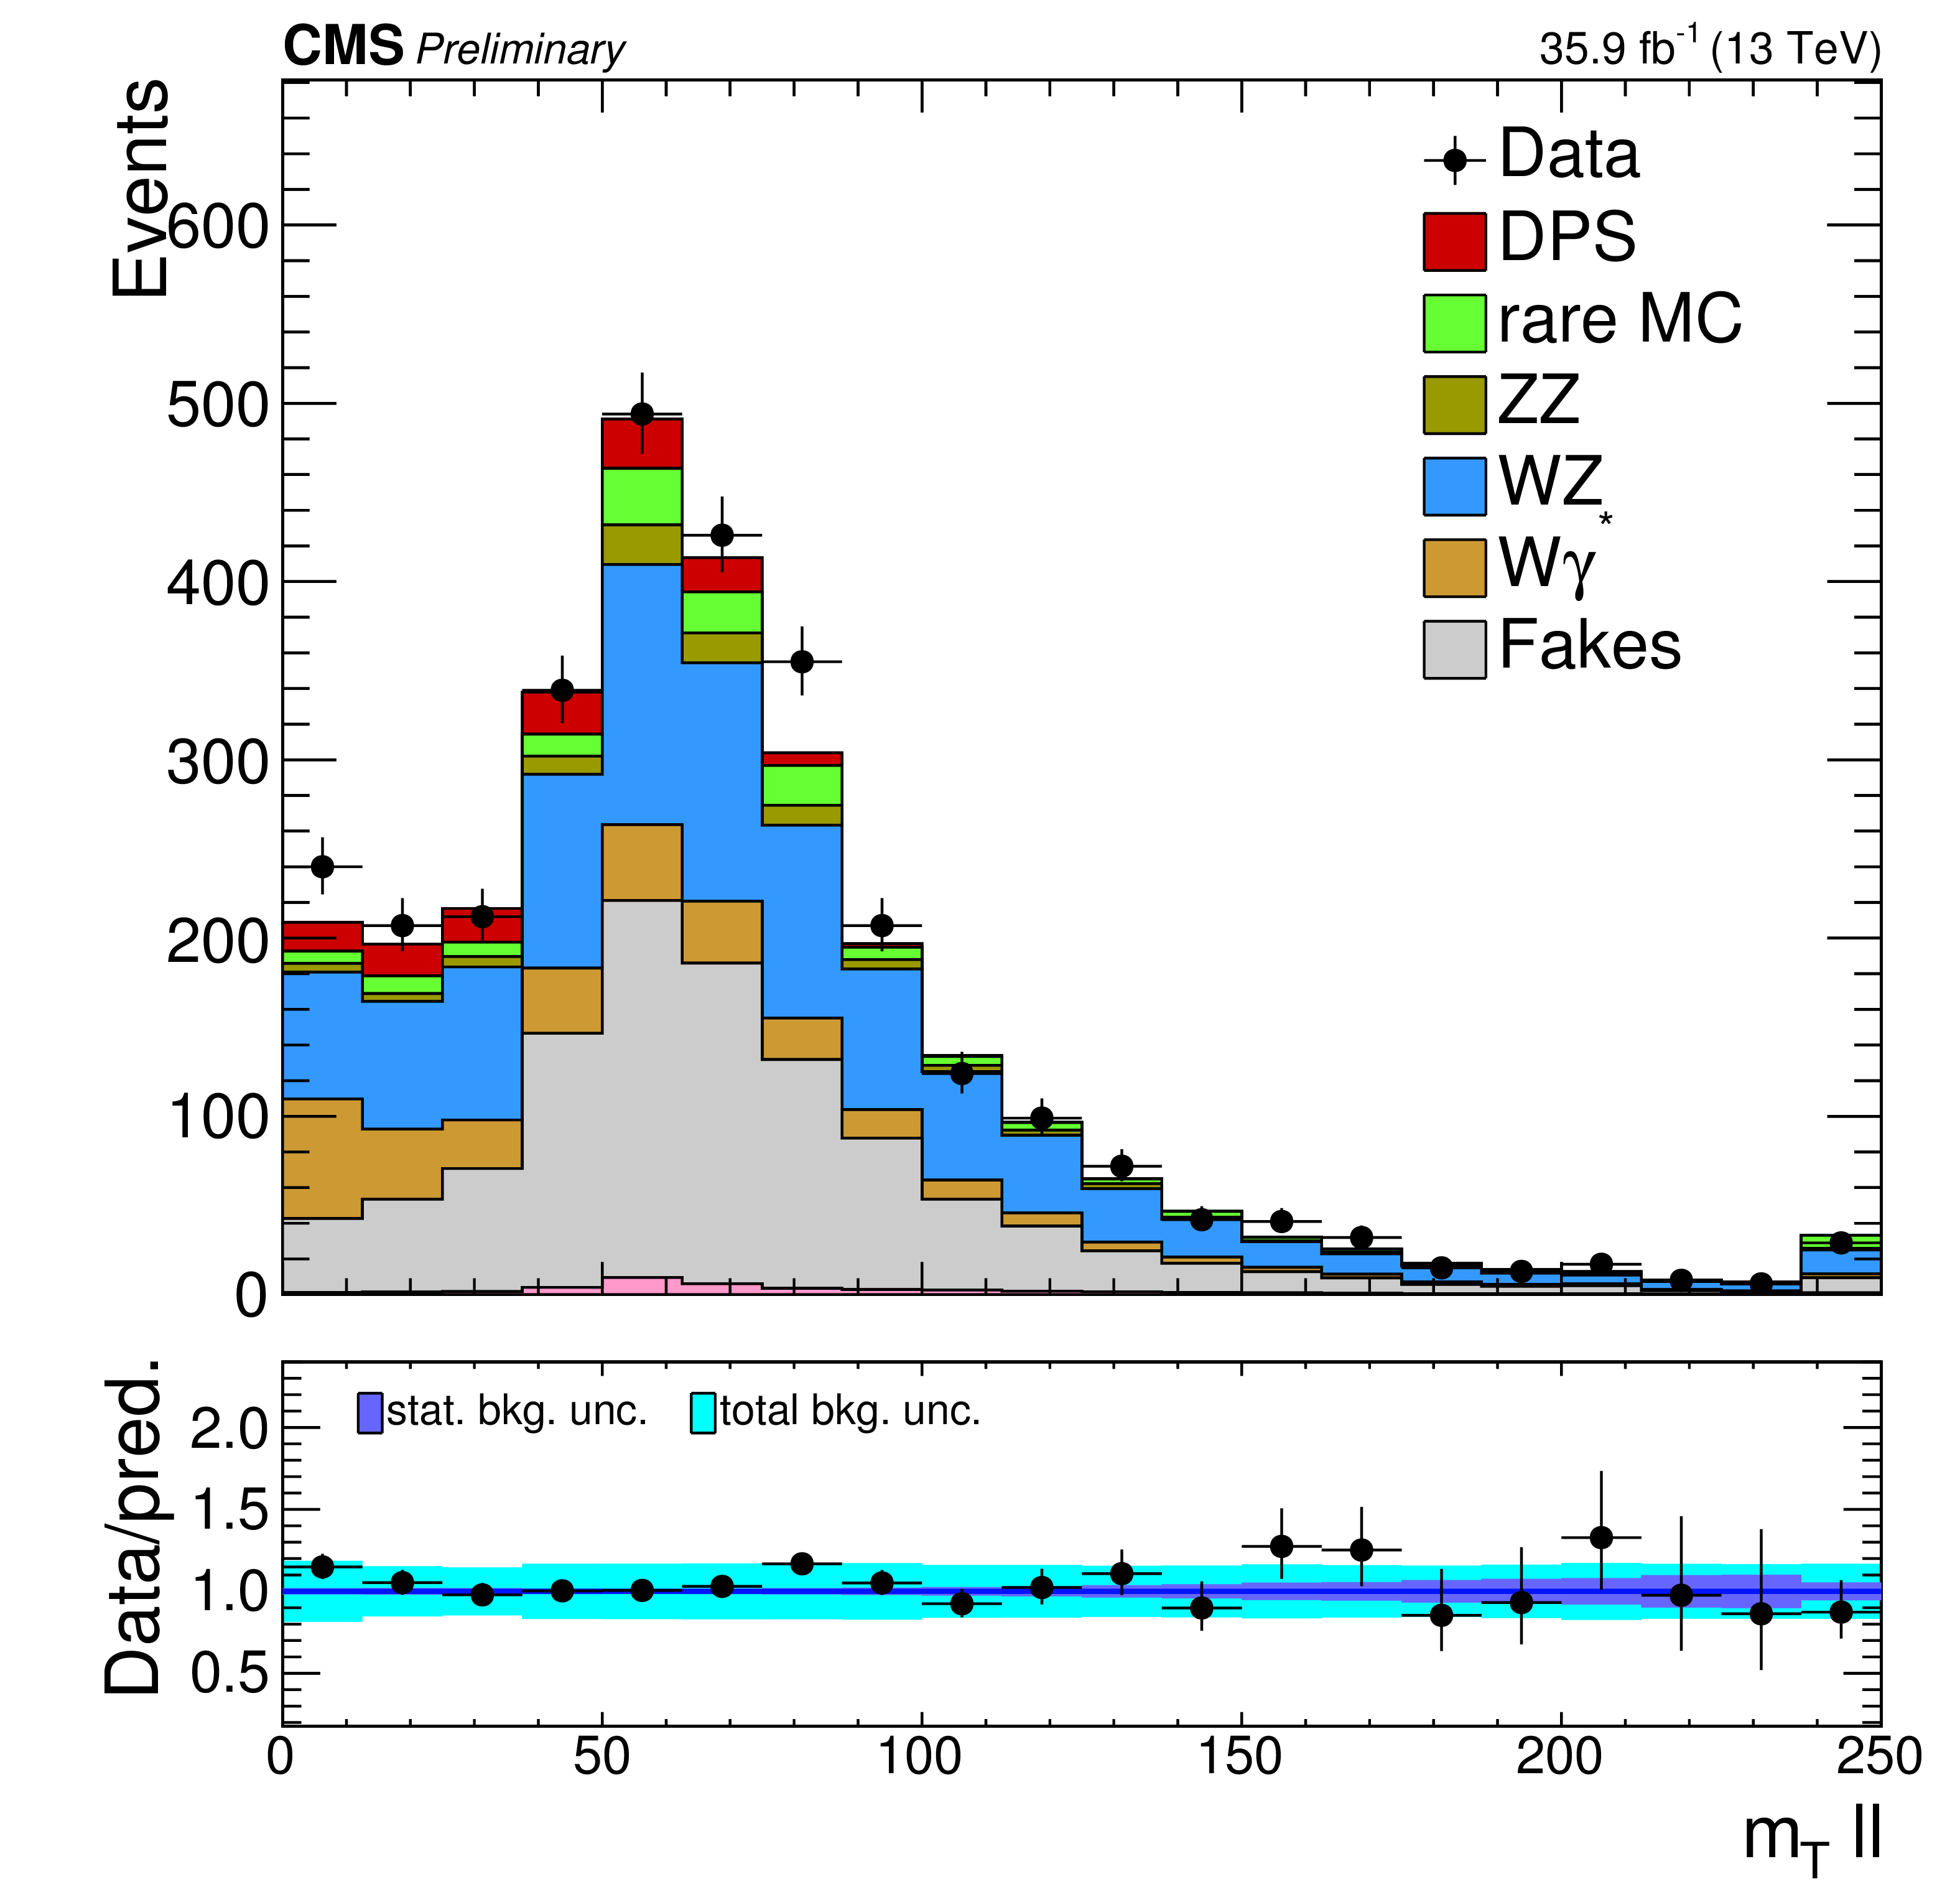
Figure 2-h:
The $M_{\mathrm{T},(\ell _1,\ell _2)}$ distribution. All backgrounds and the signal are shown in colored histograms with the data shown in black markers. The statistical (dark blue), and systematic (light blue) uncertainty bands are shown in the ratio below the distributions. |
png pdf |
Figure 2-i:
The $|\Delta \phi _{(\ell _1,\ell _2)}|$ distribution. All backgrounds and the signal are shown in colored histograms with the data shown in black markers. The statistical (dark blue), and systematic (light blue) uncertainty bands are shown in the ratio below the distributions. |

png pdf |
Figure 2-j:
The $|\Delta \phi _{(\ell \ell ,\ell _2)}|$ distribution. All backgrounds and the signal are shown in colored histograms with the data shown in black markers. The statistical (dark blue), and systematic (light blue) uncertainty bands are shown in the ratio below the distributions. |
png pdf |
Figure 2-k:
The $|\Delta \phi _{(\ell _2, {E_{\mathrm {T}}^{\text {miss}}} )}|$ distribution. All backgrounds and the signal are shown in colored histograms with the data shown in black markers. The statistical (dark blue), and systematic (light blue) uncertainty bands are shown in the ratio below the distributions. |

png pdf |
Figure 2-l:
The BDT discriminator output |

png pdf |
Figure 3:
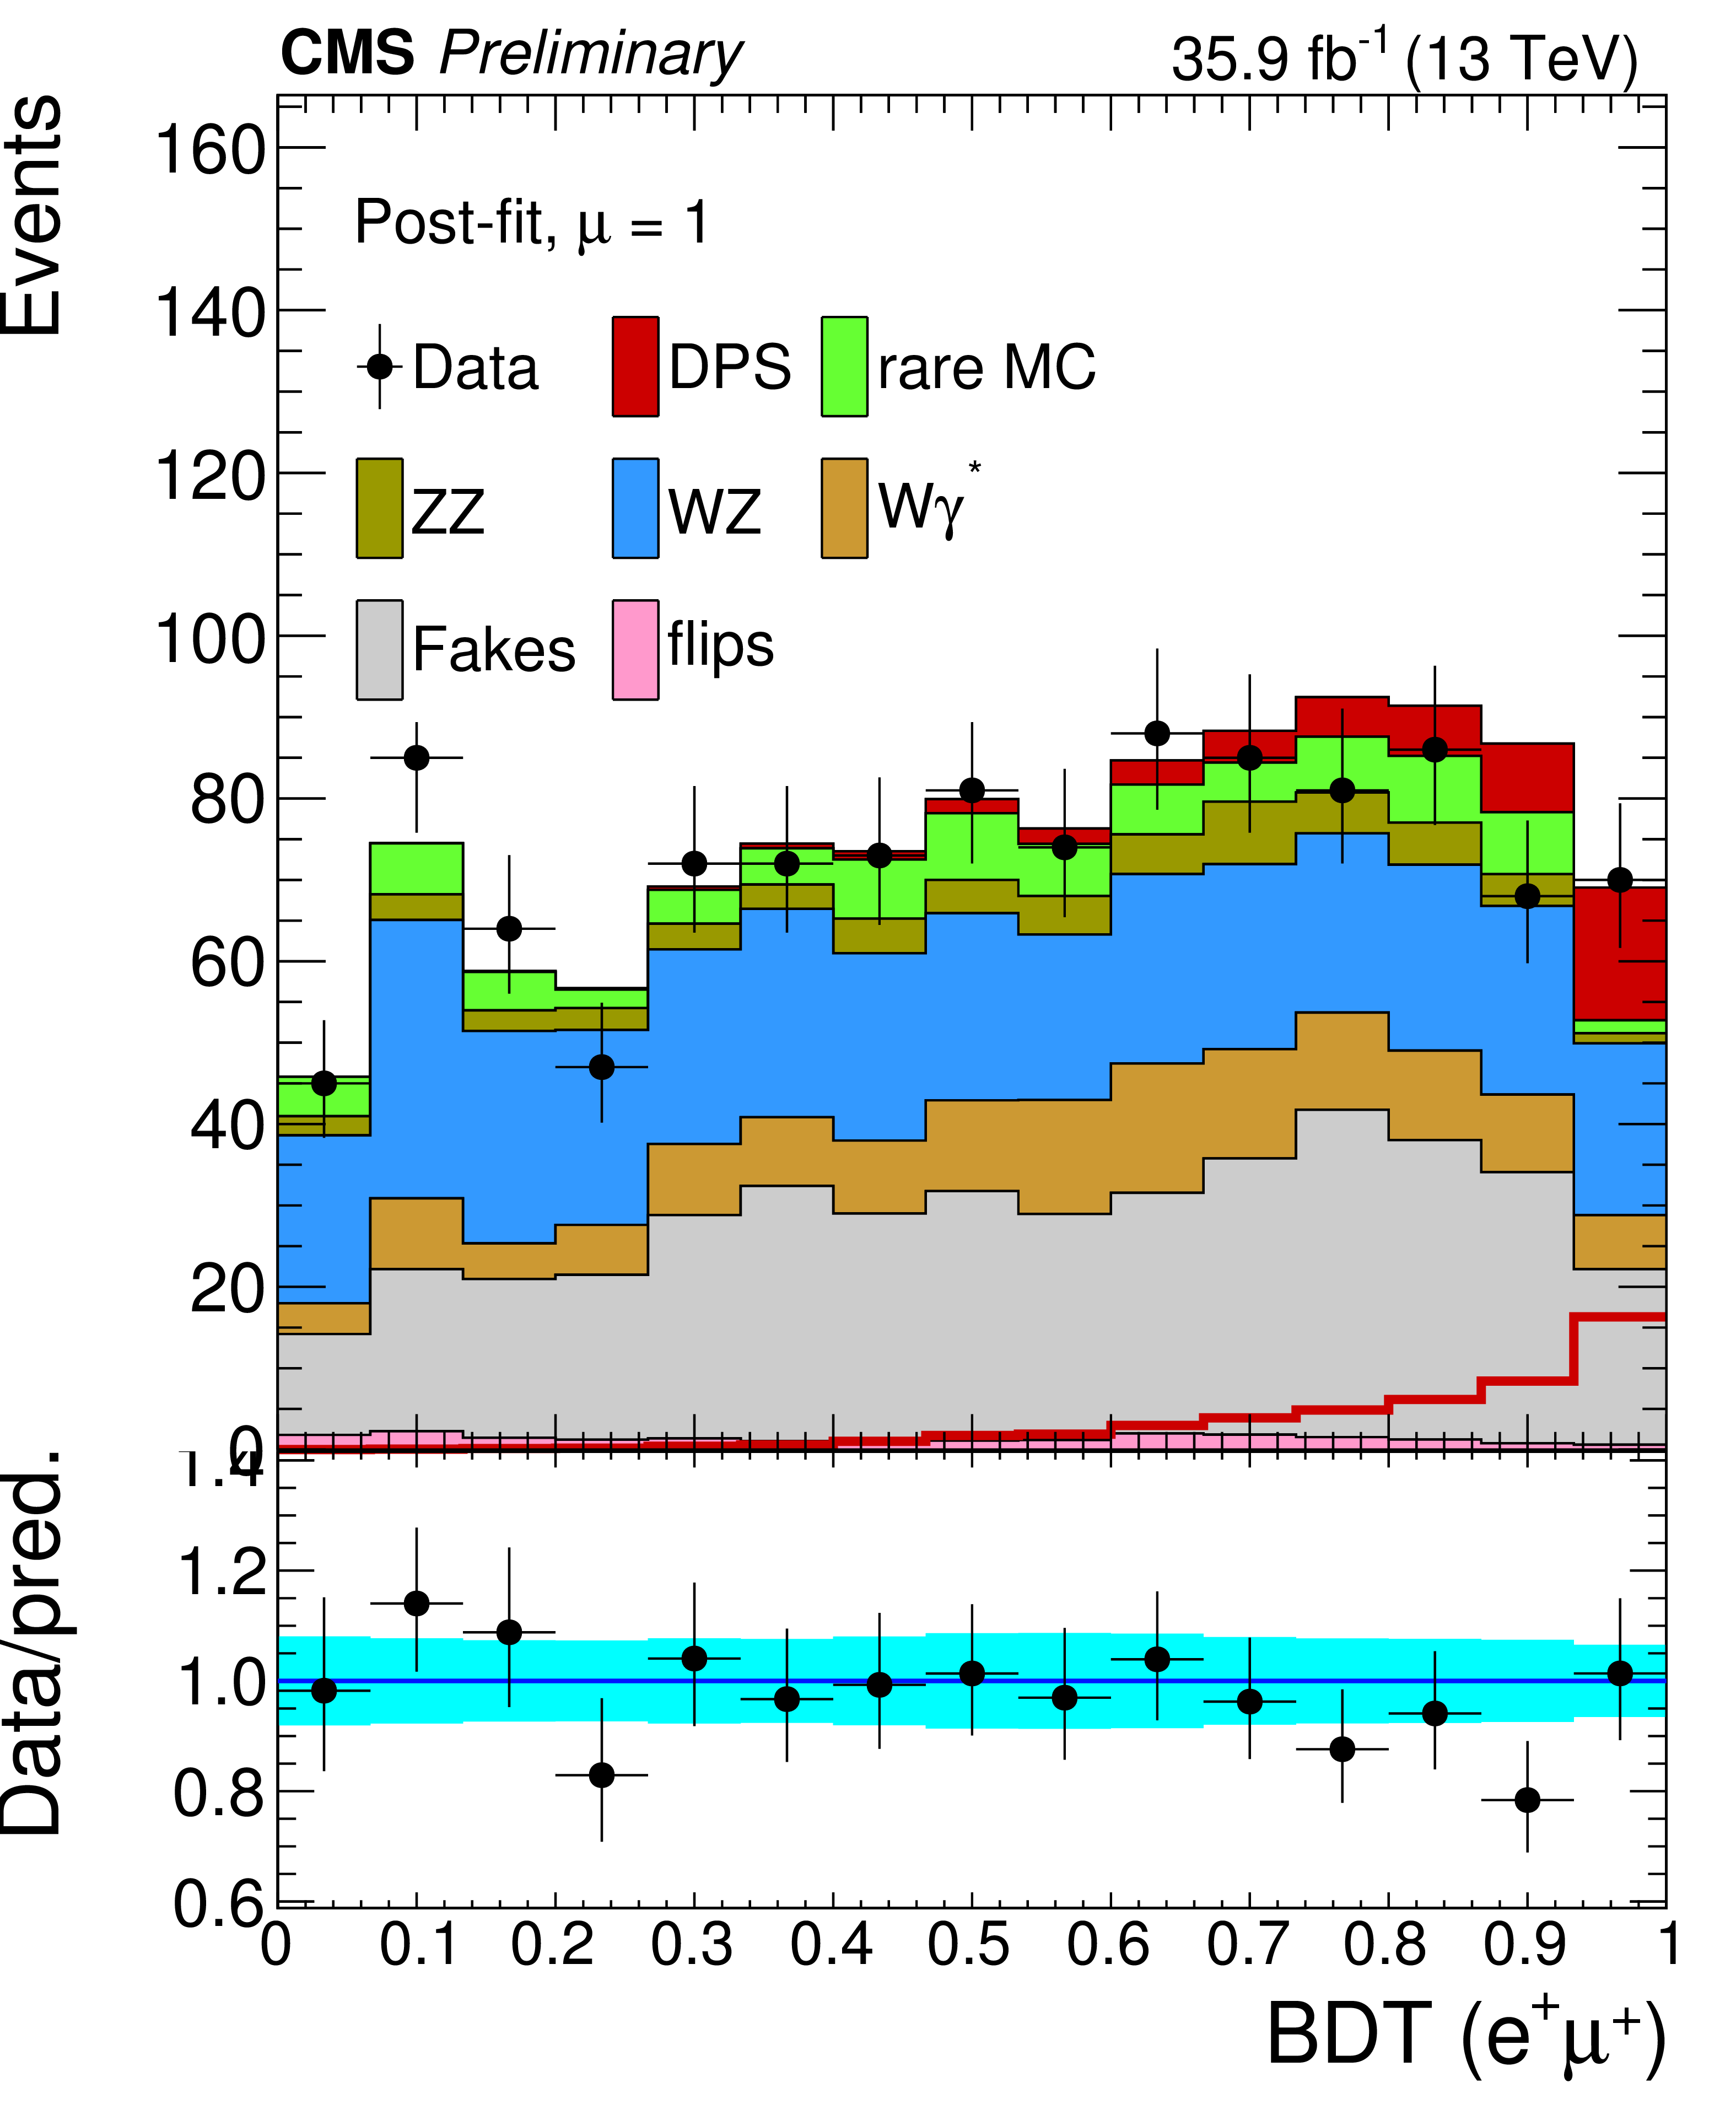
Final BDT classifier output with all background estimations in place for $\mathrm{e}\mu $ in the two charges in the top row and $\mu \mu $ in the bottom row. Observed data are shown in black markers with the signal pre-fit expectation as a red histogram and separately imposed as a red line to show the behavior of the signal in the BDT classifier. All backgrounds are shown with their post-fit values and uncertainties in the other colored histograms. Each plot features a ratio histogram showing the data compared to the background expectation with post-fit uncertainties. |

png pdf |
Figure 3-a:
Final BDT classifier output with all background estimations in place for $\mathrm{e}^{-}\mu^{-} $. Observed data are shown in black markers with the signal pre-fit expectation as a red histogram and separately imposed as a red line to show the behavior of the signal in the BDT classifier. All backgrounds are shown with their post-fit values and uncertainties in the other colored histograms. Each plot features a ratio histogram showing the data compared to the background expectation with post-fit uncertainties. |
png pdf |
Figure 3-b:
Final BDT classifier output with all background estimations in place for $\mathrm{e}^{+}\mu^{+} $. Observed data are shown in black markers with the signal pre-fit expectation as a red histogram and separately imposed as a red line to show the behavior of the signal in the BDT classifier. All backgrounds are shown with their post-fit values and uncertainties in the other colored histograms. Each plot features a ratio histogram showing the data compared to the background expectation with post-fit uncertainties. |

png pdf |
Figure 3-c:
Final BDT classifier output with all background estimations in place for $\mu^{-} \mu^{-} $. Observed data are shown in black markers with the signal pre-fit expectation as a red histogram and separately imposed as a red line to show the behavior of the signal in the BDT classifier. All backgrounds are shown with their post-fit values and uncertainties in the other colored histograms. Each plot features a ratio histogram showing the data compared to the background expectation with post-fit uncertainties. |

png pdf |
Figure 3-d:
Final BDT classifier output with all background estimations in place for $\mu^{+} \mu^{+} $. Observed data are shown in black markers with the signal pre-fit expectation as a red histogram and separately imposed as a red line to show the behavior of the signal in the BDT classifier. All backgrounds are shown with their post-fit values and uncertainties in the other colored histograms. Each plot features a ratio histogram showing the data compared to the background expectation with post-fit uncertainties. |
| Tables | |

png pdf |
Table 1:
Kinematic event selection requirements. |

png pdf |
Table 2:
Summary of pre-fit systematic uncertainties for all background (and signal) components. |
png pdf |
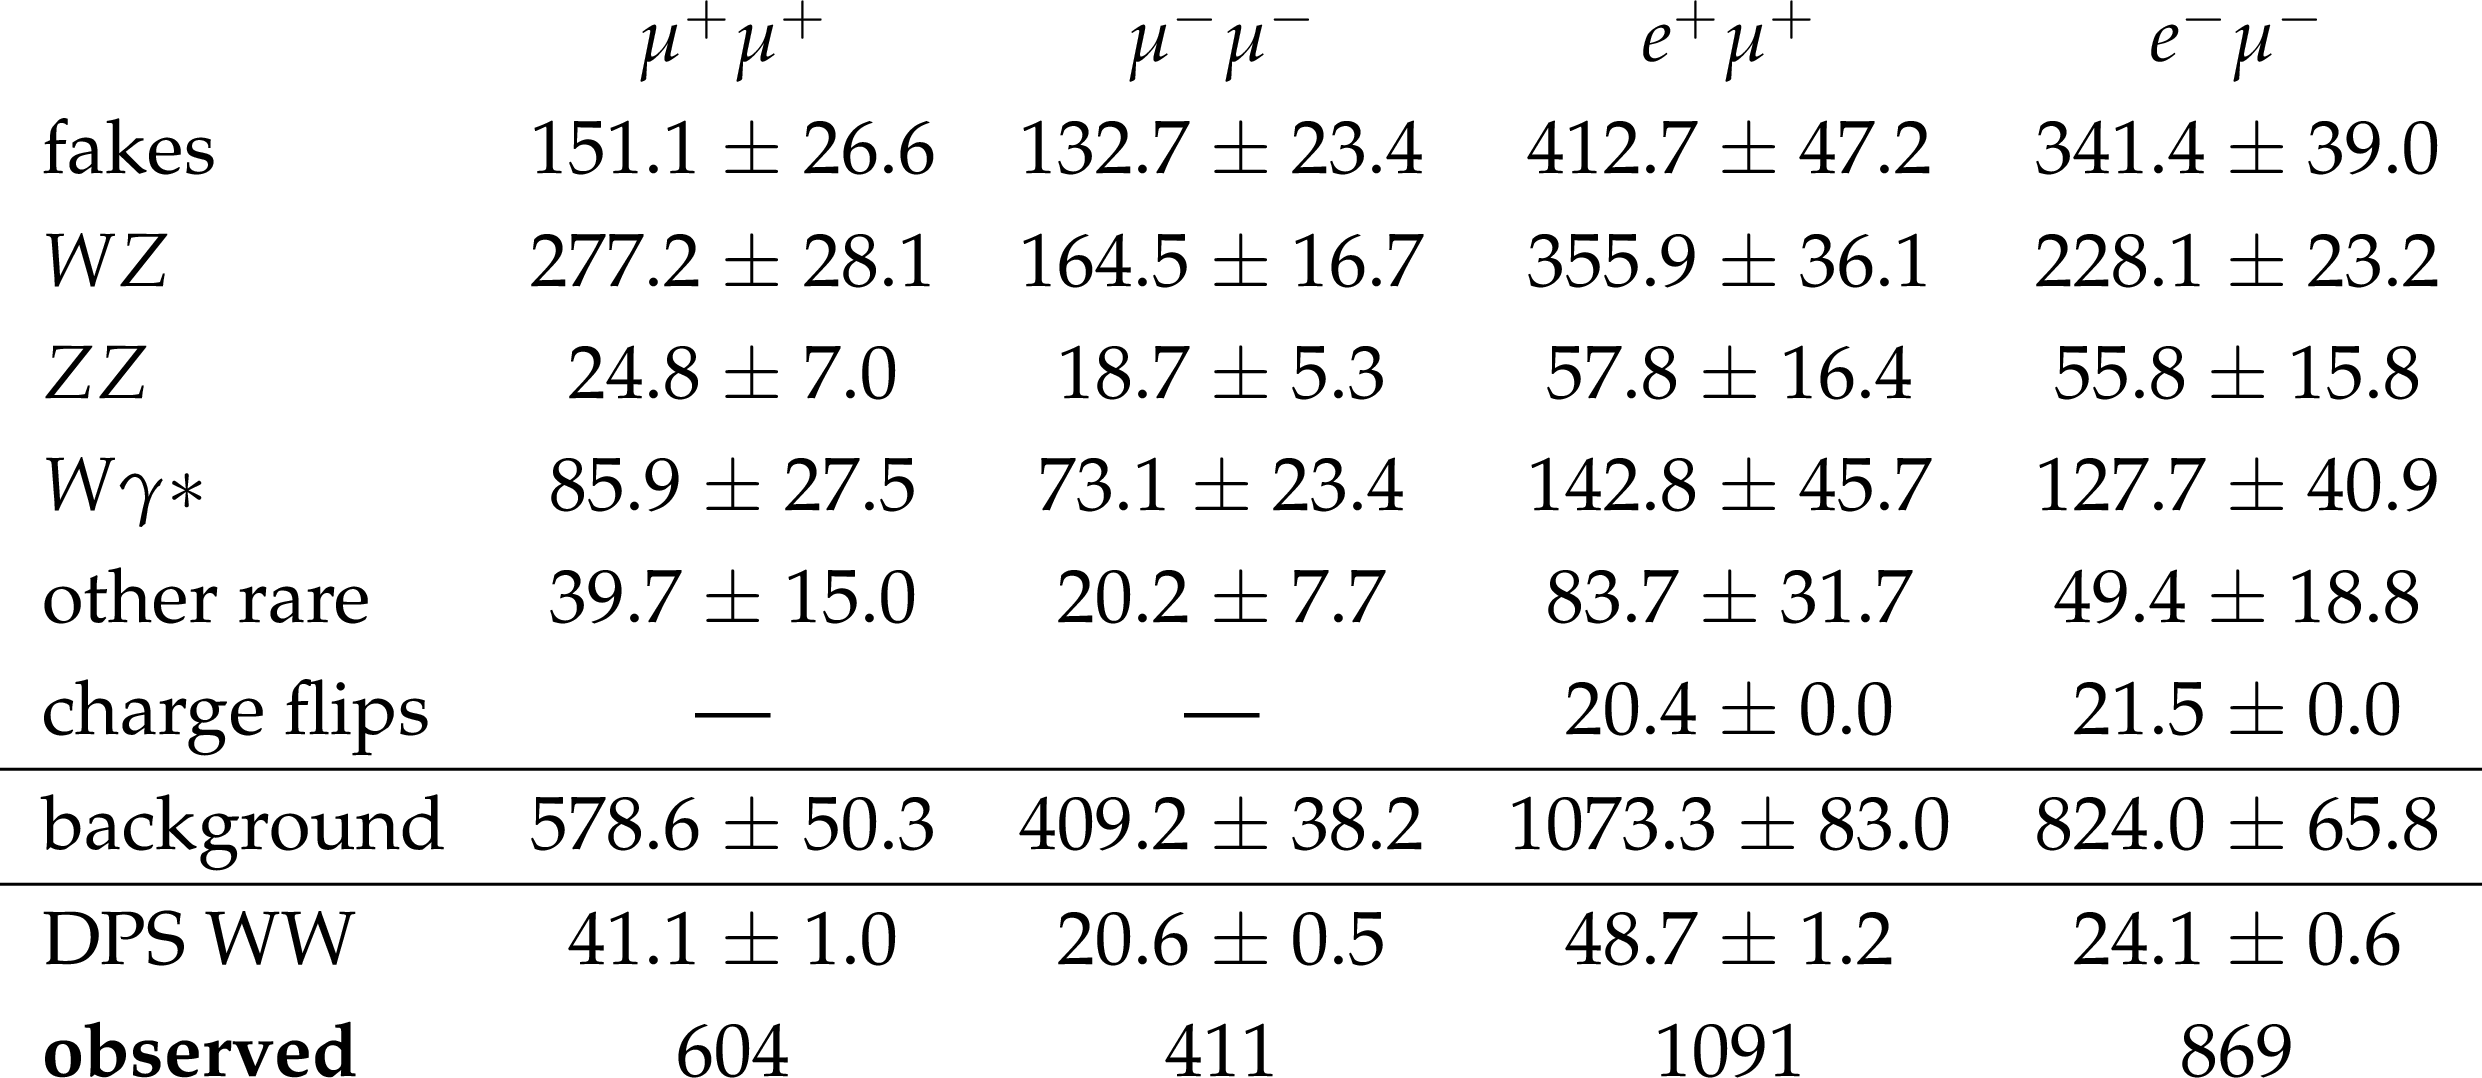
Table 3:
Expected background and signal yields and, observed event counts in the four charge and flavor combinations. |

png pdf |
Table 4:
Results obtained from a constrained fit to the BDT classifier. |
| Summary |
|
The observed yield of the DPS WW signal process is lower than the expectation. Although from the PYTHIA-8 cross section of 1.64 pb a significance of 3.27 is expected, the measured cross section is below that value at 1.09$^{+0.50}_{-0.49}$ pb with a significance of 2.23$\sigma$. Conversely, applying the factorization approach with an expected cross section of 0.87 pb, and an expected significance of 1.81$\sigma$ results in a larger than expected cross section. The upper limit on the cross section in the absence of signal is expected to be $<$ 0.97 pb and measured to be $<$ 1.94 pb. This result presents the most precise measurement of the DPS WW process to date. |
| References | ||||
| 1 | C. Goebel, F. Halzen, and D. M. Scott | Double Drell-Yan Annihilations in Hadron Collisions: Novel Tests of the Constituent Picture | PRD22 (1980) 2789 | |
| 2 | V. Shelest, A. Snigirev, and G. Zinovjev | Gazing into the multiparton distribution equations in QCD | PLB 113 (1982), no. 4, 325 -- 328 | |
| 3 | AFS Collaboration | Double Parton Scattering in $ p p $ Collisions at $ \sqrt{s}= $ 63 GeV | Z. Phys. C34 (1987) 163 | |
| 4 | M. Diehl, D. Ostermeier, and A. Schafer | Elements of a theory for multiparton interactions in QCD | JHEP 03 (2012) 089 | 1111.0910 |
| 5 | G. Calucci and D. Treleani | Disentangling correlations in Multiple Parton Interactions | PRD83 (2011) 016012 | 1009.5881 |
| 6 | CMS Collaboration | Study of double parton scattering using W + 2-jet events in proton-proton collisions at $ \sqrt{s} = $ 7 TeV | JHEP 03 (2014) 032 | CMS-FSQ-12-028 1312.5729 |
| 7 | ATLAS Collaboration | Measurement of hard double-parton interactions in $ W(\to l\nu) $+ 2 jet events at $ \sqrt{s} = $ 7 TeV with the ATLAS detector | New J. Phys. 15 (2013) 033038 | 1301.6872 |
| 8 | CMS Collaboration | Event generator tunes obtained from underlying event and multiparton scattering measurements | EPJC76 (2016), no. 3, 155 | CMS-GEN-14-001 1512.00815 |
| 9 | D0 Collaboration | Double parton interactions in $ {\gamma}+3 $ jet events in $ p\overline{p} $ collisions at $ \sqrt{s}= $ 1.96 TeV | PRD 81 (2010) 052012 | |
| 10 | CDF Collaboration | Measurement of Double Parton Scattering in $ \overline{p}p $ Collisions at $ \sqrt{s} = $ 1.8 TeV | PRL 79 (1997) 584--589 | |
| 11 | UA2 Collaboration | A Study of multi - jet events at the CERN anti-p p collider and a search for double parton scattering | PLB268 (1991) 145--154 | |
| 12 | CMS Collaboration | Double Parton Scattering cross section limit from same-sign W bosons pair production in di-muon final state at LHC | CMS-PAS-FSQ-13-001 | CMS-PAS-FSQ-13-001 |
| 13 | J. R. Gaunt, C.-H. Kom, A. Kulesza, and W. J. Stirling | Same-sign W pair production as a probe of double parton scattering at the LHC | EPJC69 (2010) 53--65 | 1003.3953 |
| 14 | CMS Collaboration | Searches for electroweak production of charginos, neutralinos, and sleptons decaying to leptons and W, Z, and Higgs bosons in pp collisions at 8 TeV | EPJC74 (2014), no. 9 | CMS-SUS-13-006 1405.7570 |
| 15 | CMS Collaboration | Search for electroweak SUSY production in multilepton final states in pp collisions at $ \sqrt{s} = $ 13 TeV with 12.9 fb$ ^{-1} $ | CMS-PAS-SUS-16-024 | CMS-PAS-SUS-16-024 |
| 16 | CMS Collaboration | The CMS experiment at the CERN LHC | JINST 3 (2008) S08004 | CMS-00-001 |
| 17 | CMS Collaboration | Reconstruction and identification of $\tau$ lepton decays to hadrons and $\neutrino_{\tau}$ at CMS | JINST 11 (2016), no. 01, P01019 | CMS-TAU-14-001 1510.07488 |
| 18 | CMS Collaboration | Search for associated production of Higgs bosons and top quarks in multilepton final states at $ \sqrt{s}= $ 13 TeV | CMS-PAS-HIG-16-022 | CMS-PAS-HIG-16-022 |
| 19 | M. Cacciari, G. P. Salam, and G. Soyez | The anti-$ k_t $ jet clustering algorithm | JHEP 04 (2008) 063 | 0802.1189 |
| 20 | M. Cacciari, G. P. Salam, and G. Soyez | FastJet user manual | EPJC 72 (2012) 1896 | 1111.6097 |
| 21 | M. Cacciari and G. P. Salam | Dispelling the N$ ^3 $ myth for the $ k_t $ jet-finder | PLB 641 (2006) 57 | hep-ph/0512210 |
| 22 | CMS Collaboration | Determination of Jet Energy Calibration and Transverse Momentum Resolution in CMS | JINST 6 (2011) P11002 | CMS-JME-10-011 1107.4277 |
| 23 | M. Cacciari and G. P. Salam | Pileup subtraction using jet areas | PLB 659 (2008) 119 | 0707.1378 |
| 24 | J. Alwall et al. | The automated computation of tree-level and next-to-leading order differential cross sections, and their matching to parton shower simulations | JHEP 07 (2014) 079 | 1405.0301 |
| 25 | S. Frixione, P. Nason, and C. Oleari | Matching NLO QCD computations with Parton Shower simulations: the POWHEG method | JHEP 11 (2007) 070 | 0709.2092 |
| 26 | T. Sjostrand, S. Mrenna, and P. Z. Skands | PYTHIA 6.4 physics and manual | JHEP 05 (2006) 026 | hep-ph/0603175 |
| 27 | NNPDF Collaboration | Parton distributions for the LHC Run II | JHEP 04 (2015) 040 | 1410.8849 |
| 28 | GEANT4 Collaboration | GEANT4 --- a simulation toolkit | NIMA 506 (2003) 250 | |
| 29 | CMS Collaboration | Search for new physics with same-sign isolated dilepton events with jets and missing transverse energy at the LHC | JHEP 06 (2011) 077 | CMS-SUS-10-004 1104.3168 |
| 30 | CMS Collaboration | Search for new physics in events with same-sign dileptons and $ b $-tagged jets in $ pp $ collisions at $ \sqrt{s}= $ 7 TeV | JHEP 08 (2012) 110 | CMS-SUS-11-020 1205.3933 |
| 31 | C. G. Lester and D. J. Summers | Measuring masses of semiinvisibly decaying particles pair produced at hadron colliders | PLB463 (1999) 99--103 | hep-ph/9906349 |
| 32 | A. Barr, C. Lester, and P. Stephens | m(T2): The Truth behind the glamour | JPG29 (2003) 2343--2363 | hep-ph/0304226 |
| 33 | C. Anastasiou, L. J. Dixon, K. Melnikov, and F. Petriello | High precision QCD at hadron colliders: Electroweak gauge boson rapidity distributions at NNLO | PRD69 (2004) 094008 | hep-ph/0312266 |
| 34 | R. Gavin, Y. Li, F. Petriello, and S. Quackenbush | W Physics at the LHC with FEWZ 2.1 | CPC 184 (2013) 208--214 | 1201.5896 |
|
|
Compact Muon Solenoid LHC, CERN |
|

|

|

|

|

|