

Compact Muon Solenoid
LHC, CERN
| CMS-PAS-FTR-21-004 | ||
| Prospects for non-resonant Higgs boson pair production measurement in bb$\gamma\gamma$ final states in proton-proton collisions at $\sqrt{s}=$ 14 TeV at the High-Luminosity LHC | ||
| CMS Collaboration | ||
| March 2022 | ||
| Abstract: The nonresonant production of a Higgs boson pair, followed by decays to a pair of bottom quarks and a pair of photons, is studied in the context of the high luminosity operation of the LHC machine. The standard model signal sensitivity is studied with a fast simulation of the Phase-2 upgraded CMS detector with an average of 200 interactions per bunch crossing at $\sqrt{s}=$ 14 TeV and corresponding to an integrated luminosity of 3000 fb$^{-1}$. | ||
| Links: CDS record (PDF) ; CADI line (restricted) ; | ||
| Figures | |

png pdf |
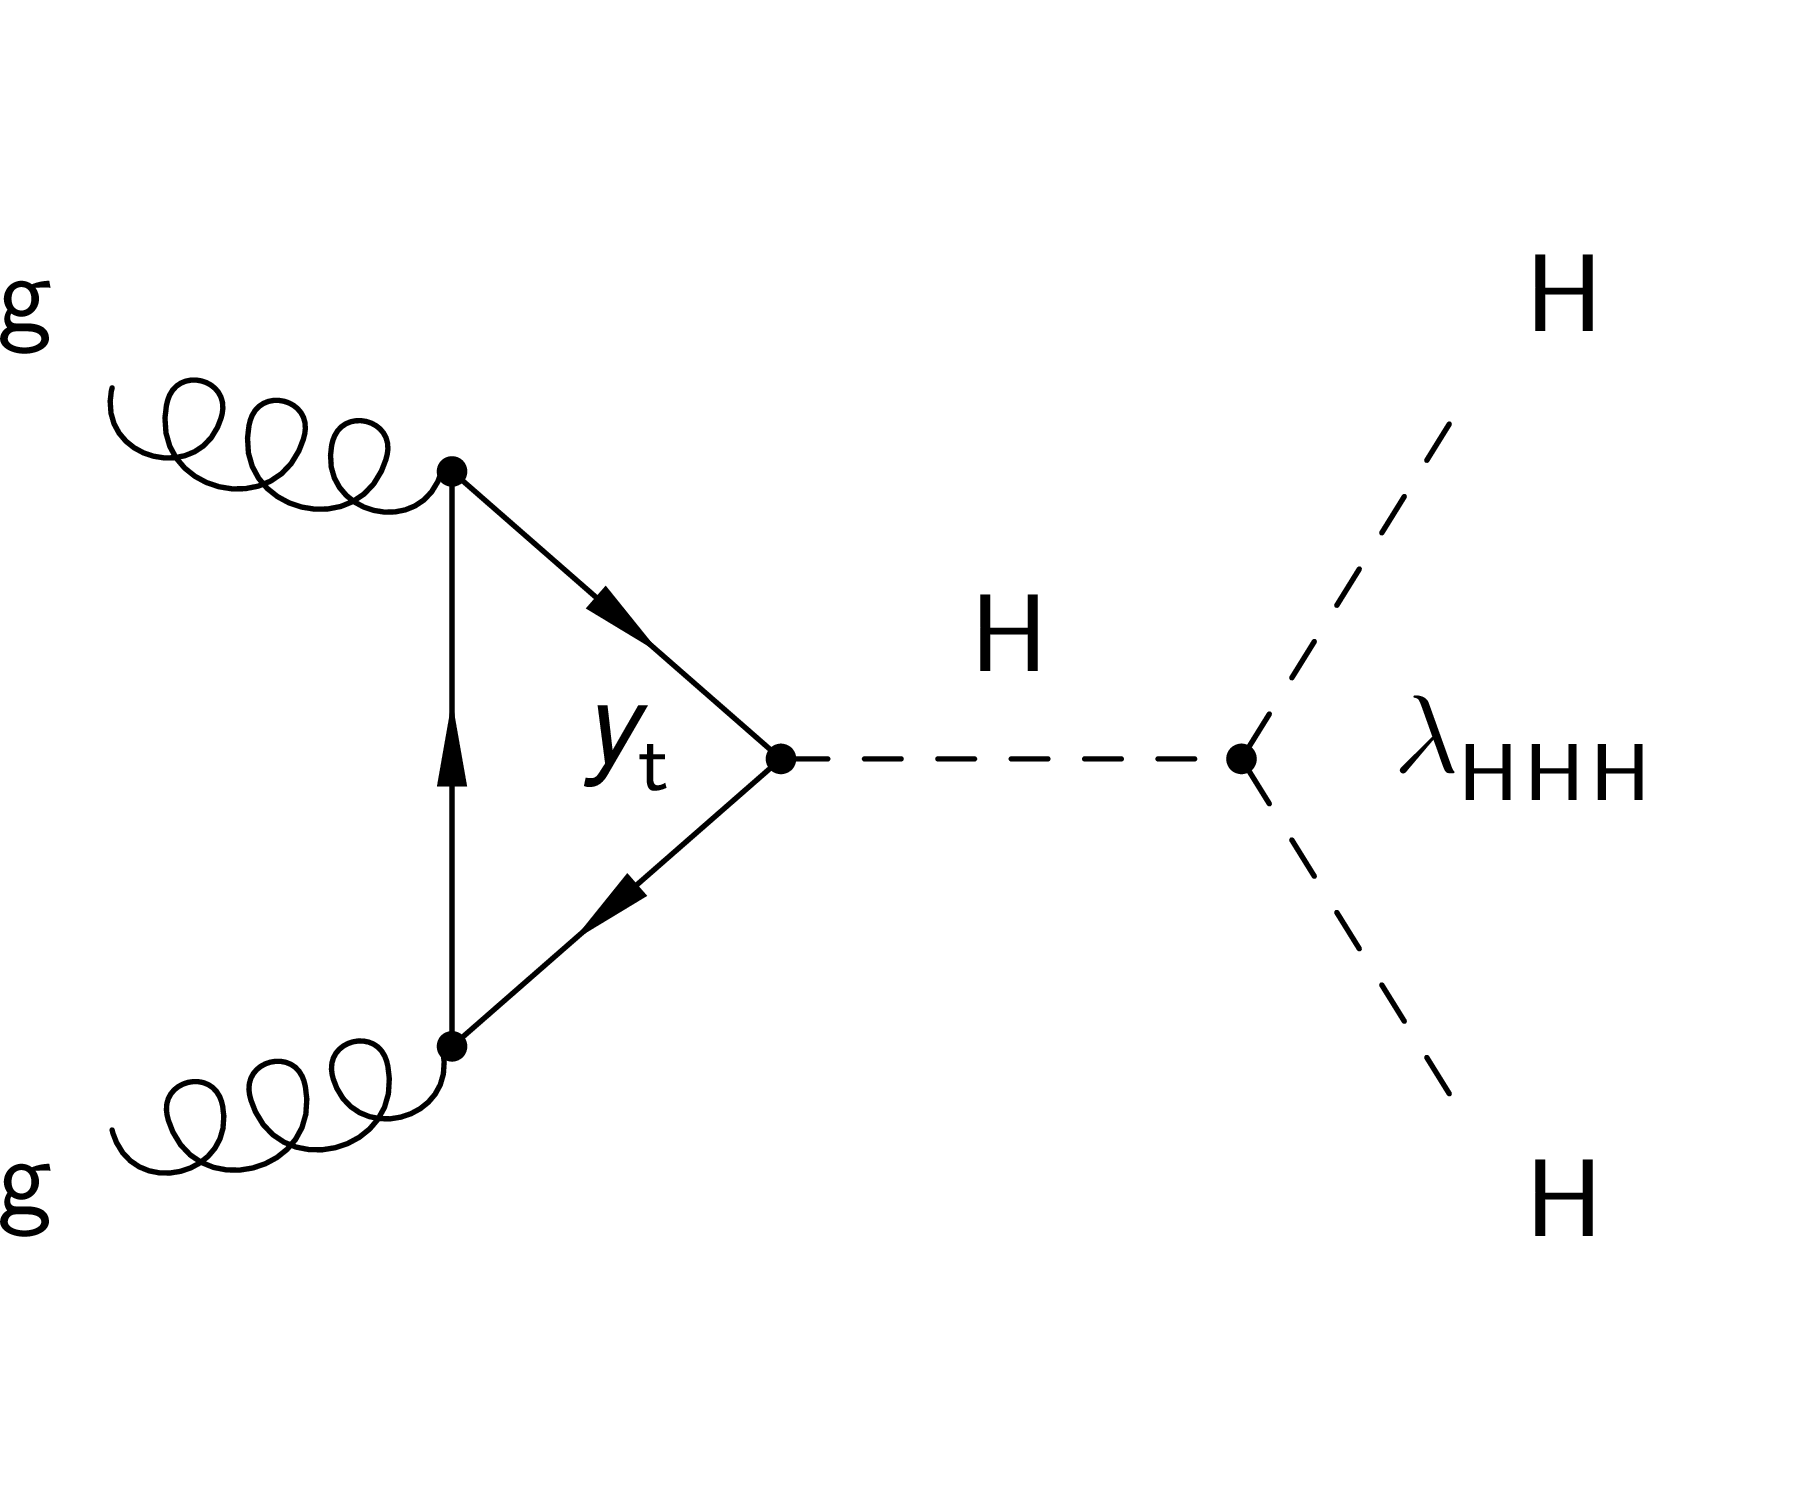
Figure 1:
Representative Feynman diagrams, referred to as the triangle and the box respectively, that contribute to the ggHH production at the leading order in the SM. |
png pdf |
Figure 1-a:
Representative Feynman diagrams, referred to as the triangle and the box respectively, that contribute to the ggHH production at the leading order in the SM. |

png pdf |
Figure 1-b:
Representative Feynman diagrams, referred to as the triangle and the box respectively, that contribute to the ggHH production at the leading order in the SM. |
png pdf |
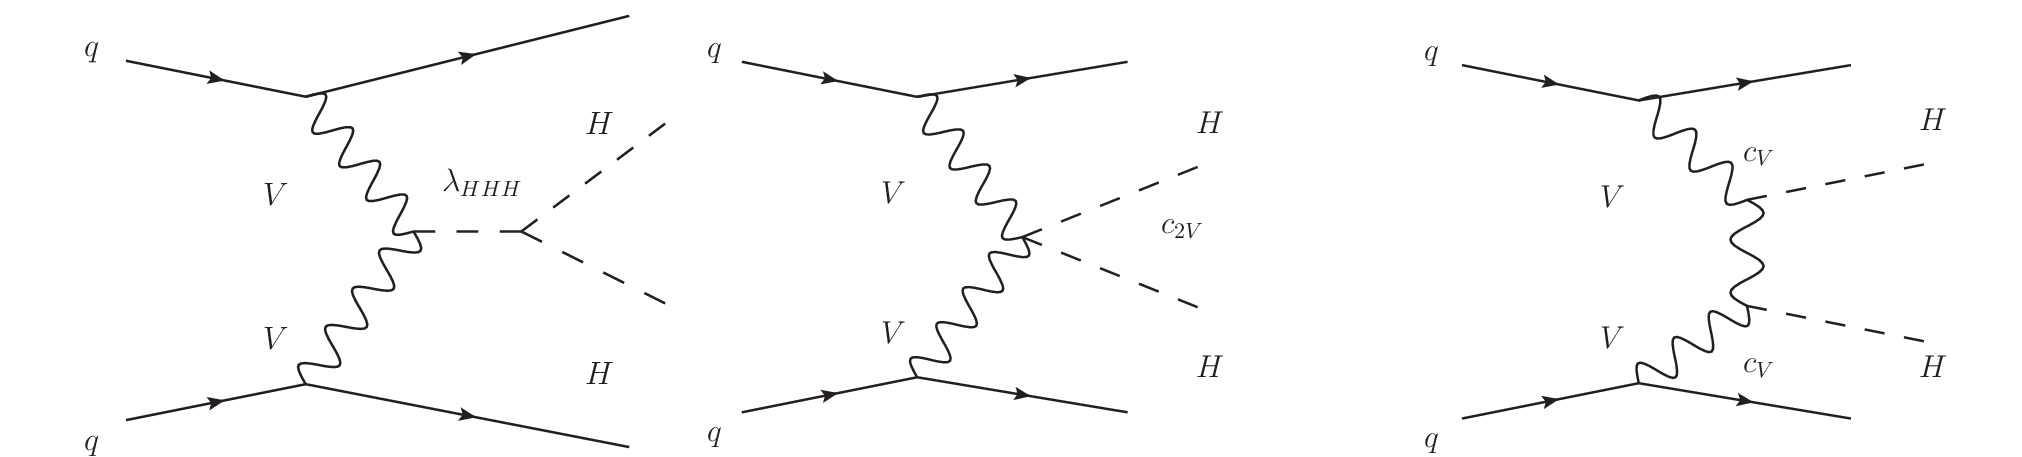
Figure 2:
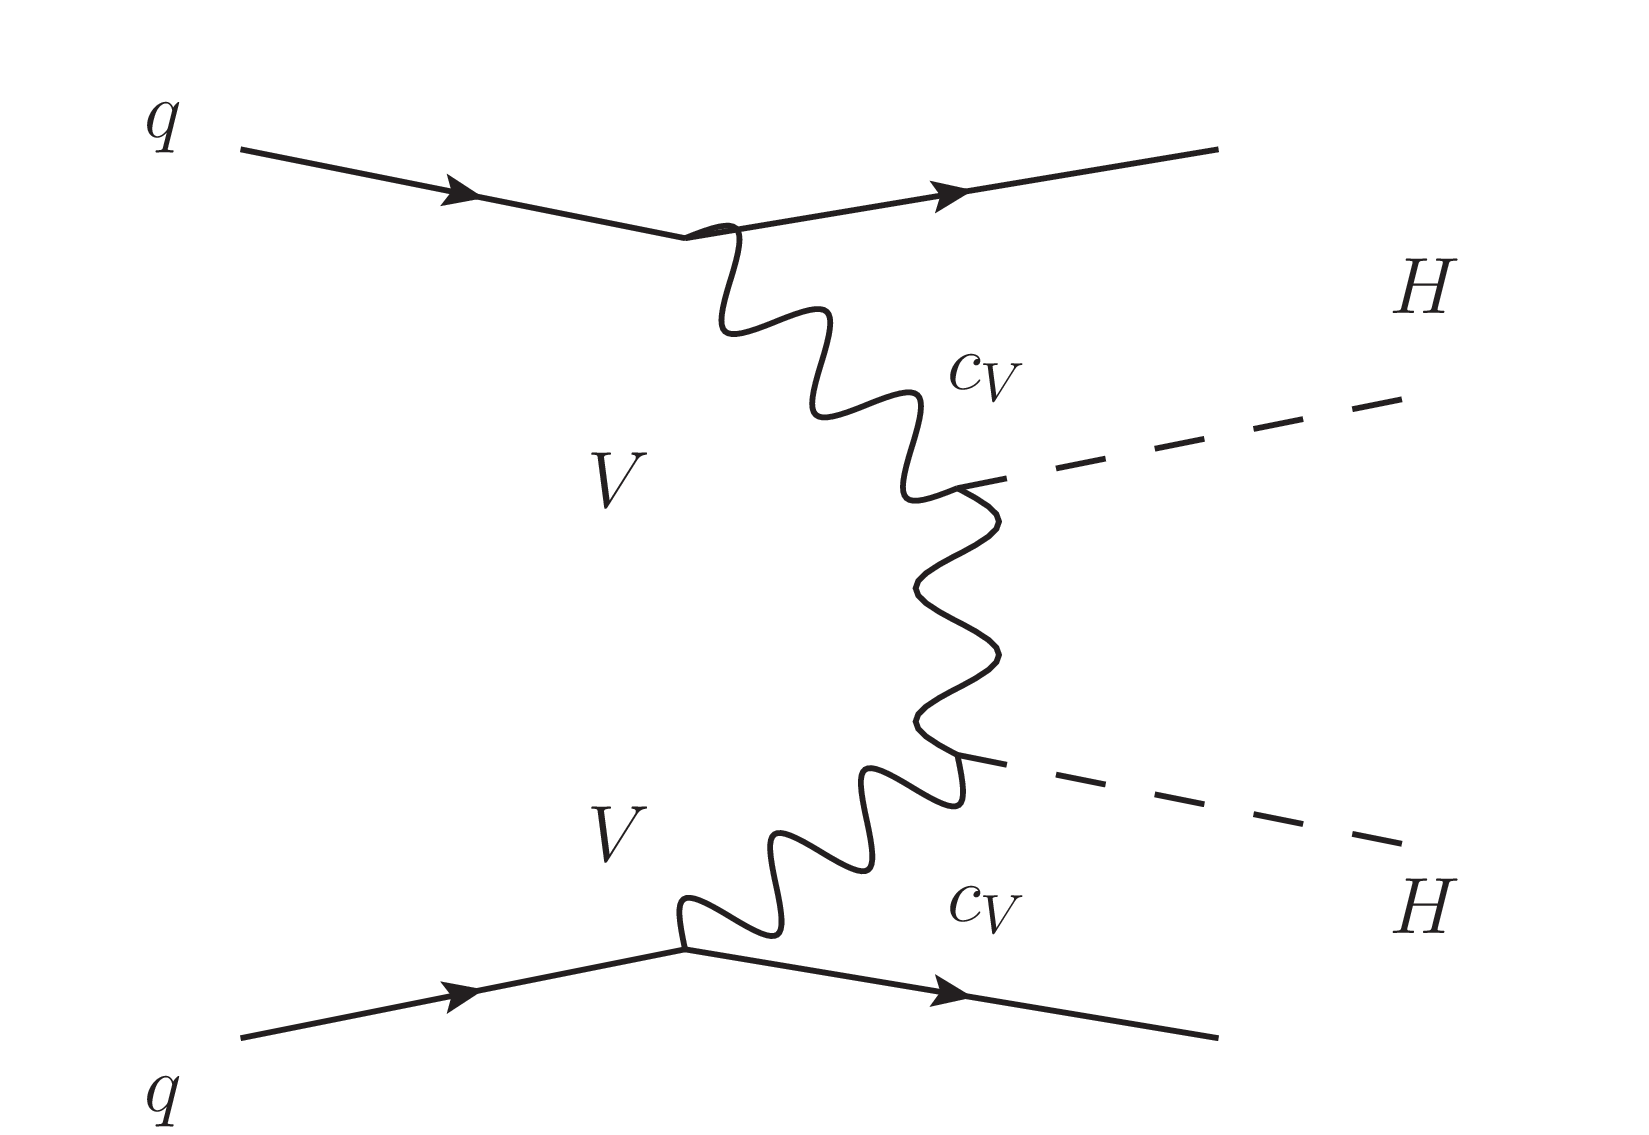
Representative Feynman diagrams for the production of Higgs boson pairs via VBF processes at the leading order. The left-most diagram involves the HHH vertex ($\lambda $), the middle one involves HHVV vertex ($C_{2V}$) while the right-most features neither of those couplings, but includes two HVV vertices ($C_{V}$). |
png pdf |
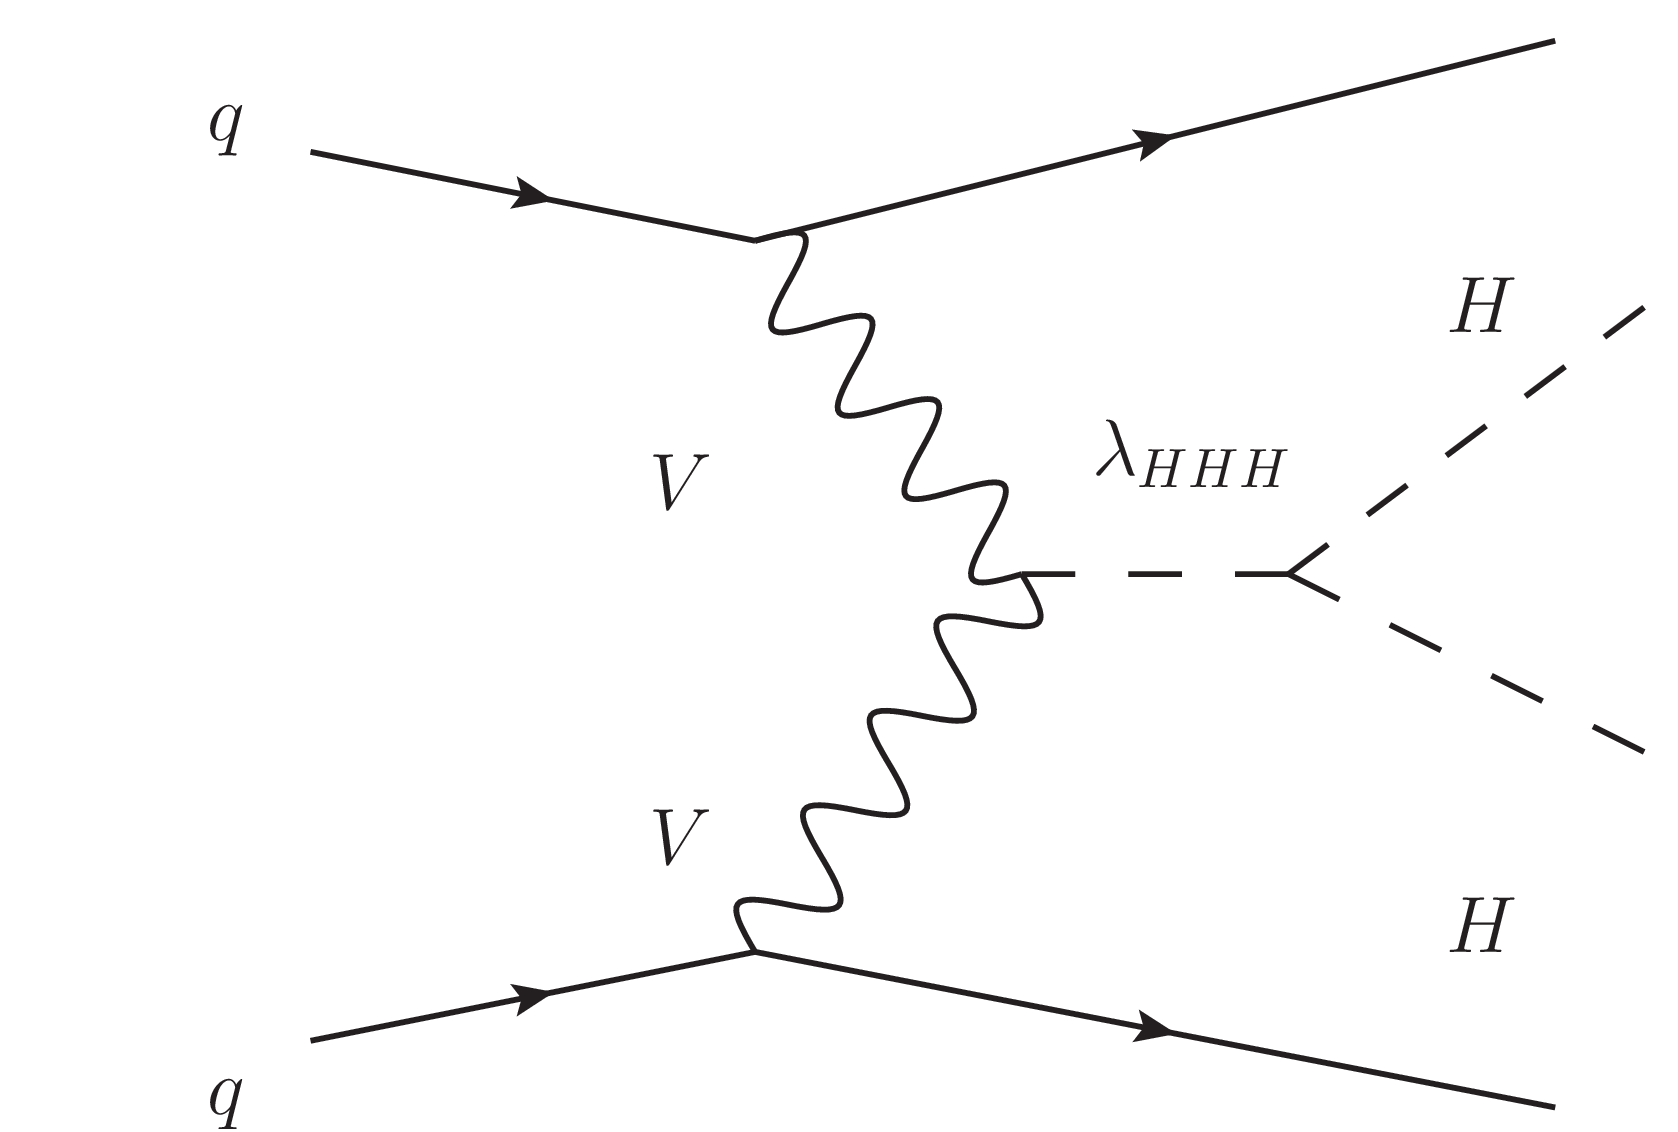
Figure 2-a:
Representative Feynman diagrams for the production of Higgs boson pairs via VBF processes at the leading order. The left-most diagram involves the HHH vertex ($\lambda $), the middle one involves HHVV vertex ($C_{2V}$) while the right-most features neither of those couplings, but includes two HVV vertices ($C_{V}$). |
png pdf |
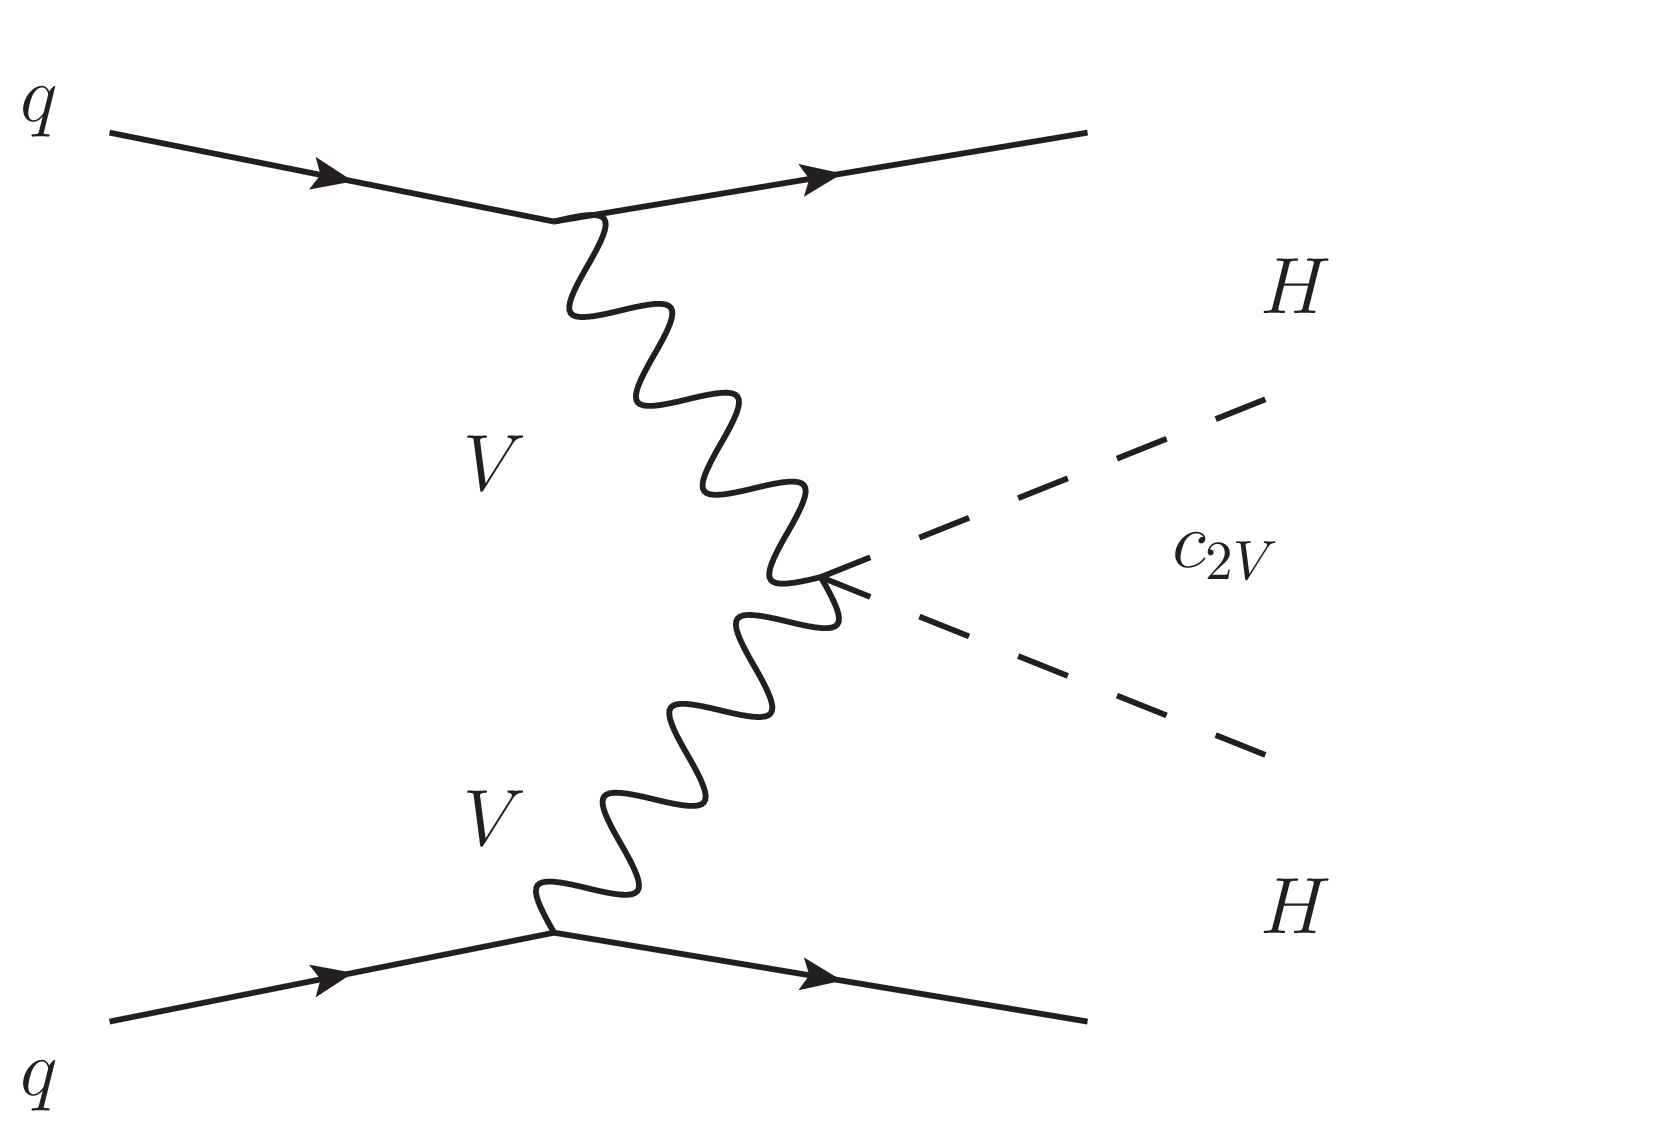
Figure 2-b:
Representative Feynman diagrams for the production of Higgs boson pairs via VBF processes at the leading order. The left-most diagram involves the HHH vertex ($\lambda $), the middle one involves HHVV vertex ($C_{2V}$) while the right-most features neither of those couplings, but includes two HVV vertices ($C_{V}$). |
png pdf |
Figure 2-c:
Representative Feynman diagrams for the production of Higgs boson pairs via VBF processes at the leading order. The left-most diagram involves the HHH vertex ($\lambda $), the middle one involves HHVV vertex ($C_{2V}$) while the right-most features neither of those couplings, but includes two HVV vertices ($C_{V}$). |

png pdf |
Figure 3:
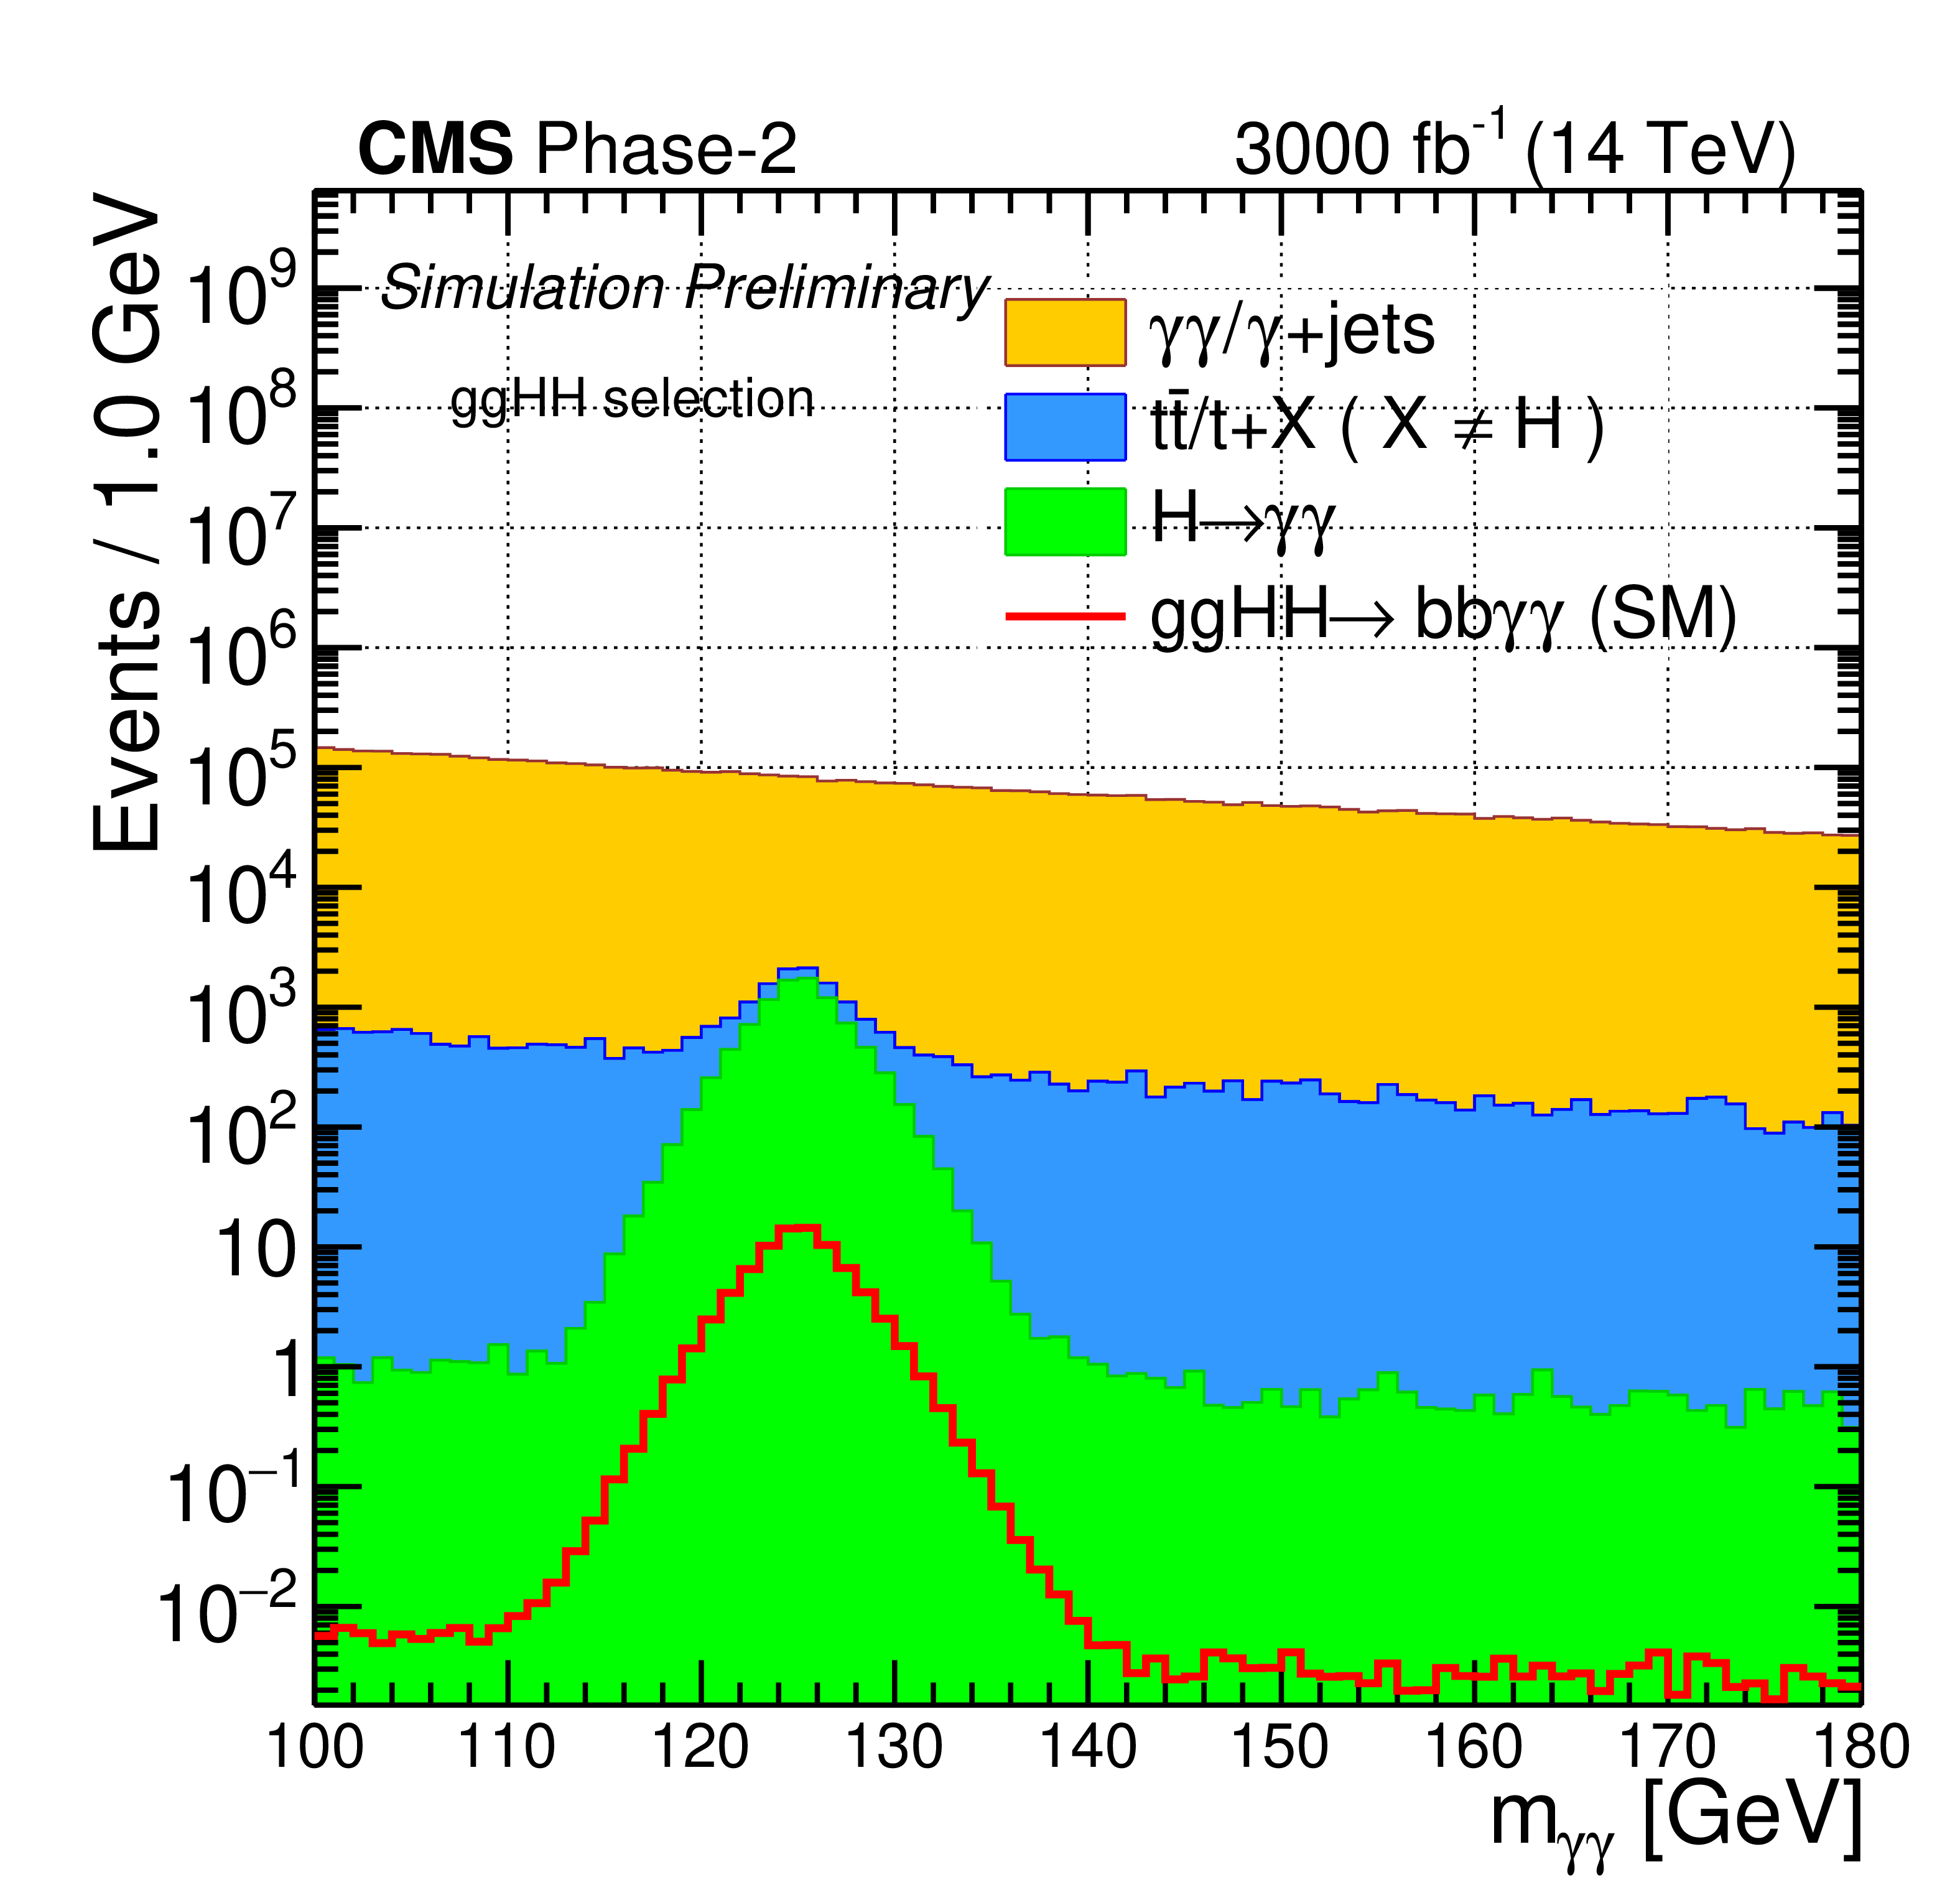
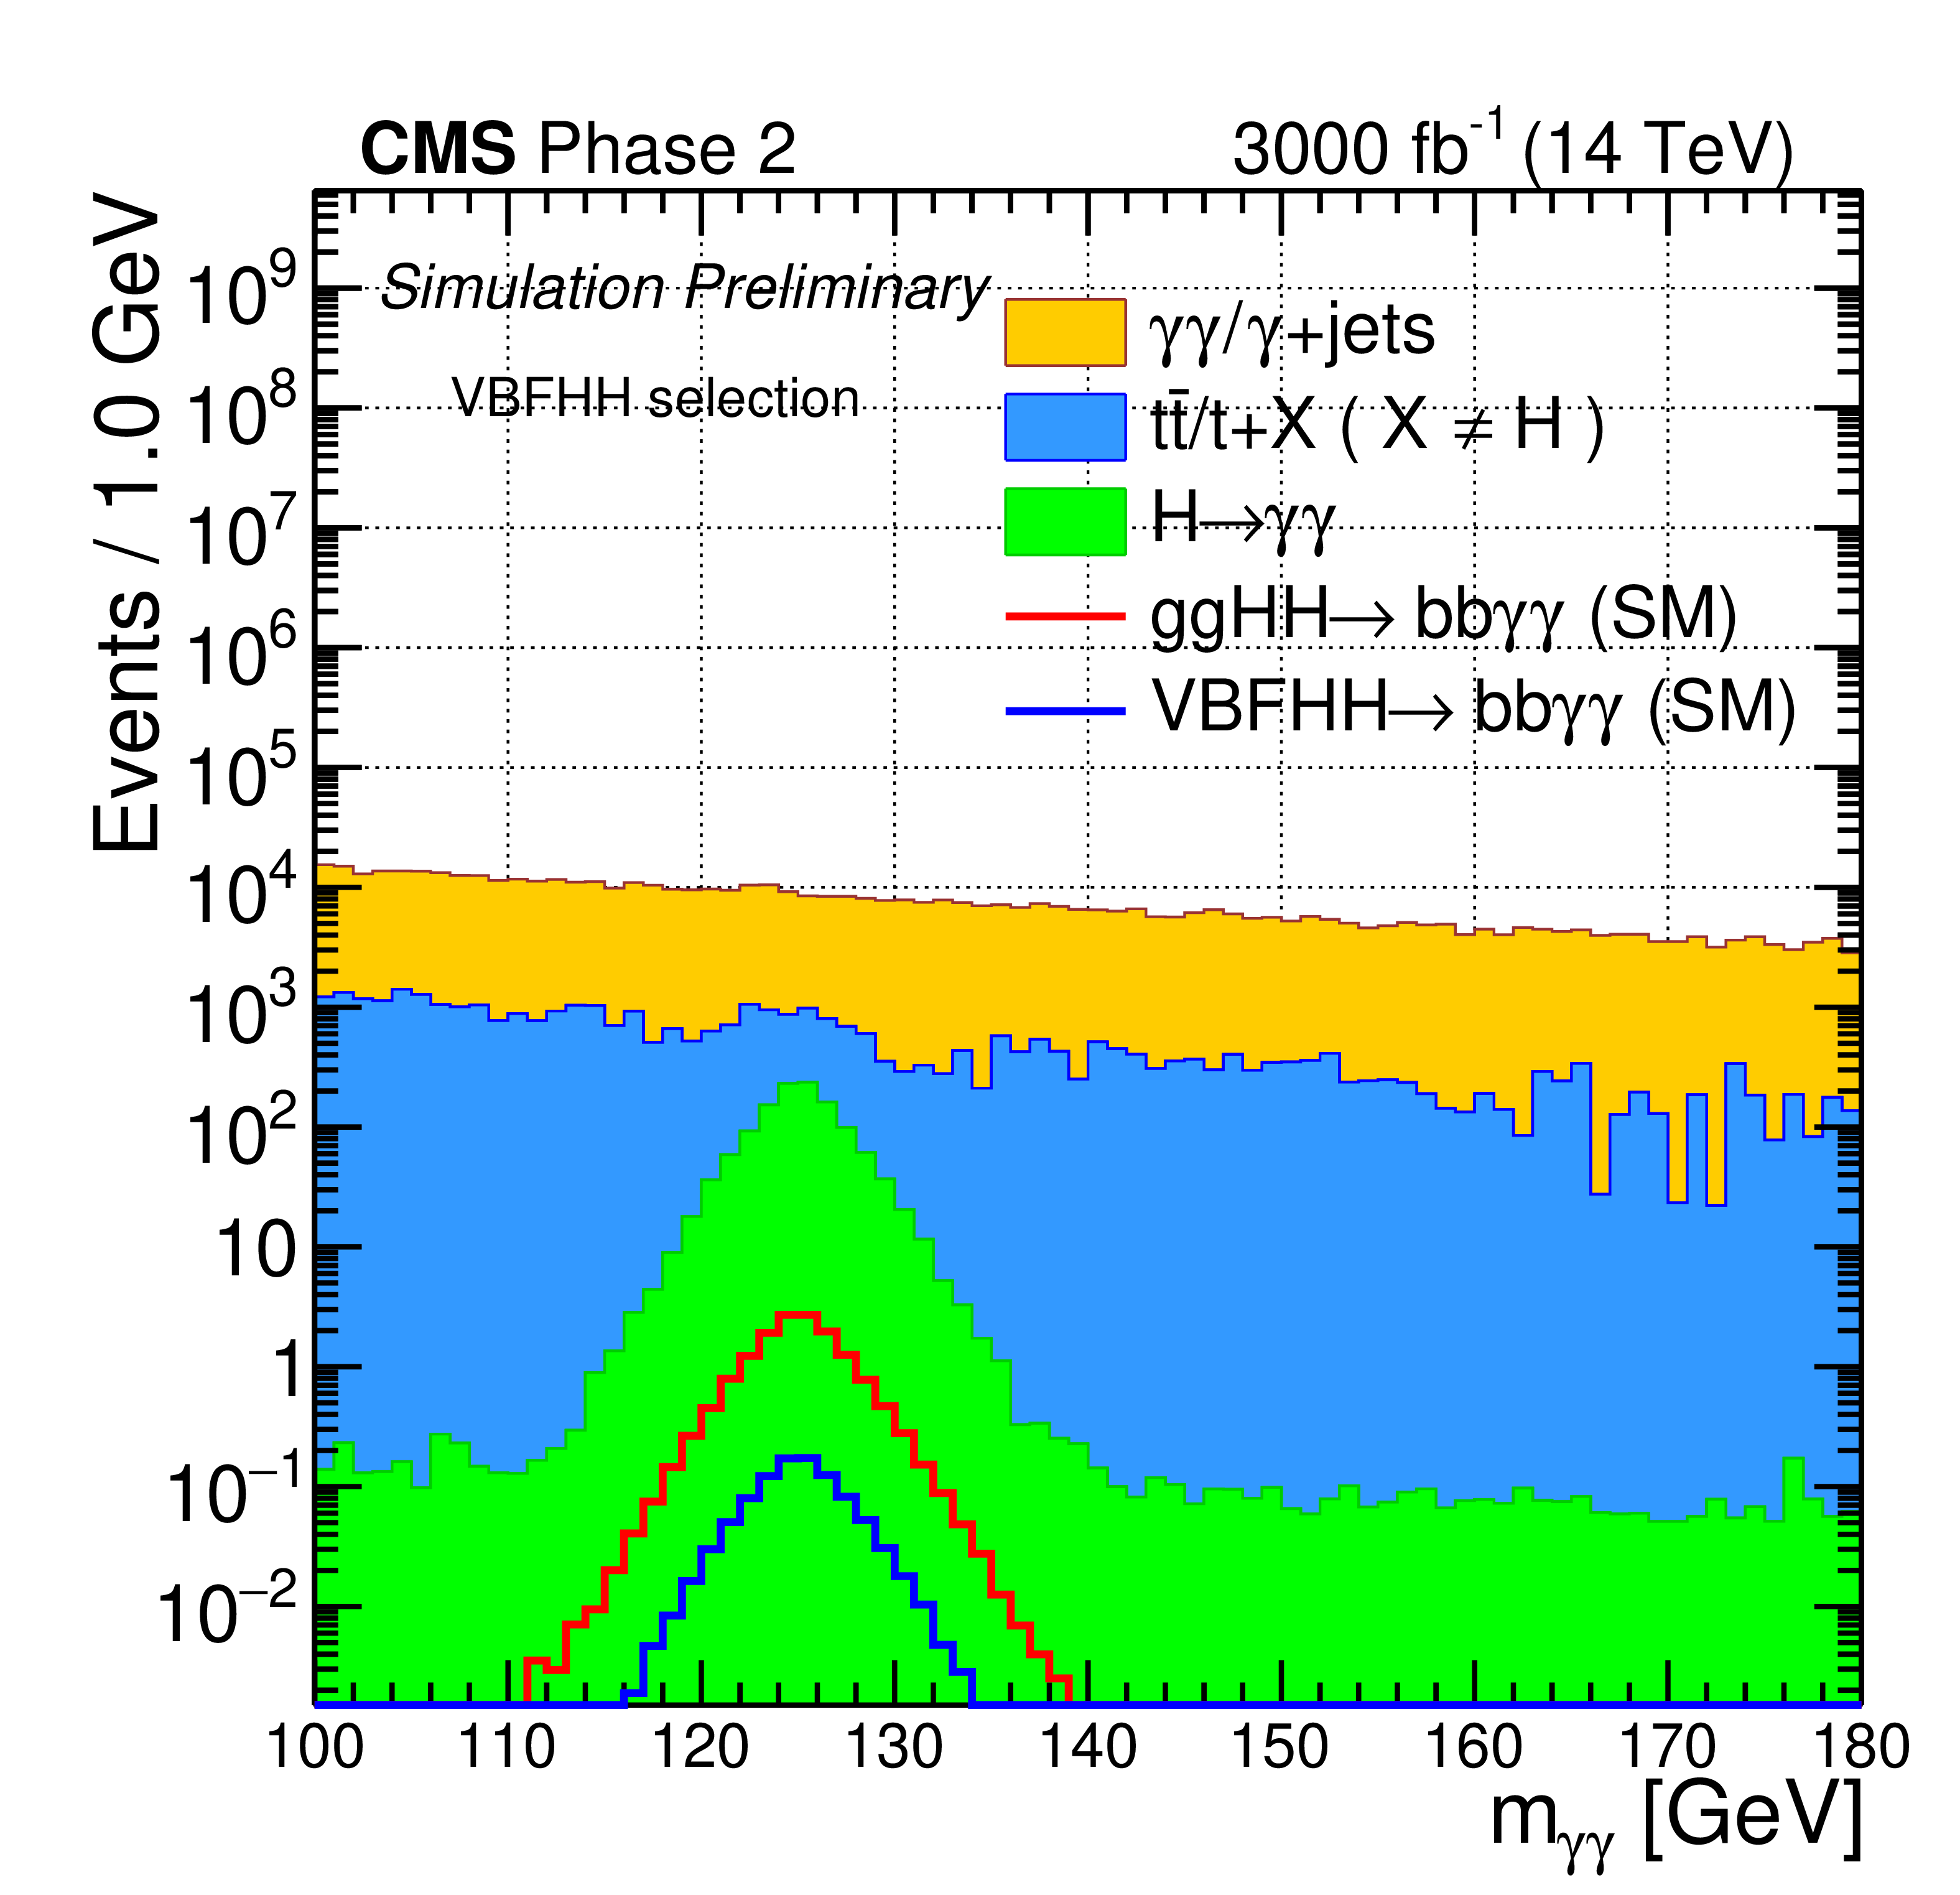
Distributions of the $ {\mathrm m_{\gamma \gamma}} $ variable for the ggHH- (left) and VBFHH- (right) selected events corresponding to $\mathcal {L} =$ 3000 fb$^{-1}$; ggHH signal (in red), VBFHH signal (in blue) are overlaid on different background processes (filled stacks in different colours). |
png pdf |
Figure 3-a:
Distributions of the $ {\mathrm m_{\gamma \gamma}} $ variable for the ggHH- (left) and VBFHH- (right) selected events corresponding to $\mathcal {L} =$ 3000 fb$^{-1}$; ggHH signal (in red), VBFHH signal (in blue) are overlaid on different background processes (filled stacks in different colours). |
png pdf |
Figure 3-b:
Distributions of the $ {\mathrm m_{\gamma \gamma}} $ variable for the ggHH- (left) and VBFHH- (right) selected events corresponding to $\mathcal {L} =$ 3000 fb$^{-1}$; ggHH signal (in red), VBFHH signal (in blue) are overlaid on different background processes (filled stacks in different colours). |

png pdf |
Figure 4:
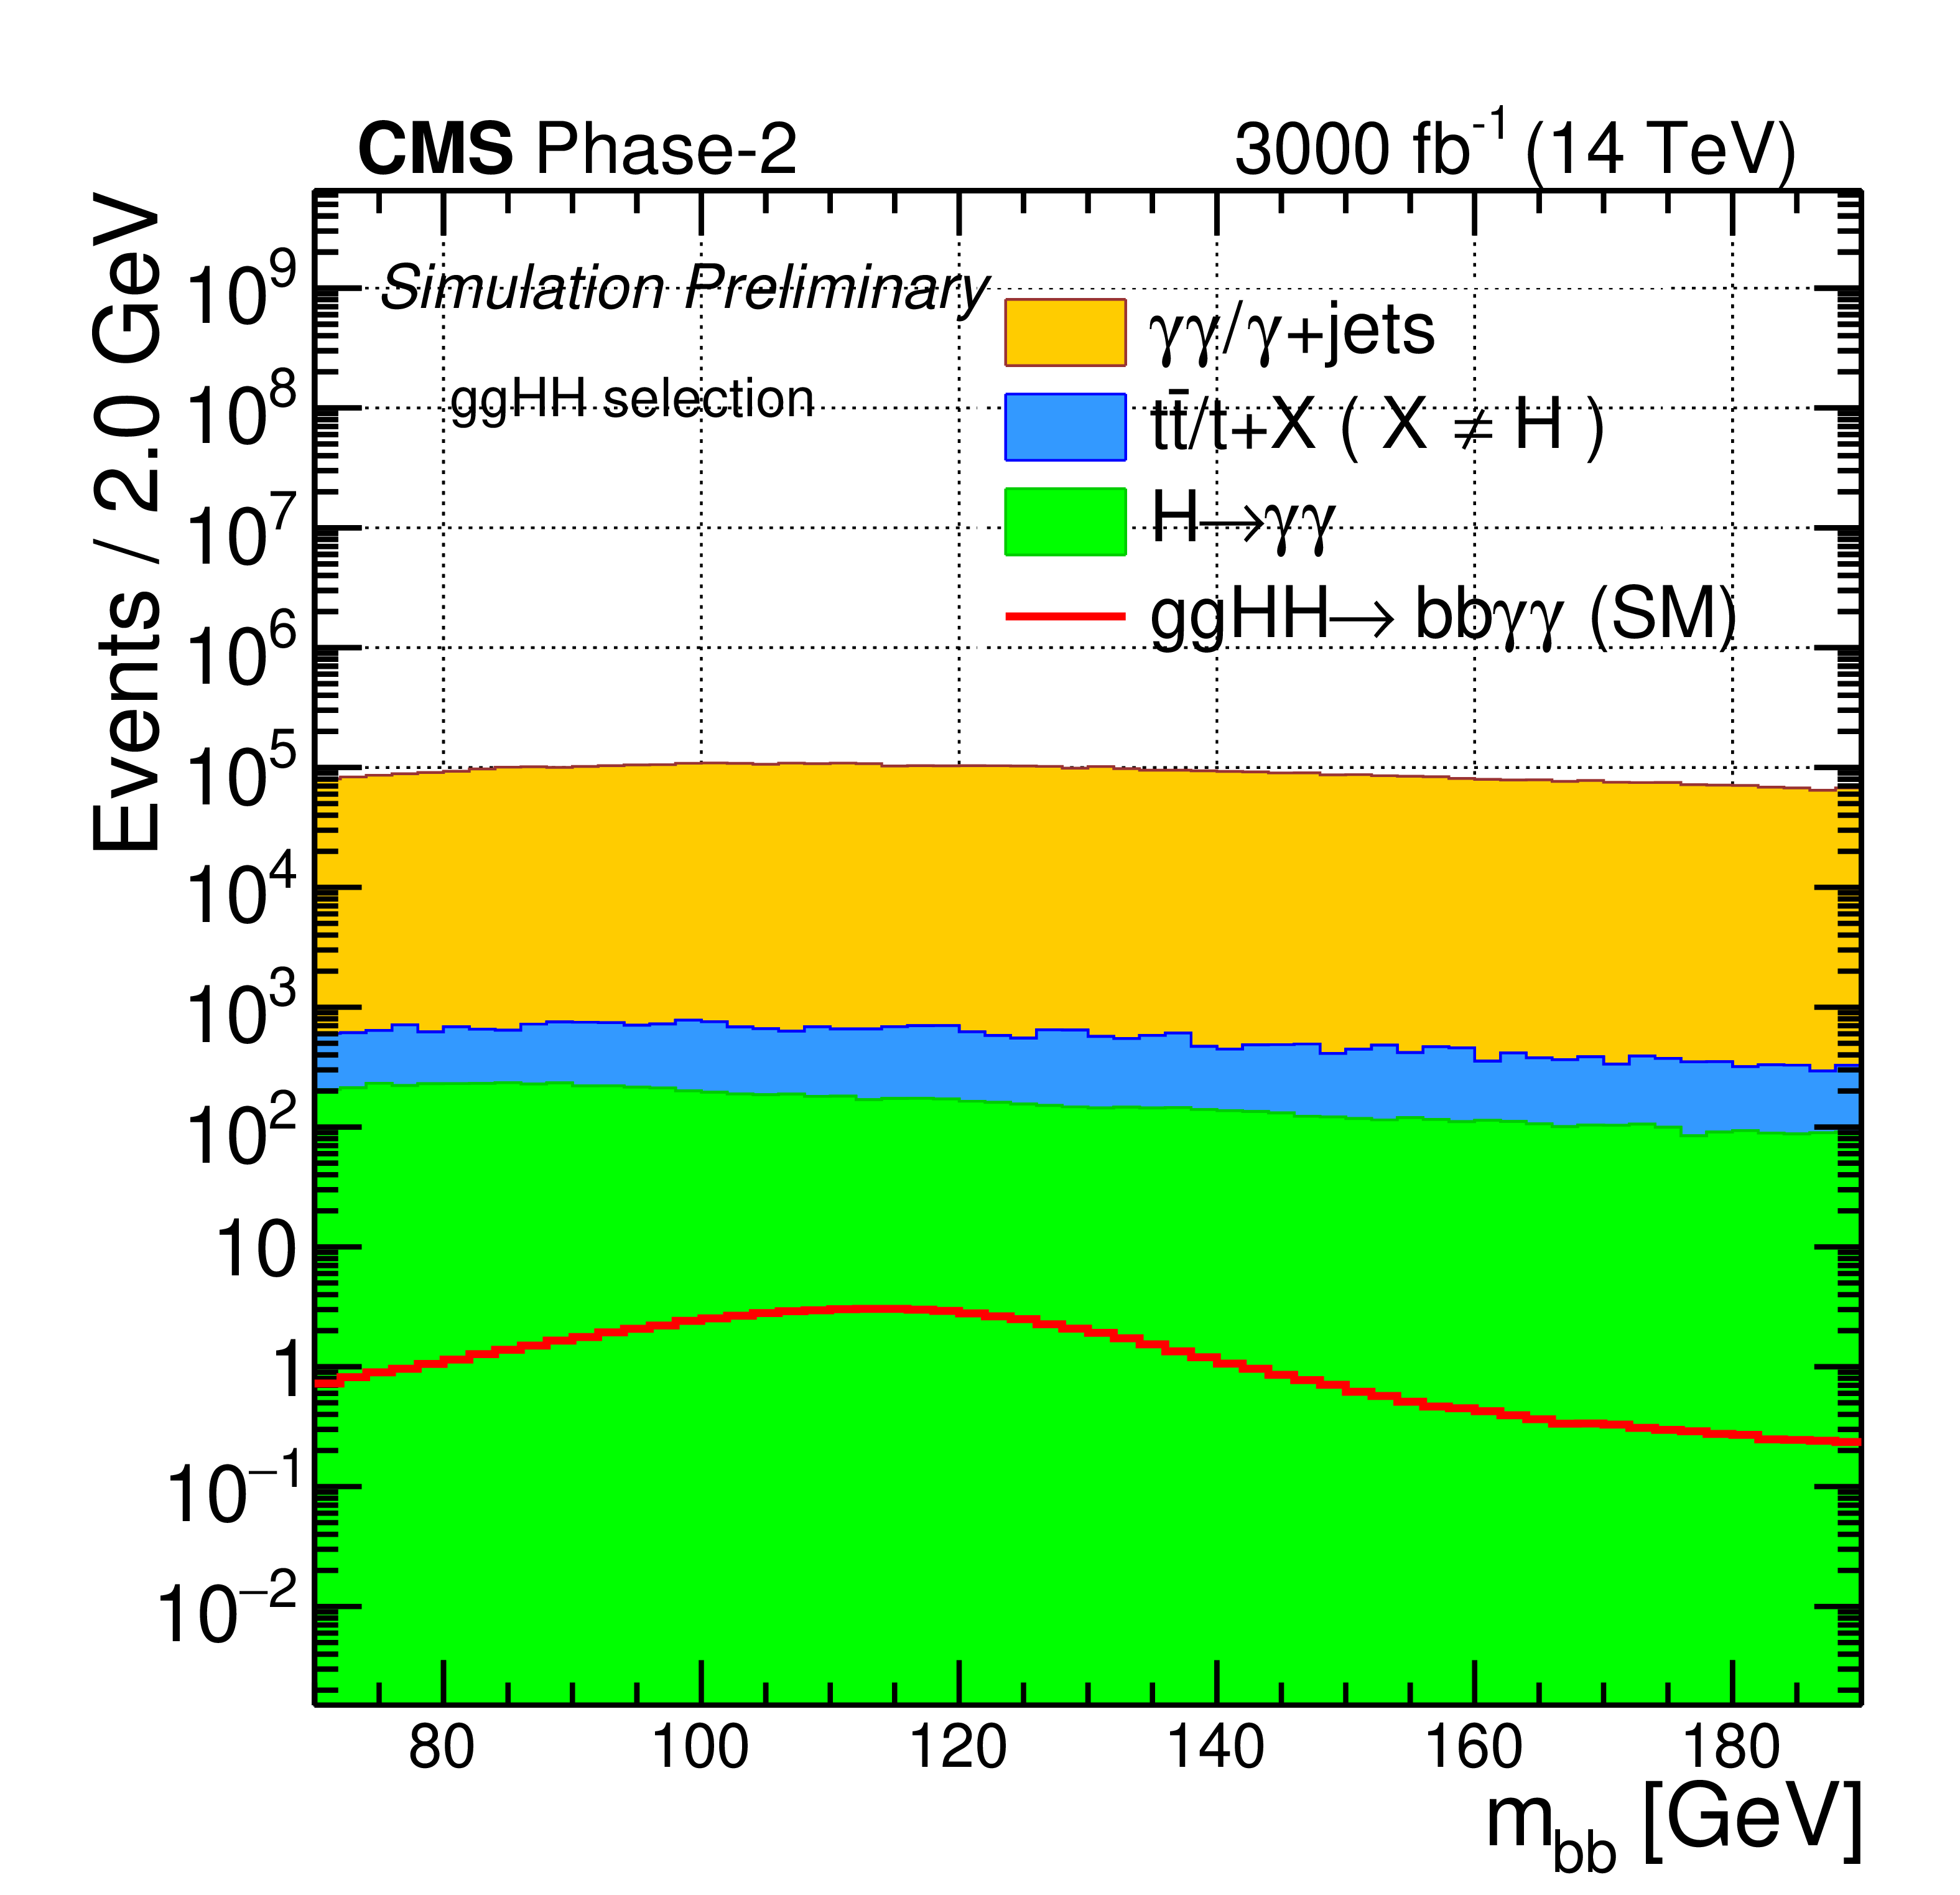
Distributions of the $ {\rm m_{\rm bb}} $ variable for the ggHH- (left) and VBFHH- (right) selected events corresponding to $\mathcal {L} =$ 3000 fb$^{-1}$; ggHH signal (in red), VBFHH signal (in blue) are overlaid on different background processes (filled stacks in different colours). |
png pdf |
Figure 4-a:
Distributions of the $ {\rm m_{\rm bb}} $ variable for the ggHH- (left) and VBFHH- (right) selected events corresponding to $\mathcal {L} =$ 3000 fb$^{-1}$; ggHH signal (in red), VBFHH signal (in blue) are overlaid on different background processes (filled stacks in different colours). |

png pdf |
Figure 4-b:
Distributions of the $ {\rm m_{\rm bb}} $ variable for the ggHH- (left) and VBFHH- (right) selected events corresponding to $\mathcal {L} =$ 3000 fb$^{-1}$; ggHH signal (in red), VBFHH signal (in blue) are overlaid on different background processes (filled stacks in different colours). |

png pdf |
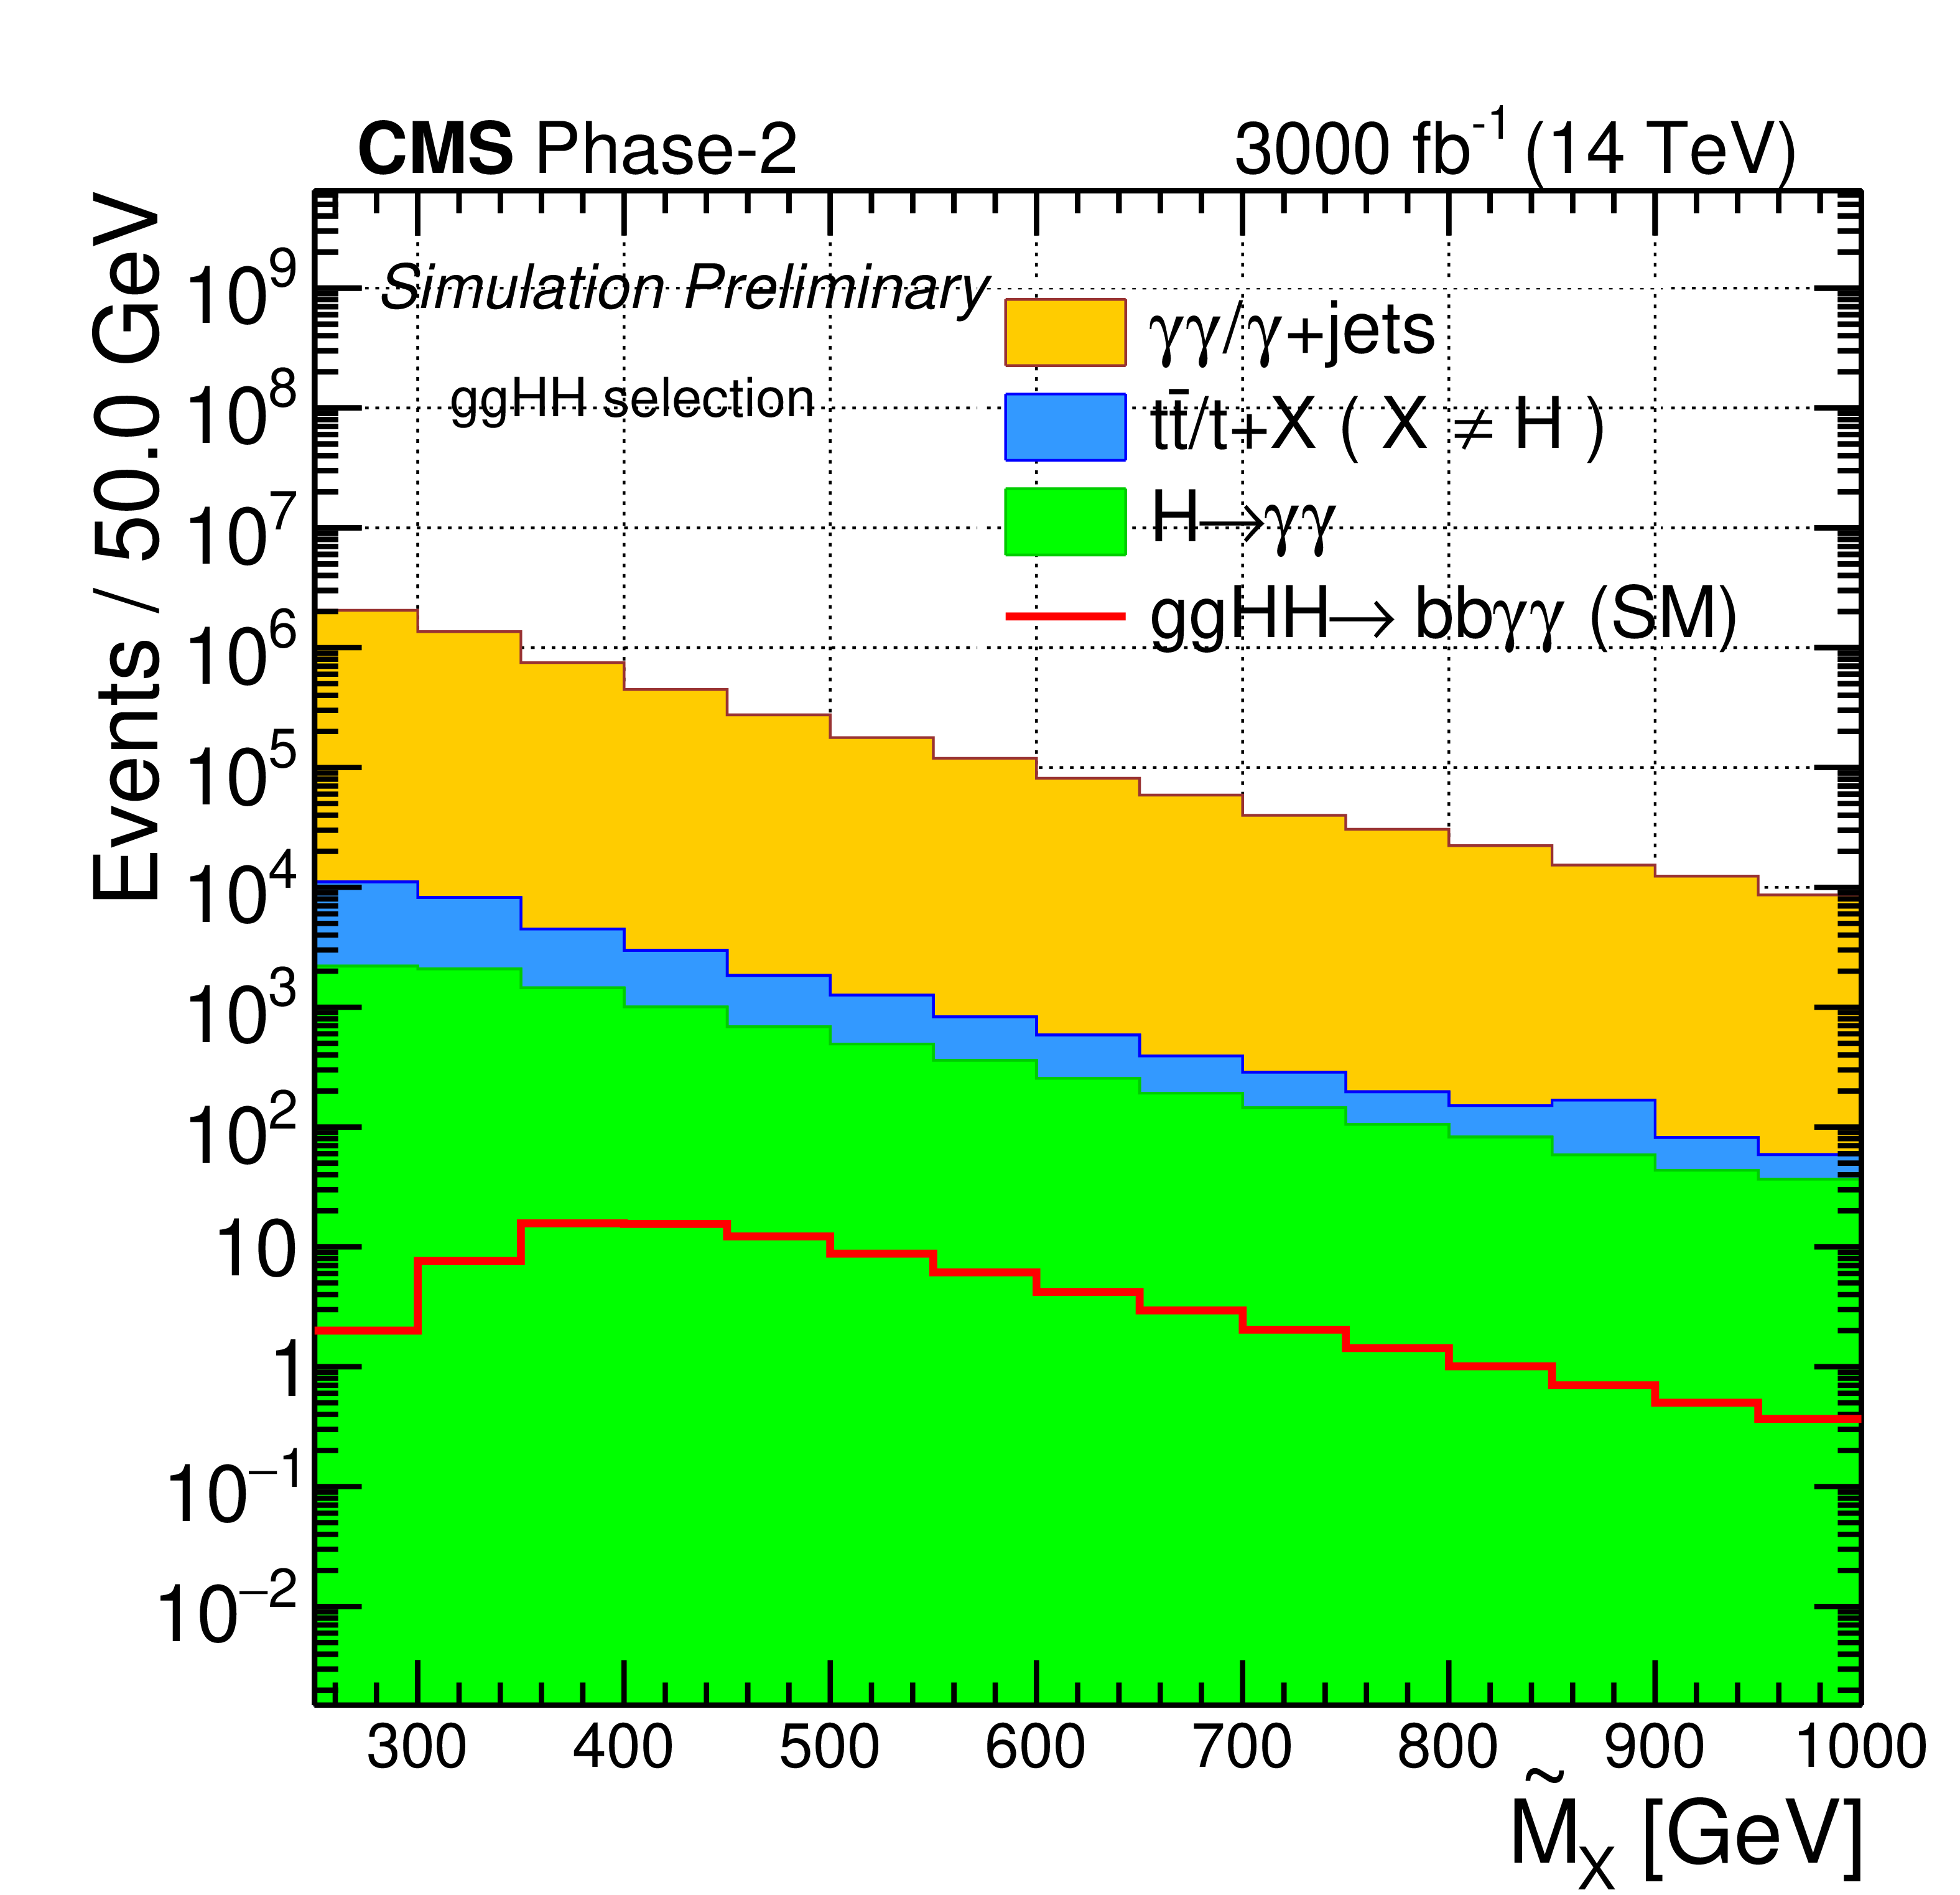
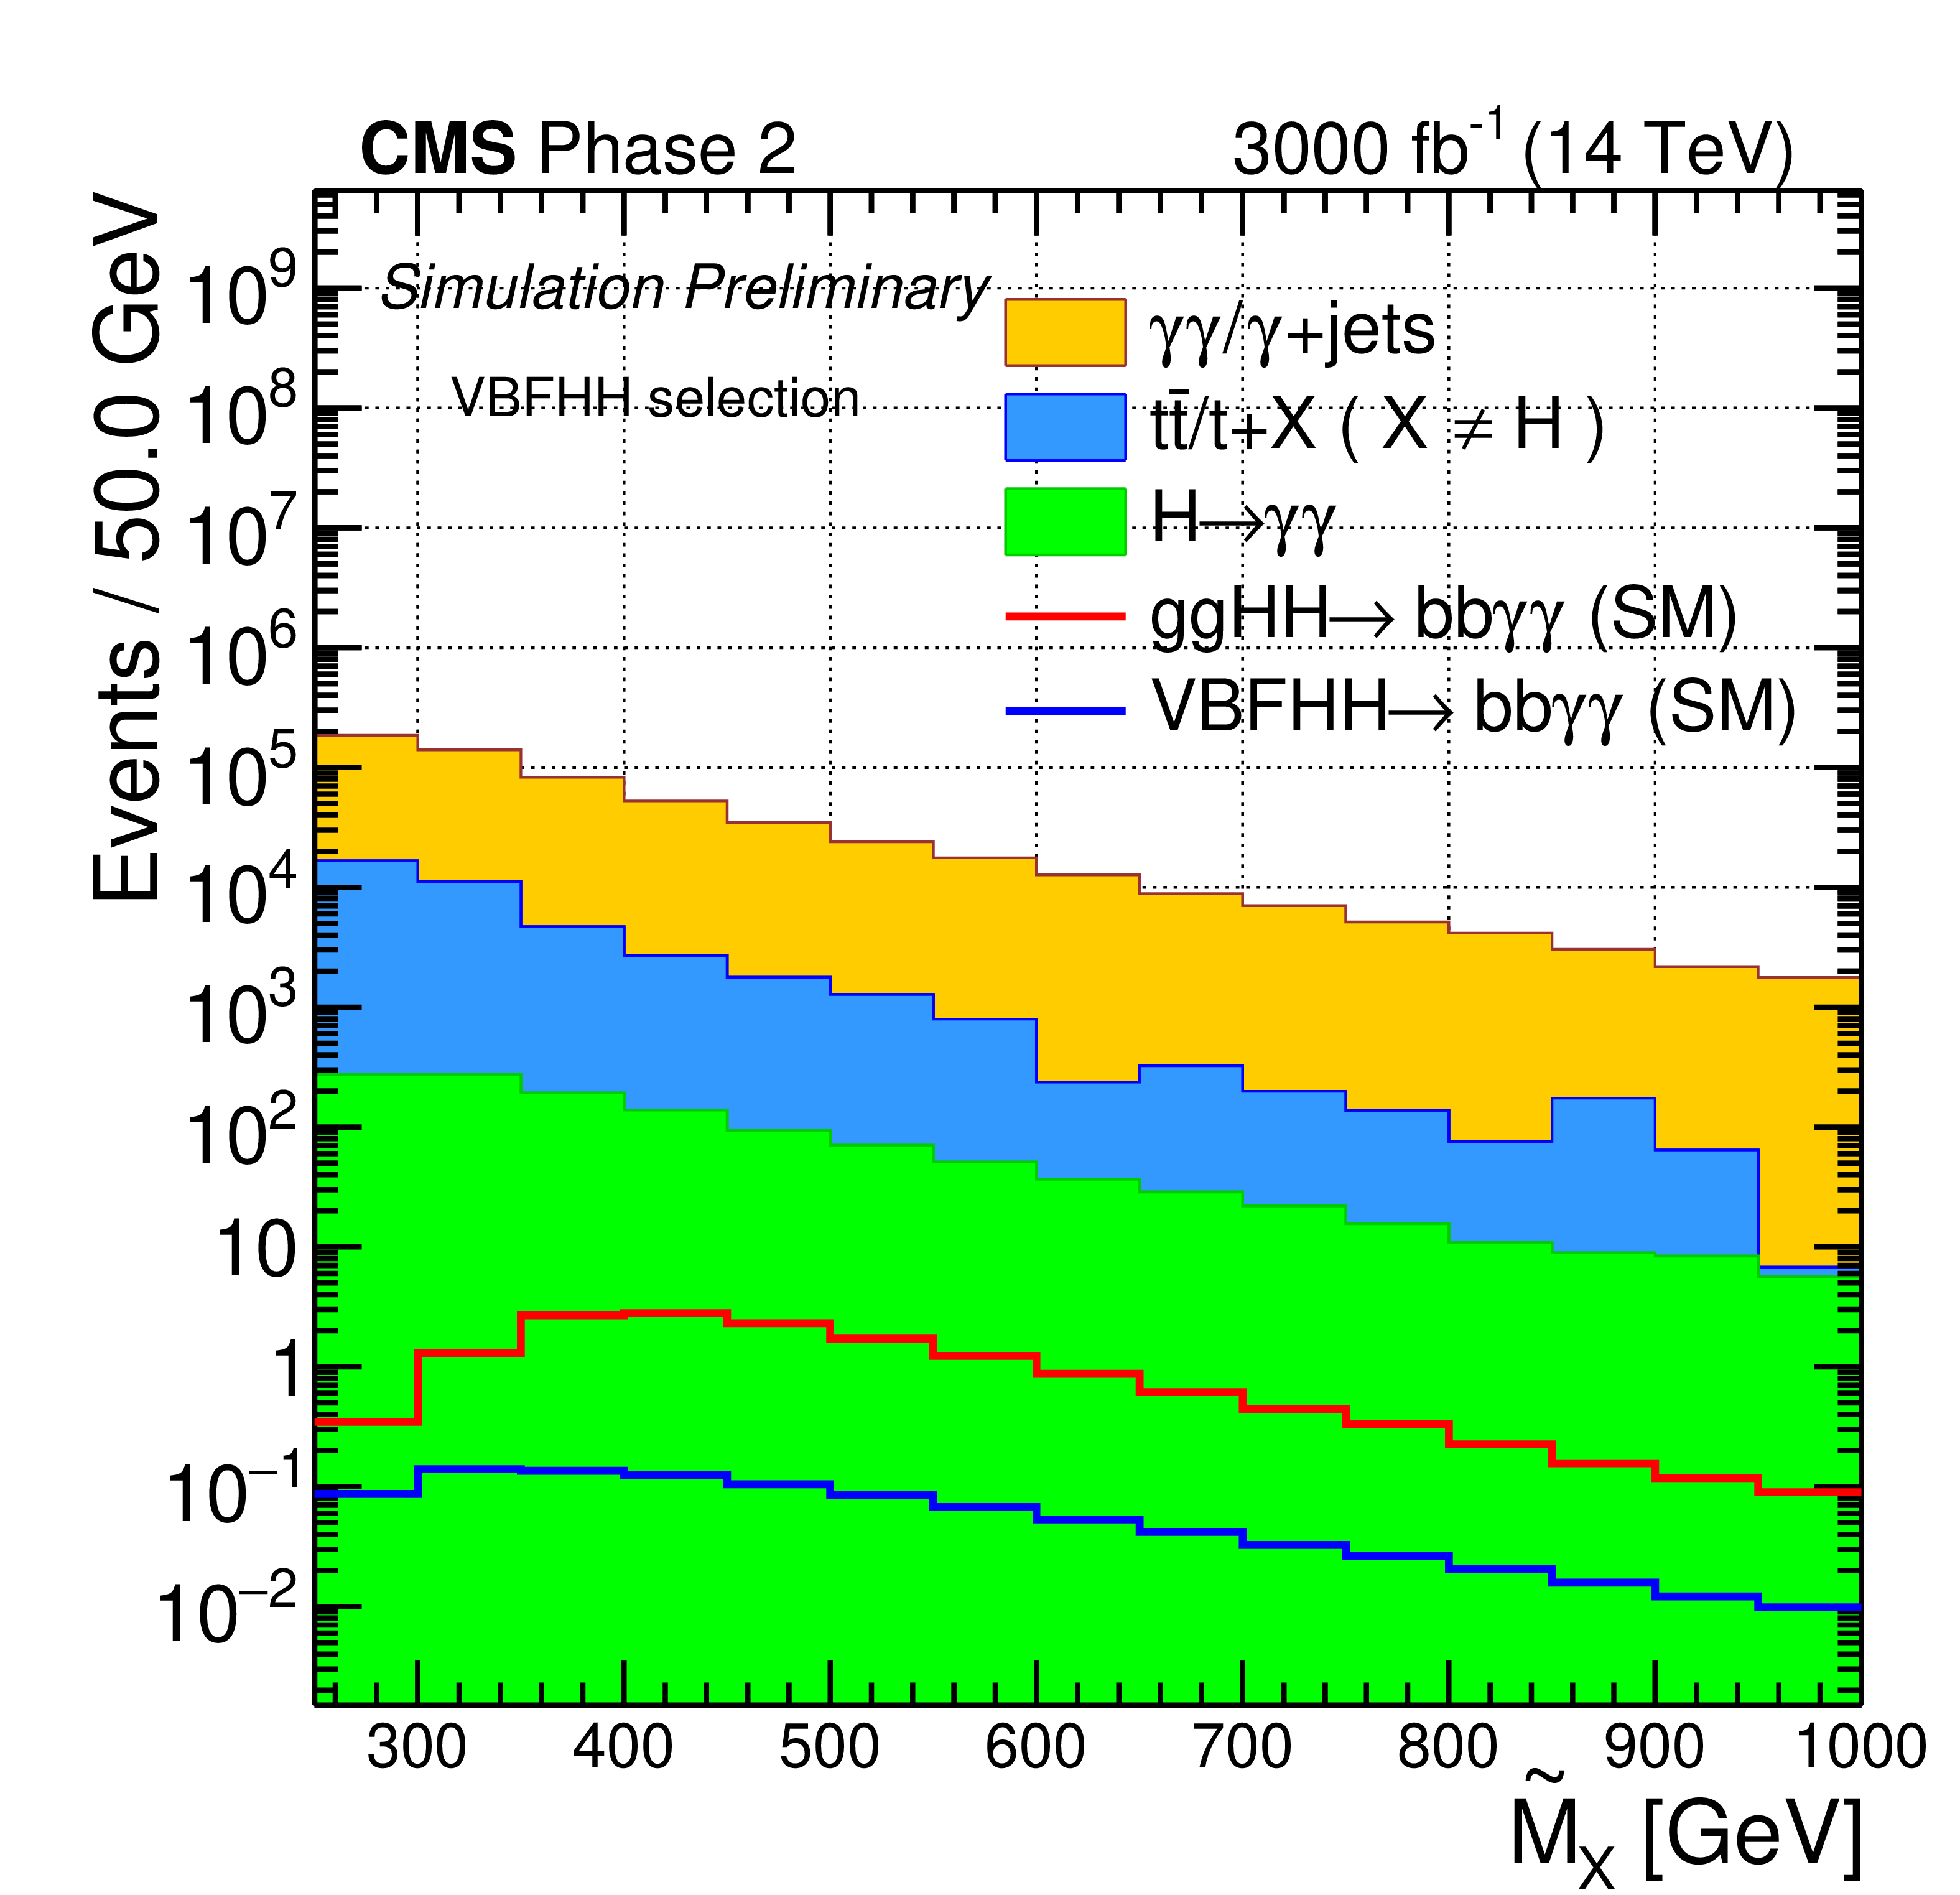
Figure 5:
Distributions of the $ {\rm \tilde{M}_X} $ variable for the ggHH- (left) and VBFHH- (right) selected events corresponding to $\mathcal {L} =$ 3000 fb$^{-1}$; ggHH signal (in red), VBFHH signal (in blue) are overlaid on different background processes (filled stacks in different colours). |
png pdf |
Figure 5-a:
Distributions of the $ {\rm \tilde{M}_X} $ variable for the ggHH- (left) and VBFHH- (right) selected events corresponding to $\mathcal {L} =$ 3000 fb$^{-1}$; ggHH signal (in red), VBFHH signal (in blue) are overlaid on different background processes (filled stacks in different colours). |
png pdf |
Figure 5-b:
Distributions of the $ {\rm \tilde{M}_X} $ variable for the ggHH- (left) and VBFHH- (right) selected events corresponding to $\mathcal {L} =$ 3000 fb$^{-1}$; ggHH signal (in red), VBFHH signal (in blue) are overlaid on different background processes (filled stacks in different colours). |
png pdf |
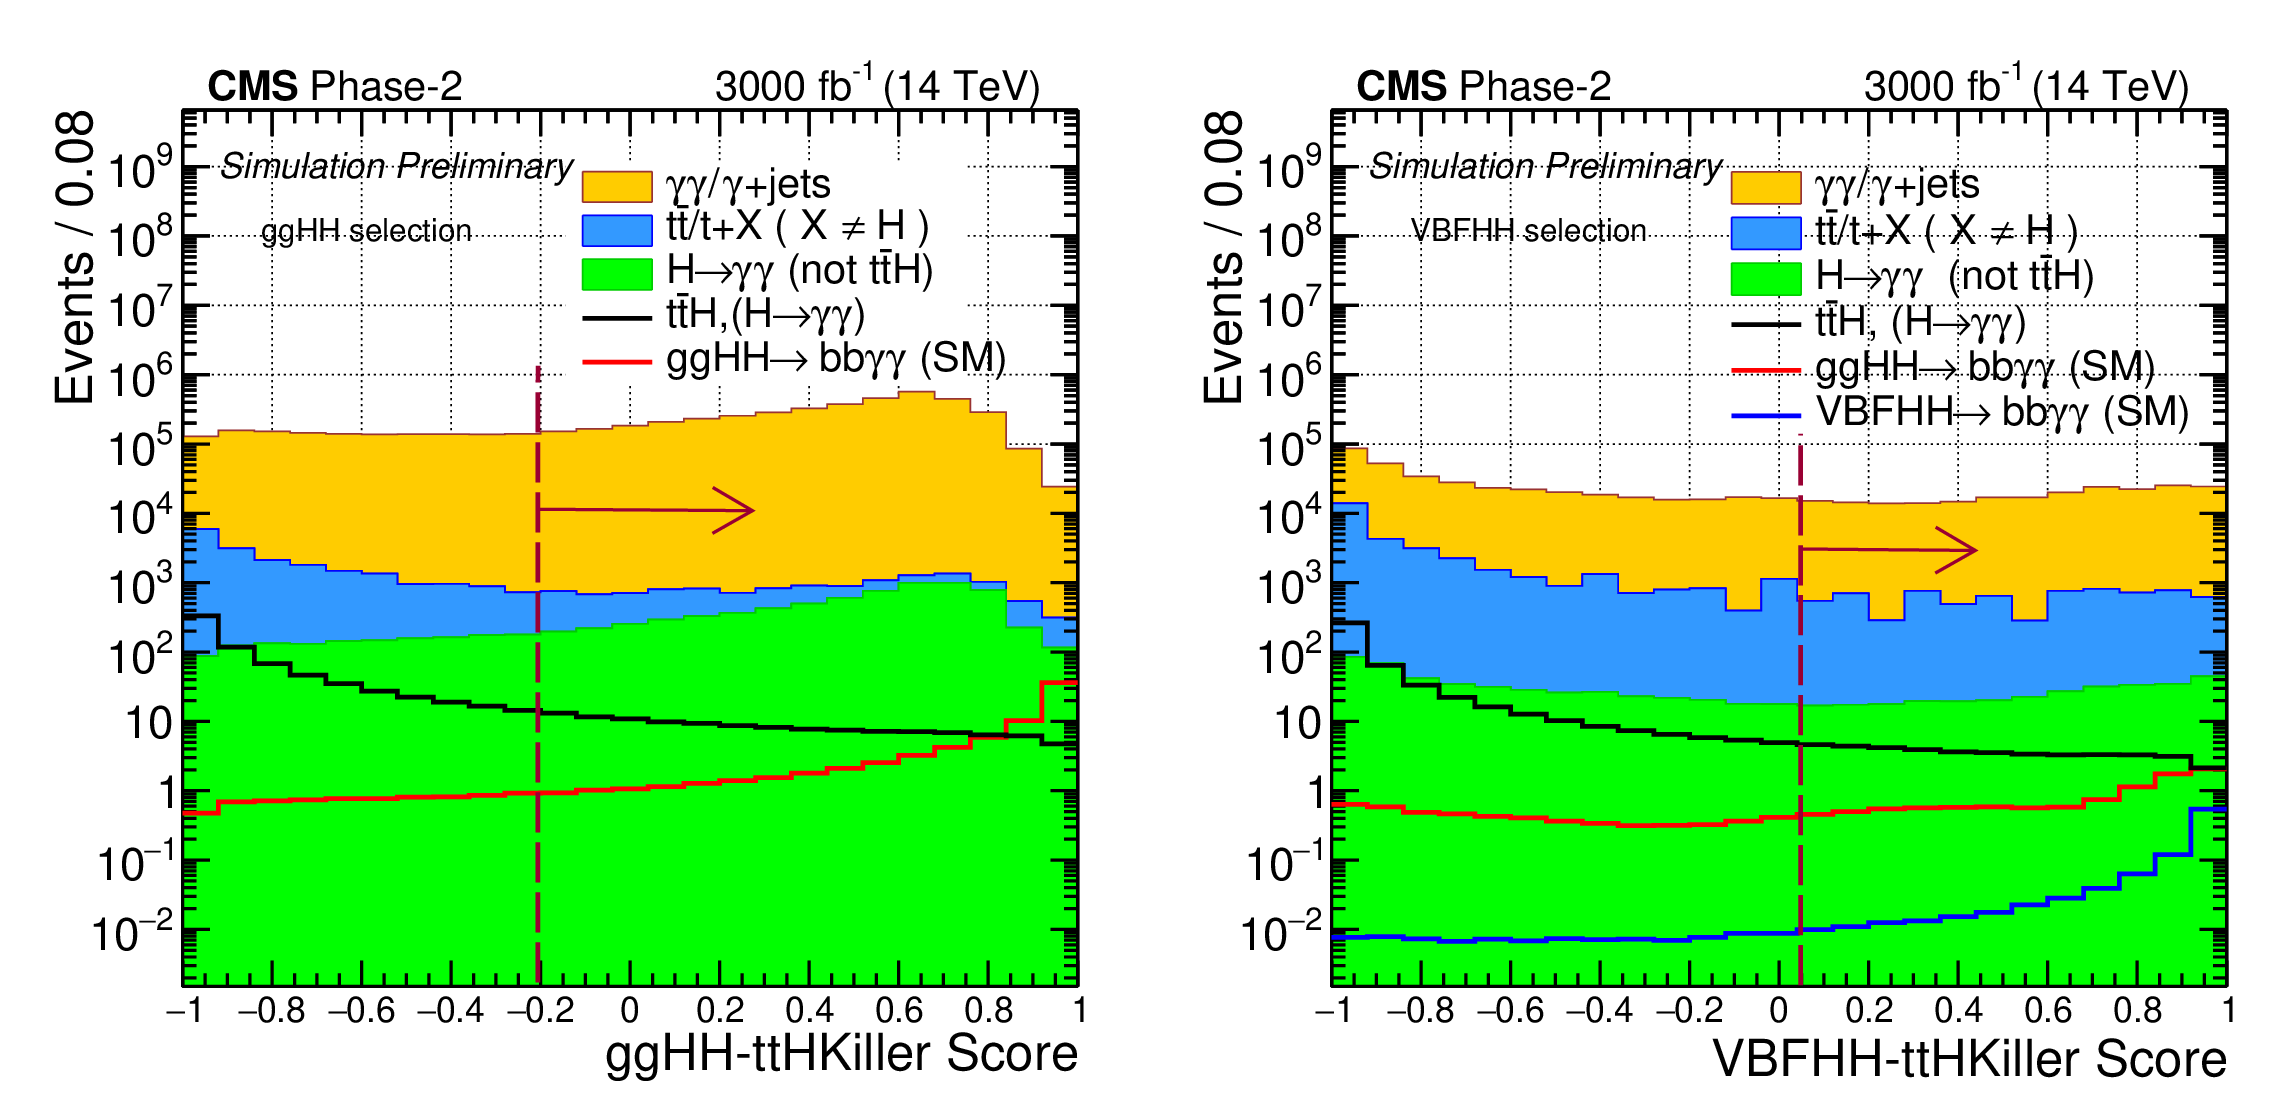
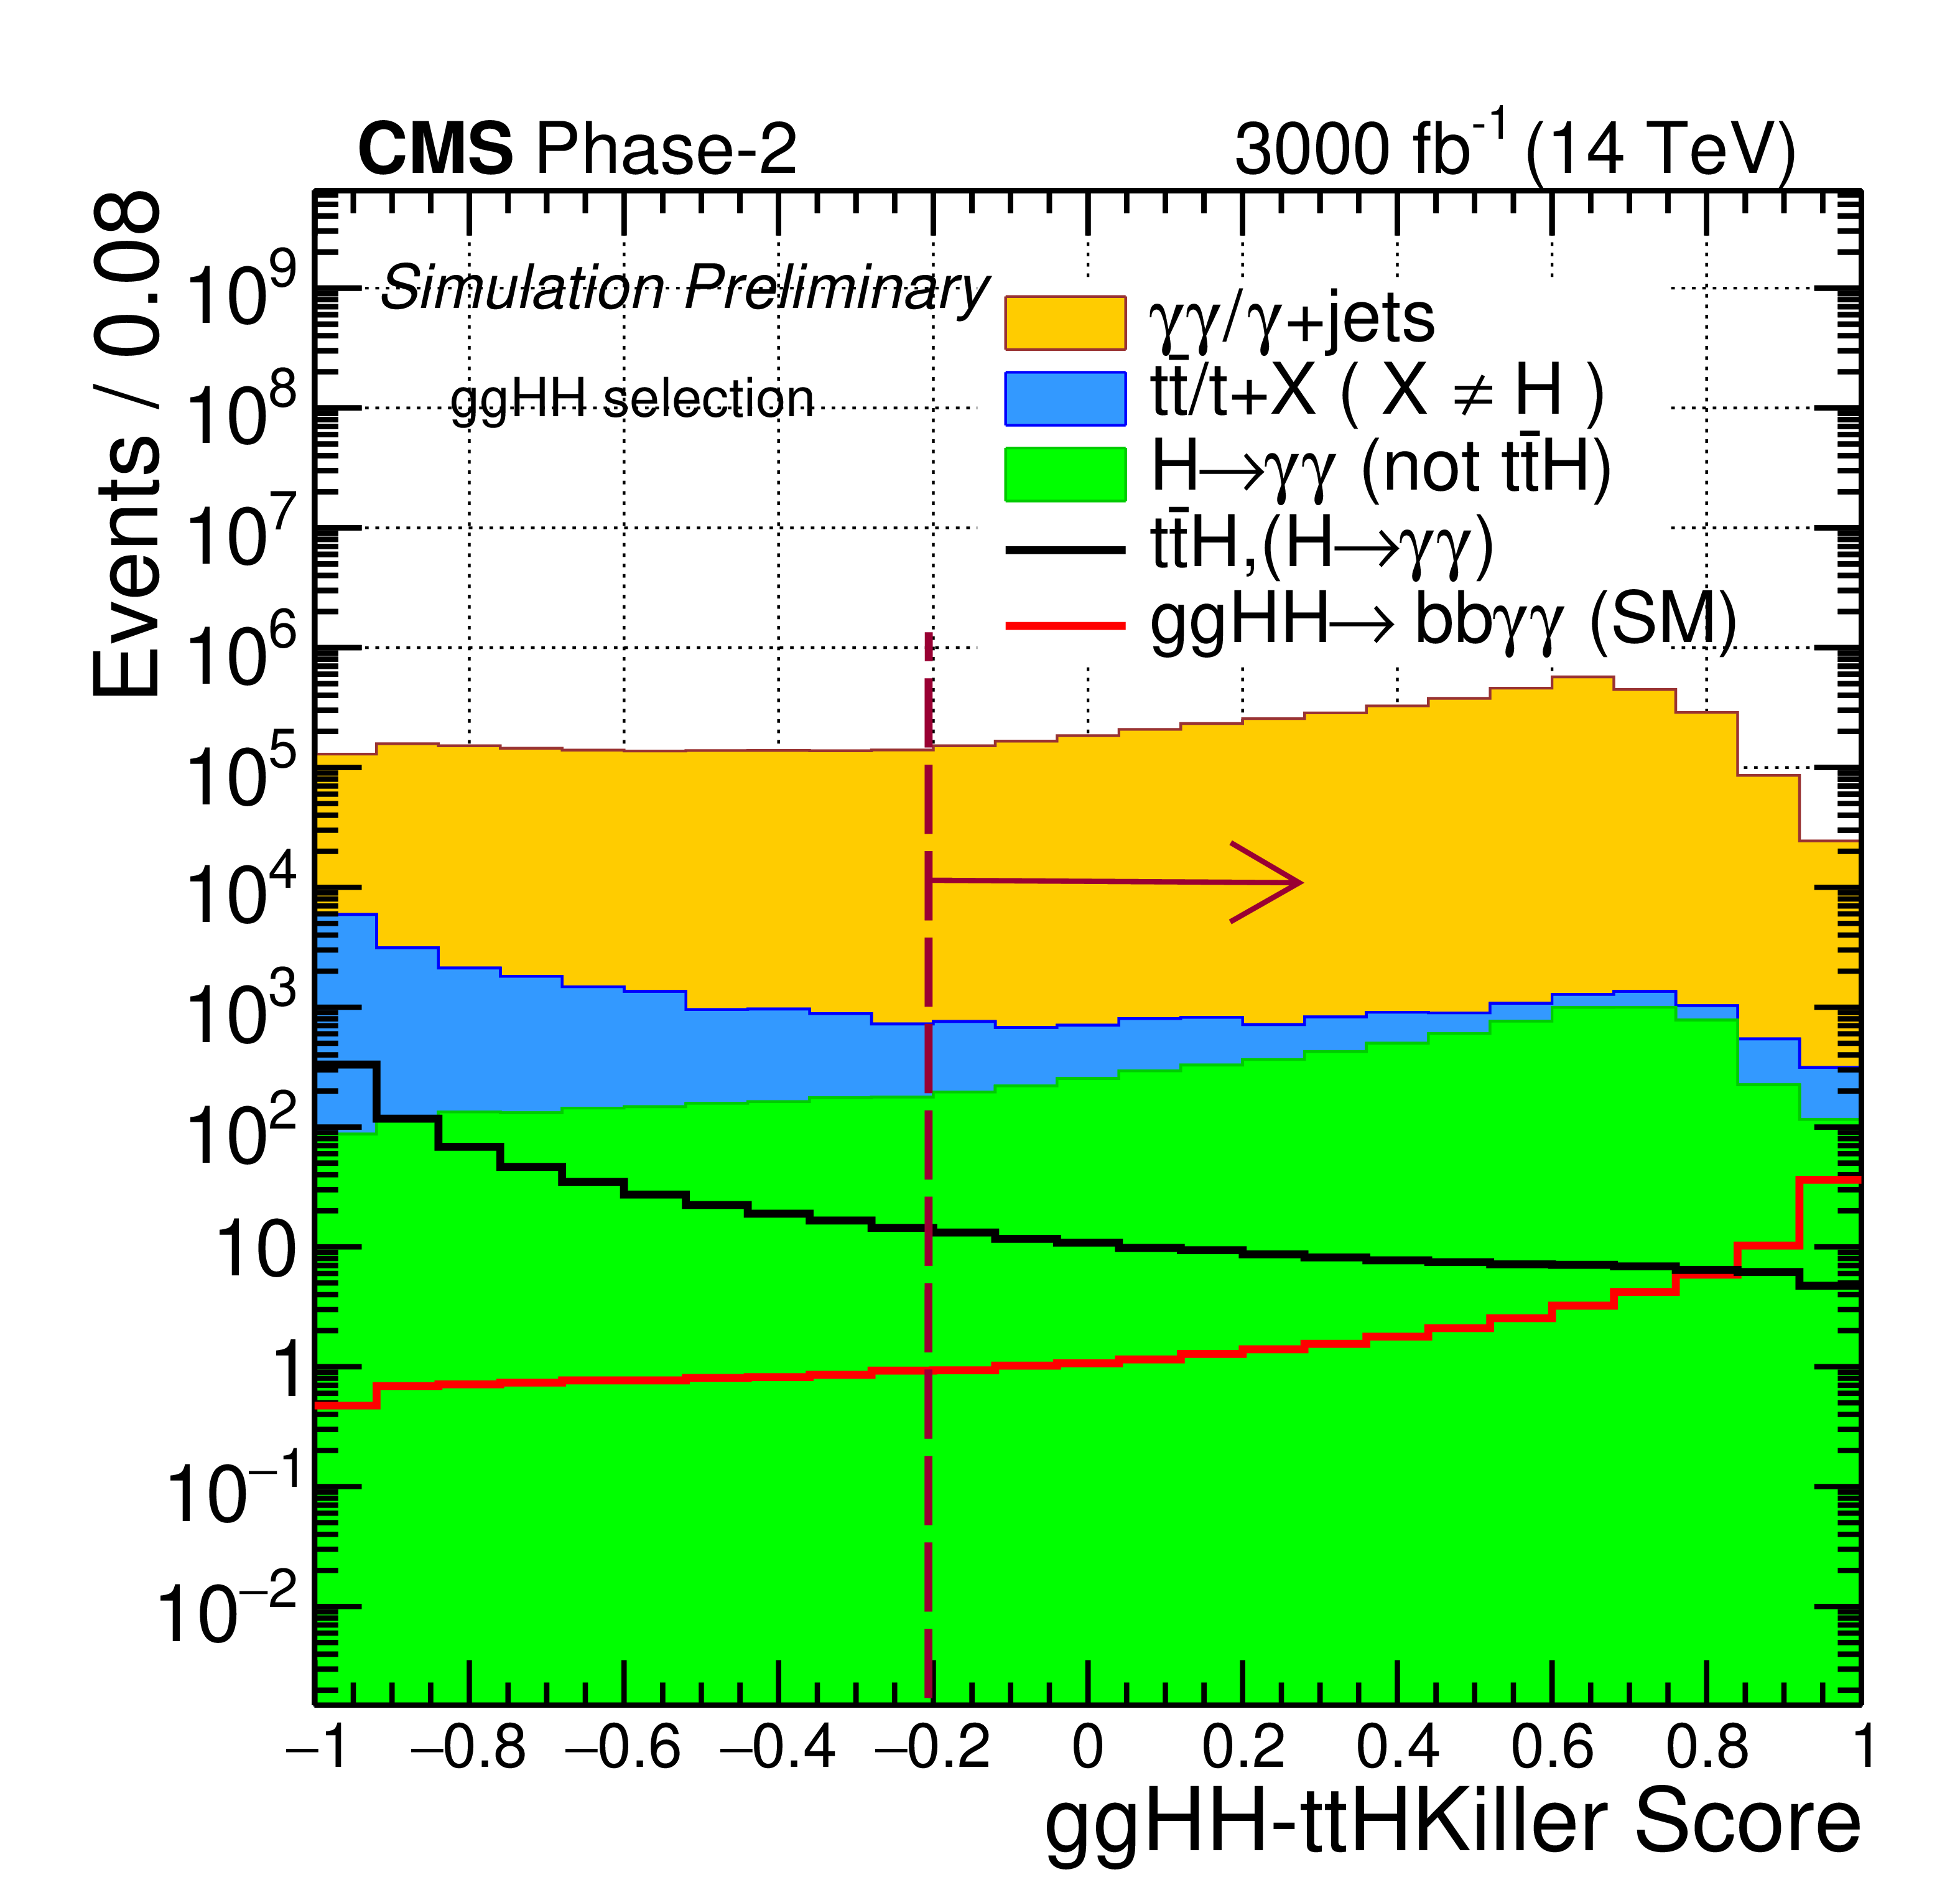
Figure 6:
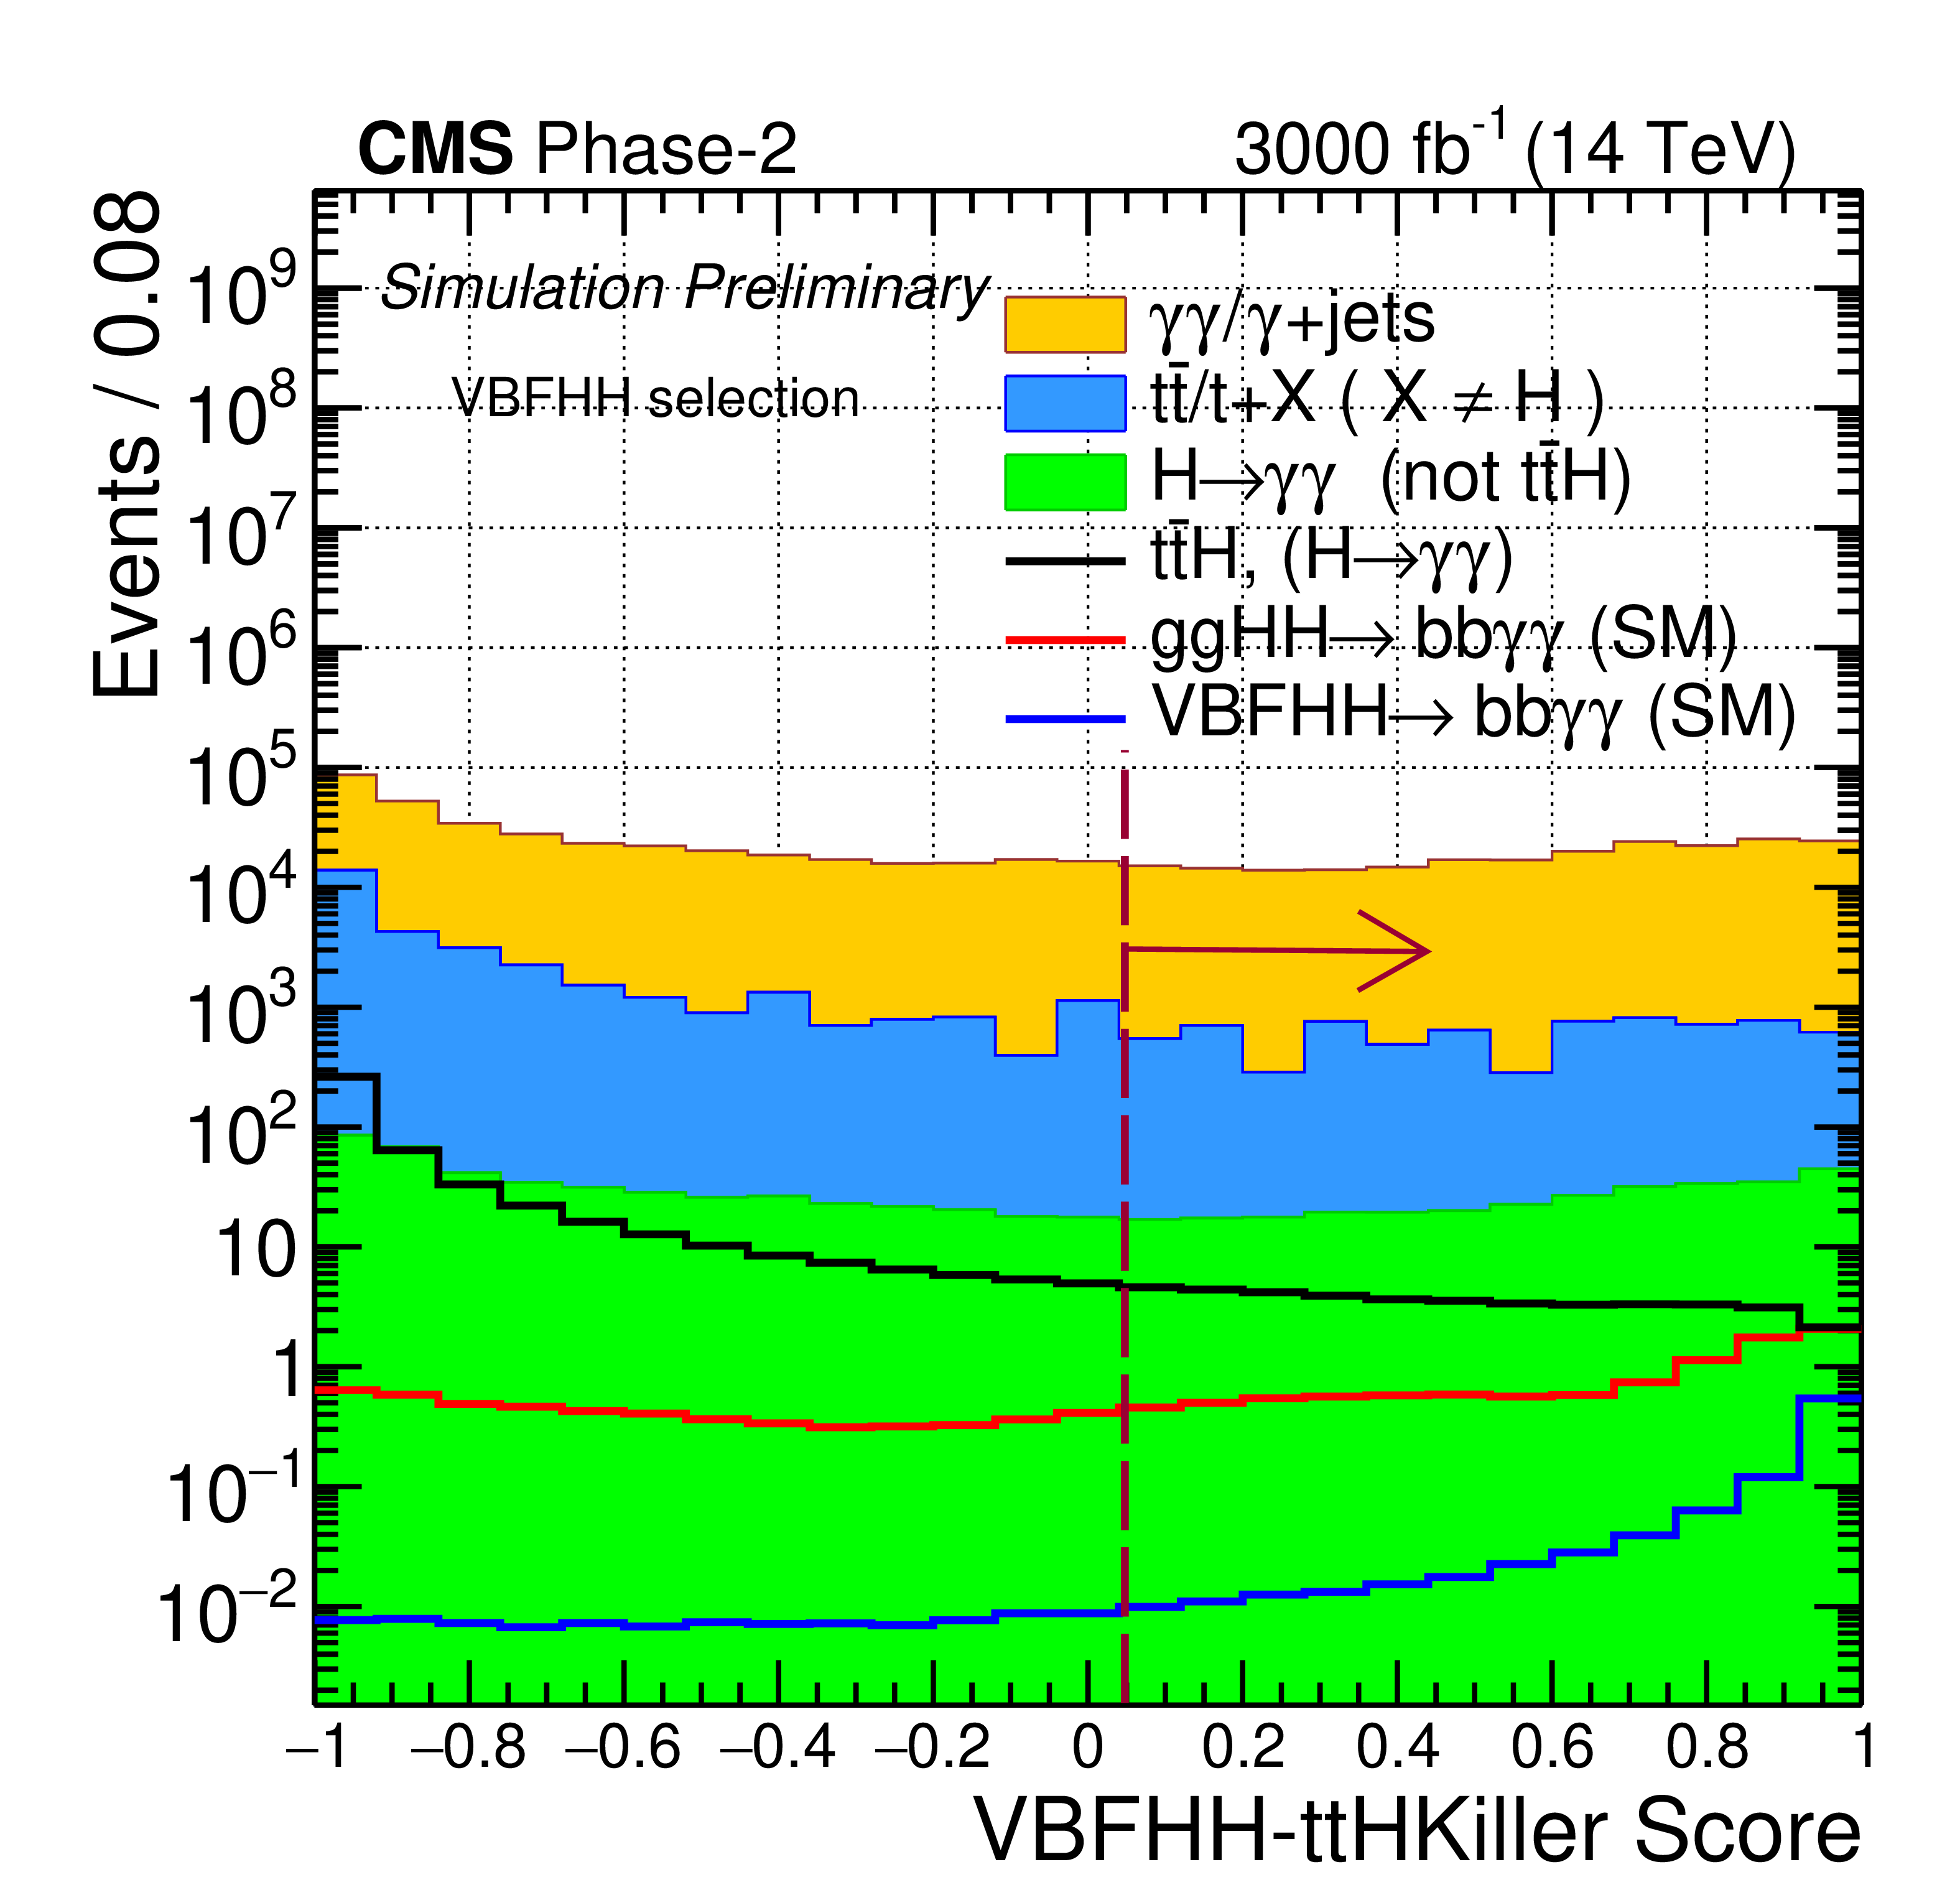
Distribution of the ggHH-ttHKiller and the VBFHH-ttHKiller discriminant scores for the ggHH- (left) and VBFHH- (right) selected events corresponding to $\mathcal {L} =$ 3000 fb$^{-1}$; ggHH signal (in red), VBFHH signal (in blue) are overlaid on different background processes (filled stacks in different colours). |
png pdf |
Figure 6-a:
Distribution of the ggHH-ttHKiller and the VBFHH-ttHKiller discriminant scores for the ggHH- (left) and VBFHH- (right) selected events corresponding to $\mathcal {L} =$ 3000 fb$^{-1}$; ggHH signal (in red), VBFHH signal (in blue) are overlaid on different background processes (filled stacks in different colours). |
png pdf |
Figure 6-b:
Distribution of the ggHH-ttHKiller and the VBFHH-ttHKiller discriminant scores for the ggHH- (left) and VBFHH- (right) selected events corresponding to $\mathcal {L} =$ 3000 fb$^{-1}$; ggHH signal (in red), VBFHH signal (in blue) are overlaid on different background processes (filled stacks in different colours). |
png pdf |
Figure 7:
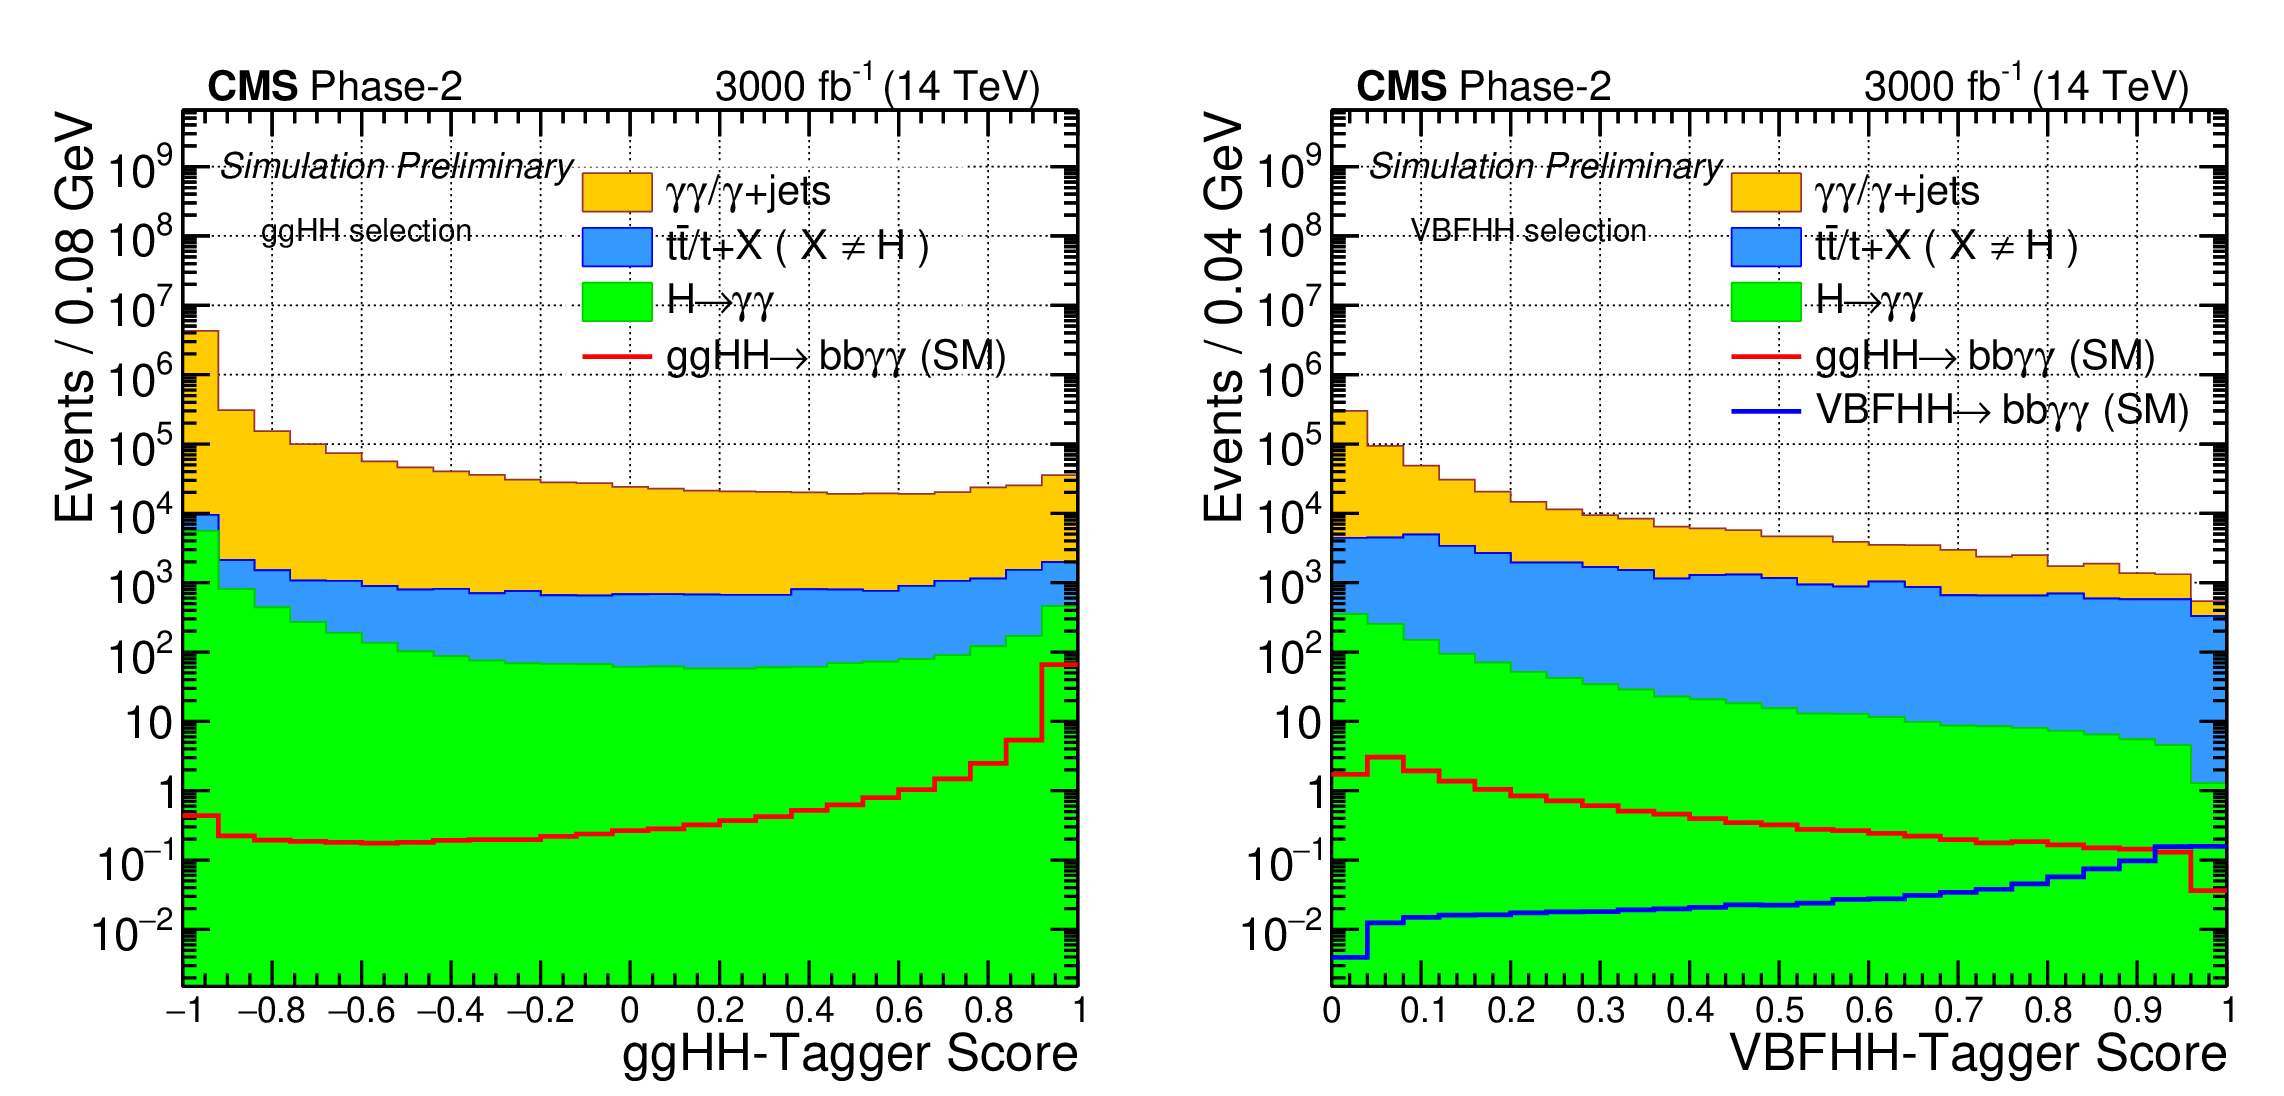
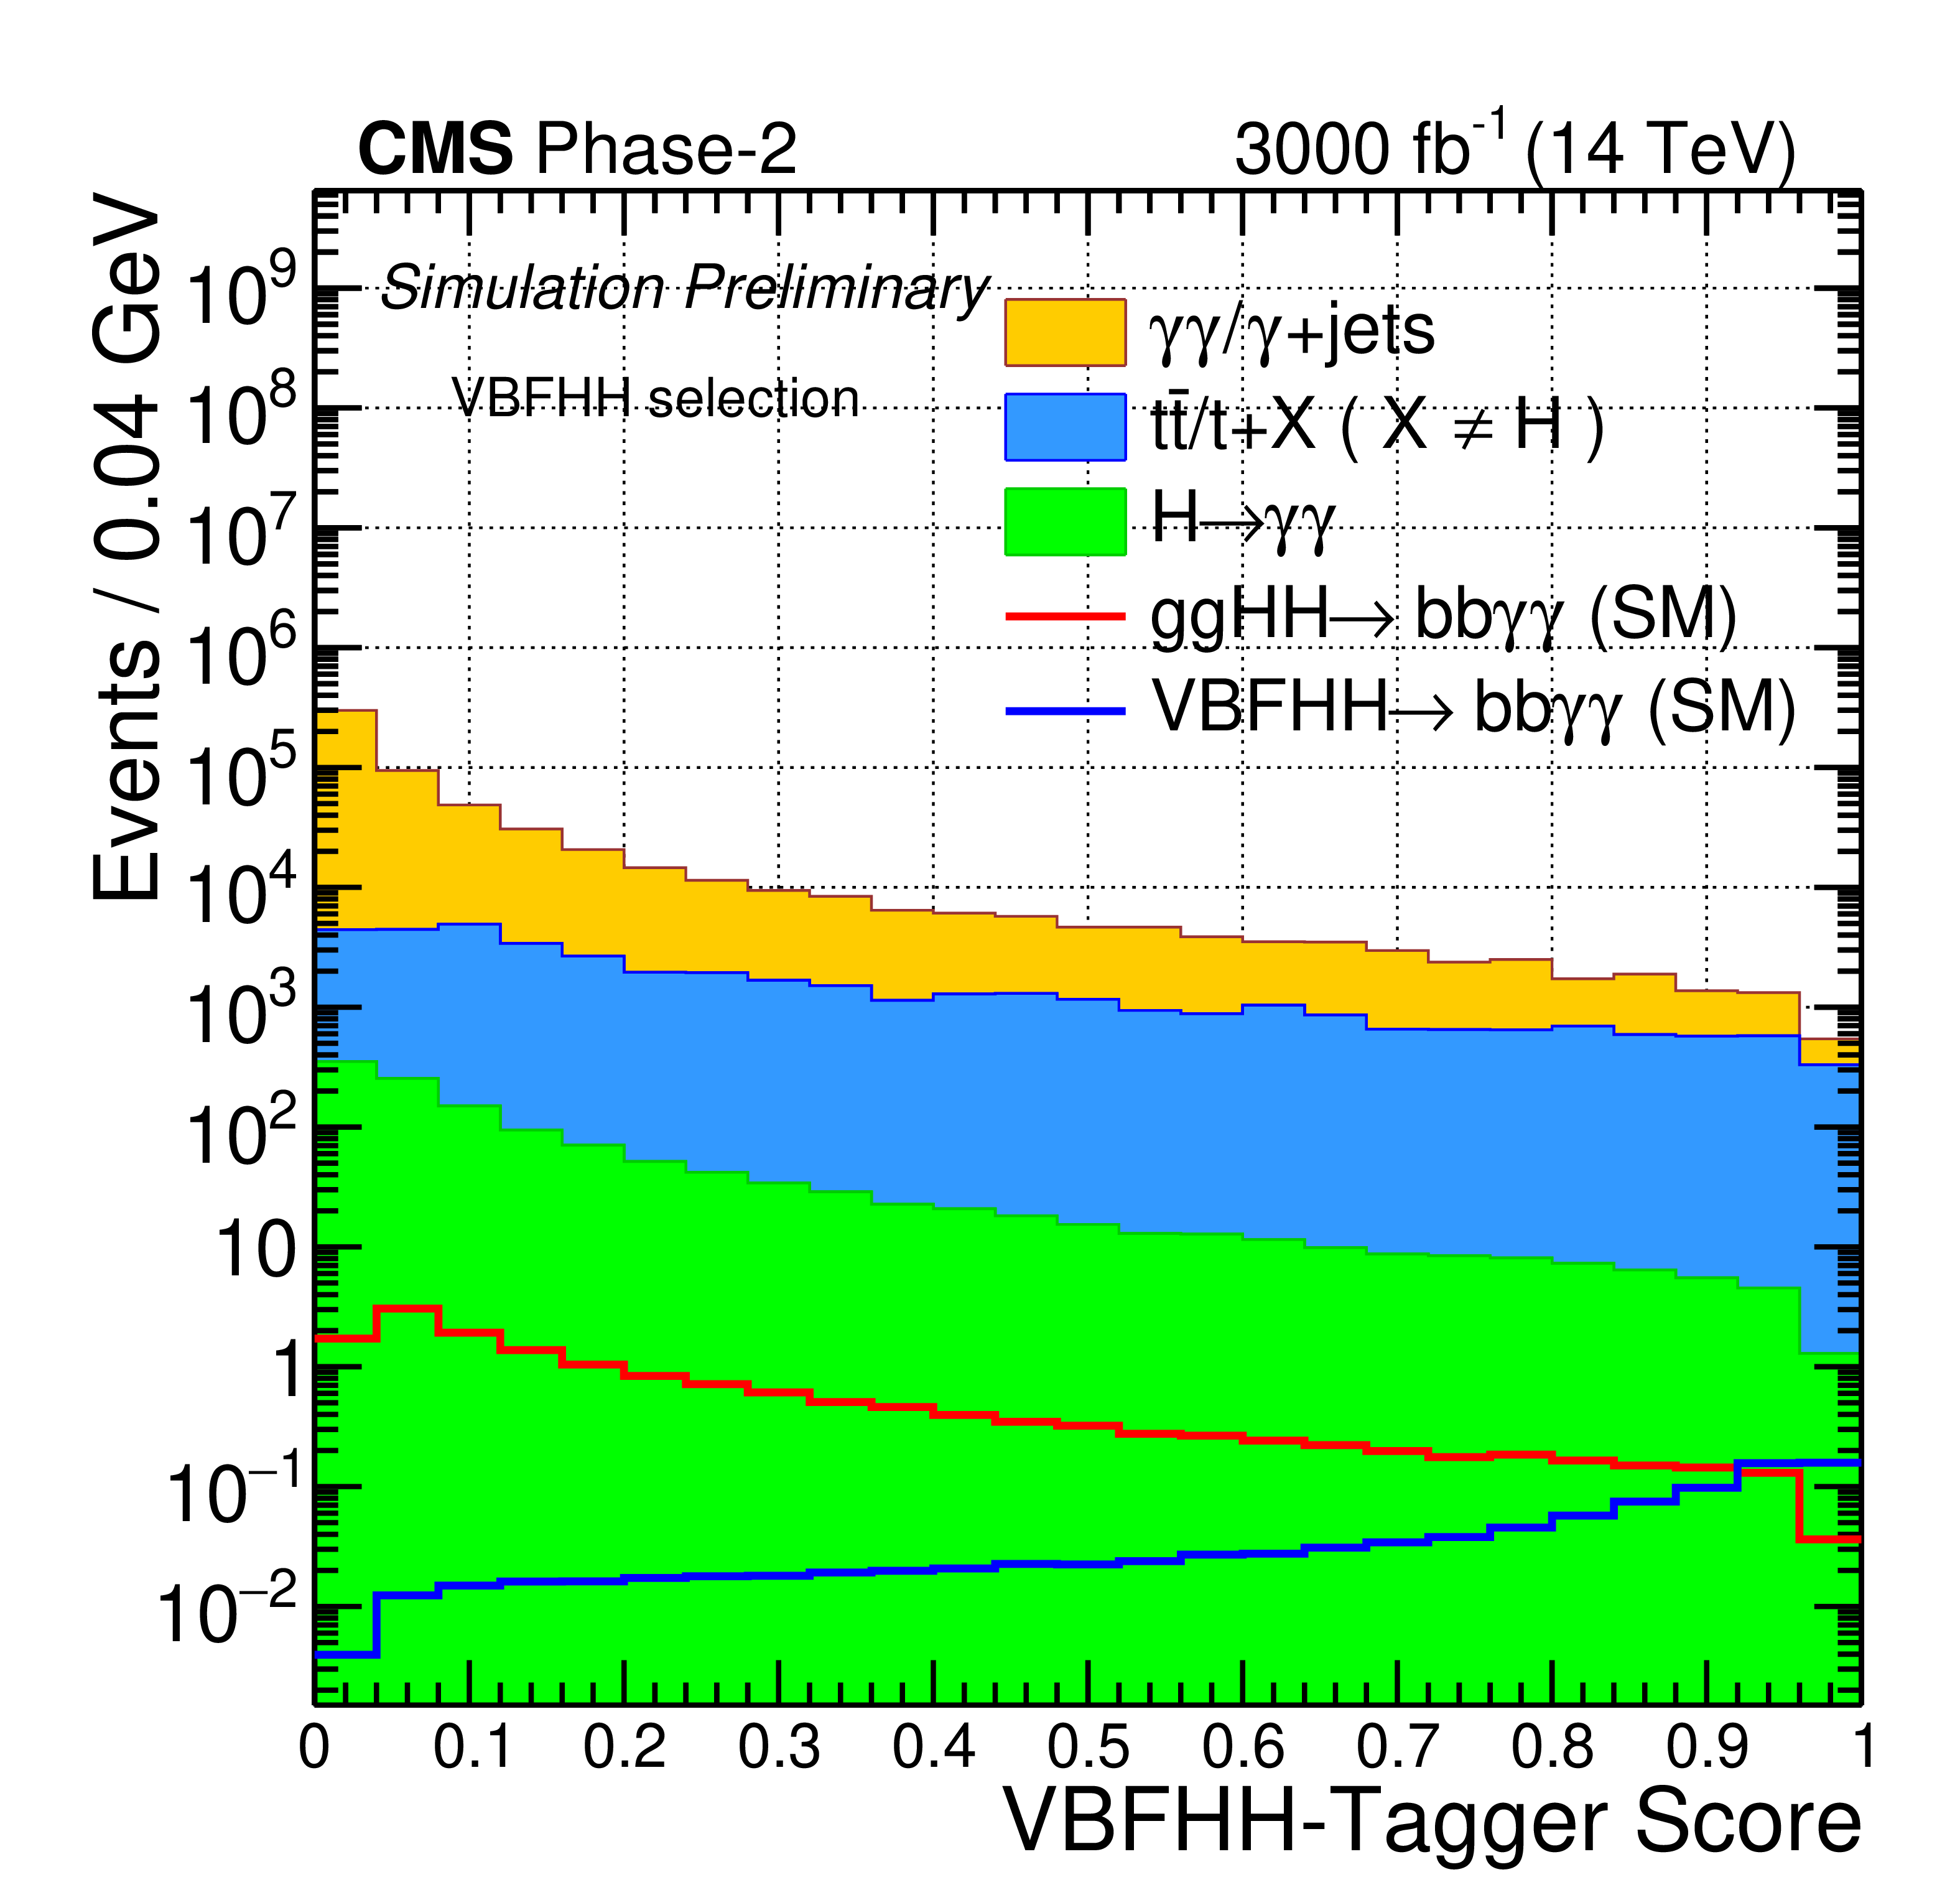
Distributions of the ggHH-Tagger and the VBFHH-Tagger discriminant scores for the ggHH- (left) and VBFHH- (right) selected events corresponding to $\mathcal {L} =$ 3000 fb$^{-1}$; ggHH signal (in red), VBFHH signal (in blue) are overlaid on different background processes (filled stacks in different colours). |

png pdf |
Figure 7-a:
Distributions of the ggHH-Tagger and the VBFHH-Tagger discriminant scores for the ggHH- (left) and VBFHH- (right) selected events corresponding to $\mathcal {L} =$ 3000 fb$^{-1}$; ggHH signal (in red), VBFHH signal (in blue) are overlaid on different background processes (filled stacks in different colours). |
png pdf |
Figure 7-b:
Distributions of the ggHH-Tagger and the VBFHH-Tagger discriminant scores for the ggHH- (left) and VBFHH- (right) selected events corresponding to $\mathcal {L} =$ 3000 fb$^{-1}$; ggHH signal (in red), VBFHH signal (in blue) are overlaid on different background processes (filled stacks in different colours). |

png pdf |
Figure 8:
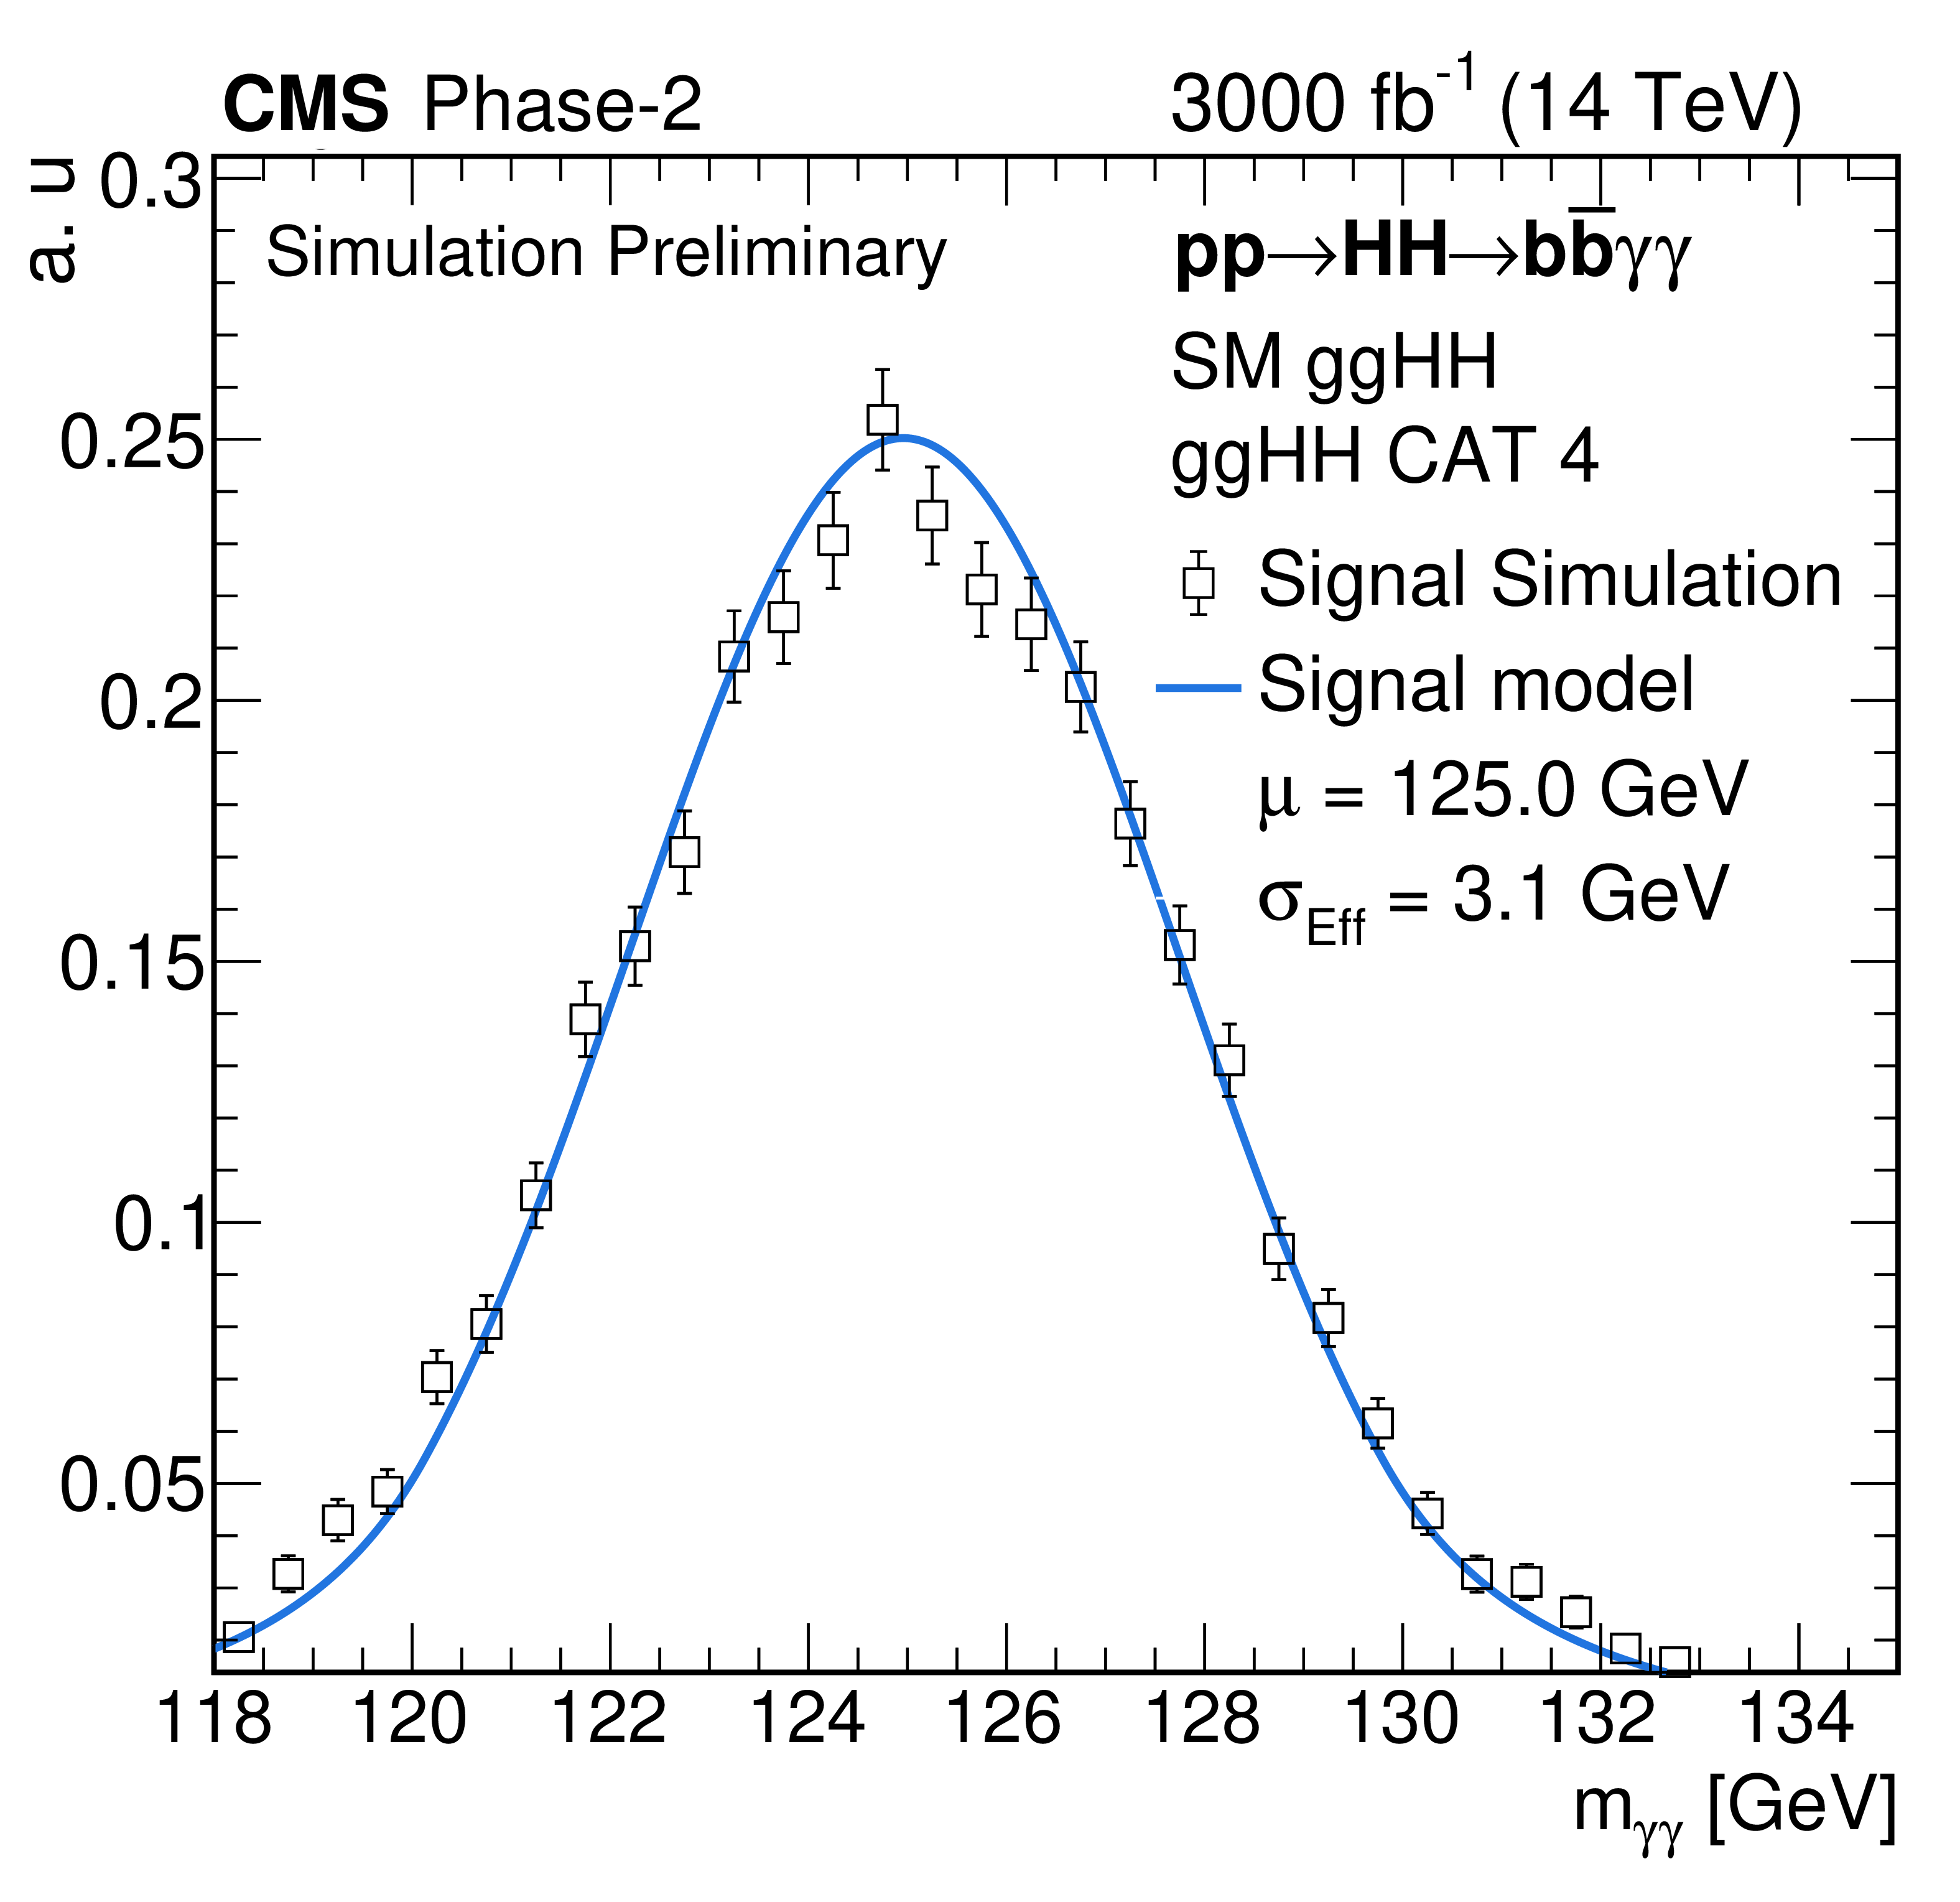
Distributions of the $ {\mathrm m_{\gamma \gamma}} $ (left) and the $ {\rm m_{\rm bb}} $ (right) for the ggHH signal sample in ggHH CAT4 (high $ {\rm \tilde{M}_X} $ and medium purity). |
png pdf |
Figure 8-a:
Distributions of the $ {\mathrm m_{\gamma \gamma}} $ (left) and the $ {\rm m_{\rm bb}} $ (right) for the ggHH signal sample in ggHH CAT4 (high $ {\rm \tilde{M}_X} $ and medium purity). |

png pdf |
Figure 8-b:
Distributions of the $ {\mathrm m_{\gamma \gamma}} $ (left) and the $ {\rm m_{\rm bb}} $ (right) for the ggHH signal sample in ggHH CAT4 (high $ {\rm \tilde{M}_X} $ and medium purity). |
png pdf |
Figure 9:
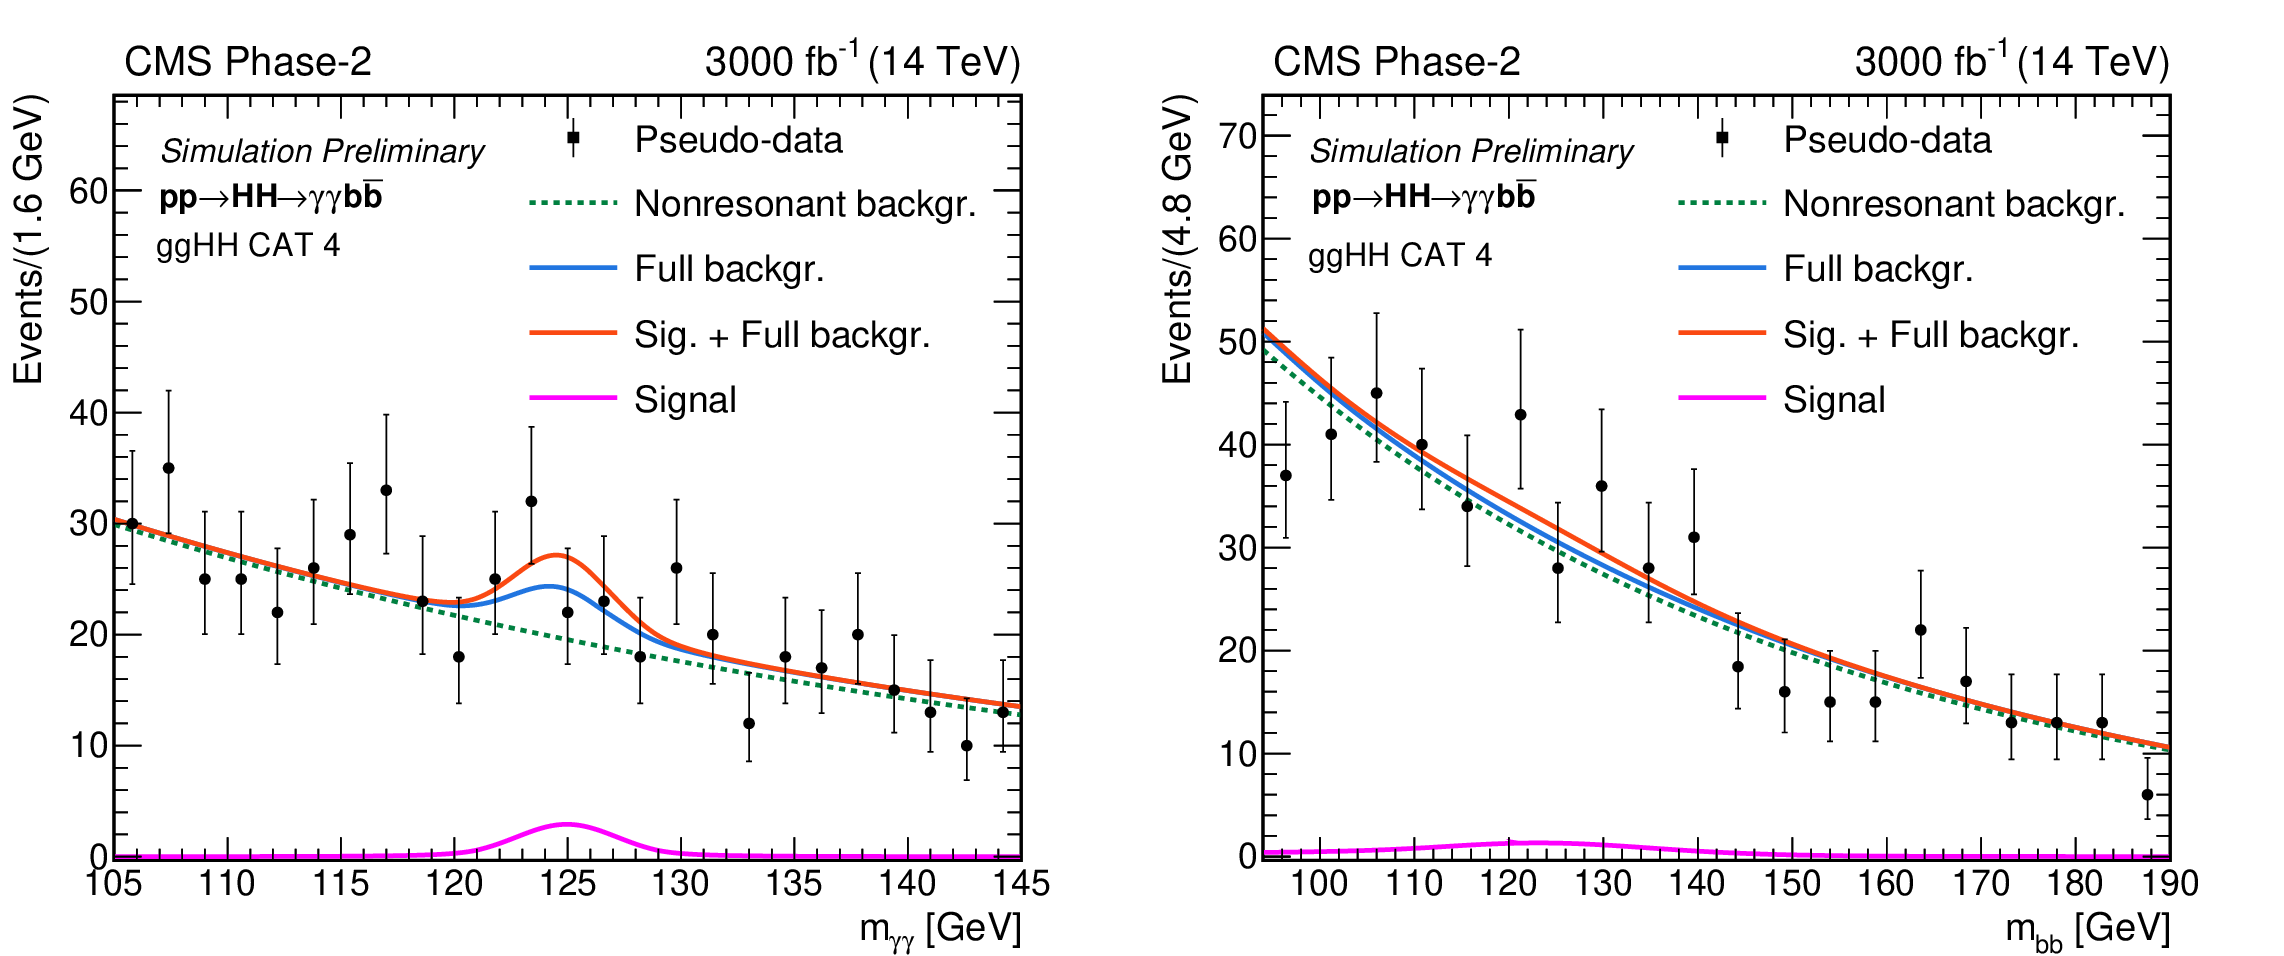
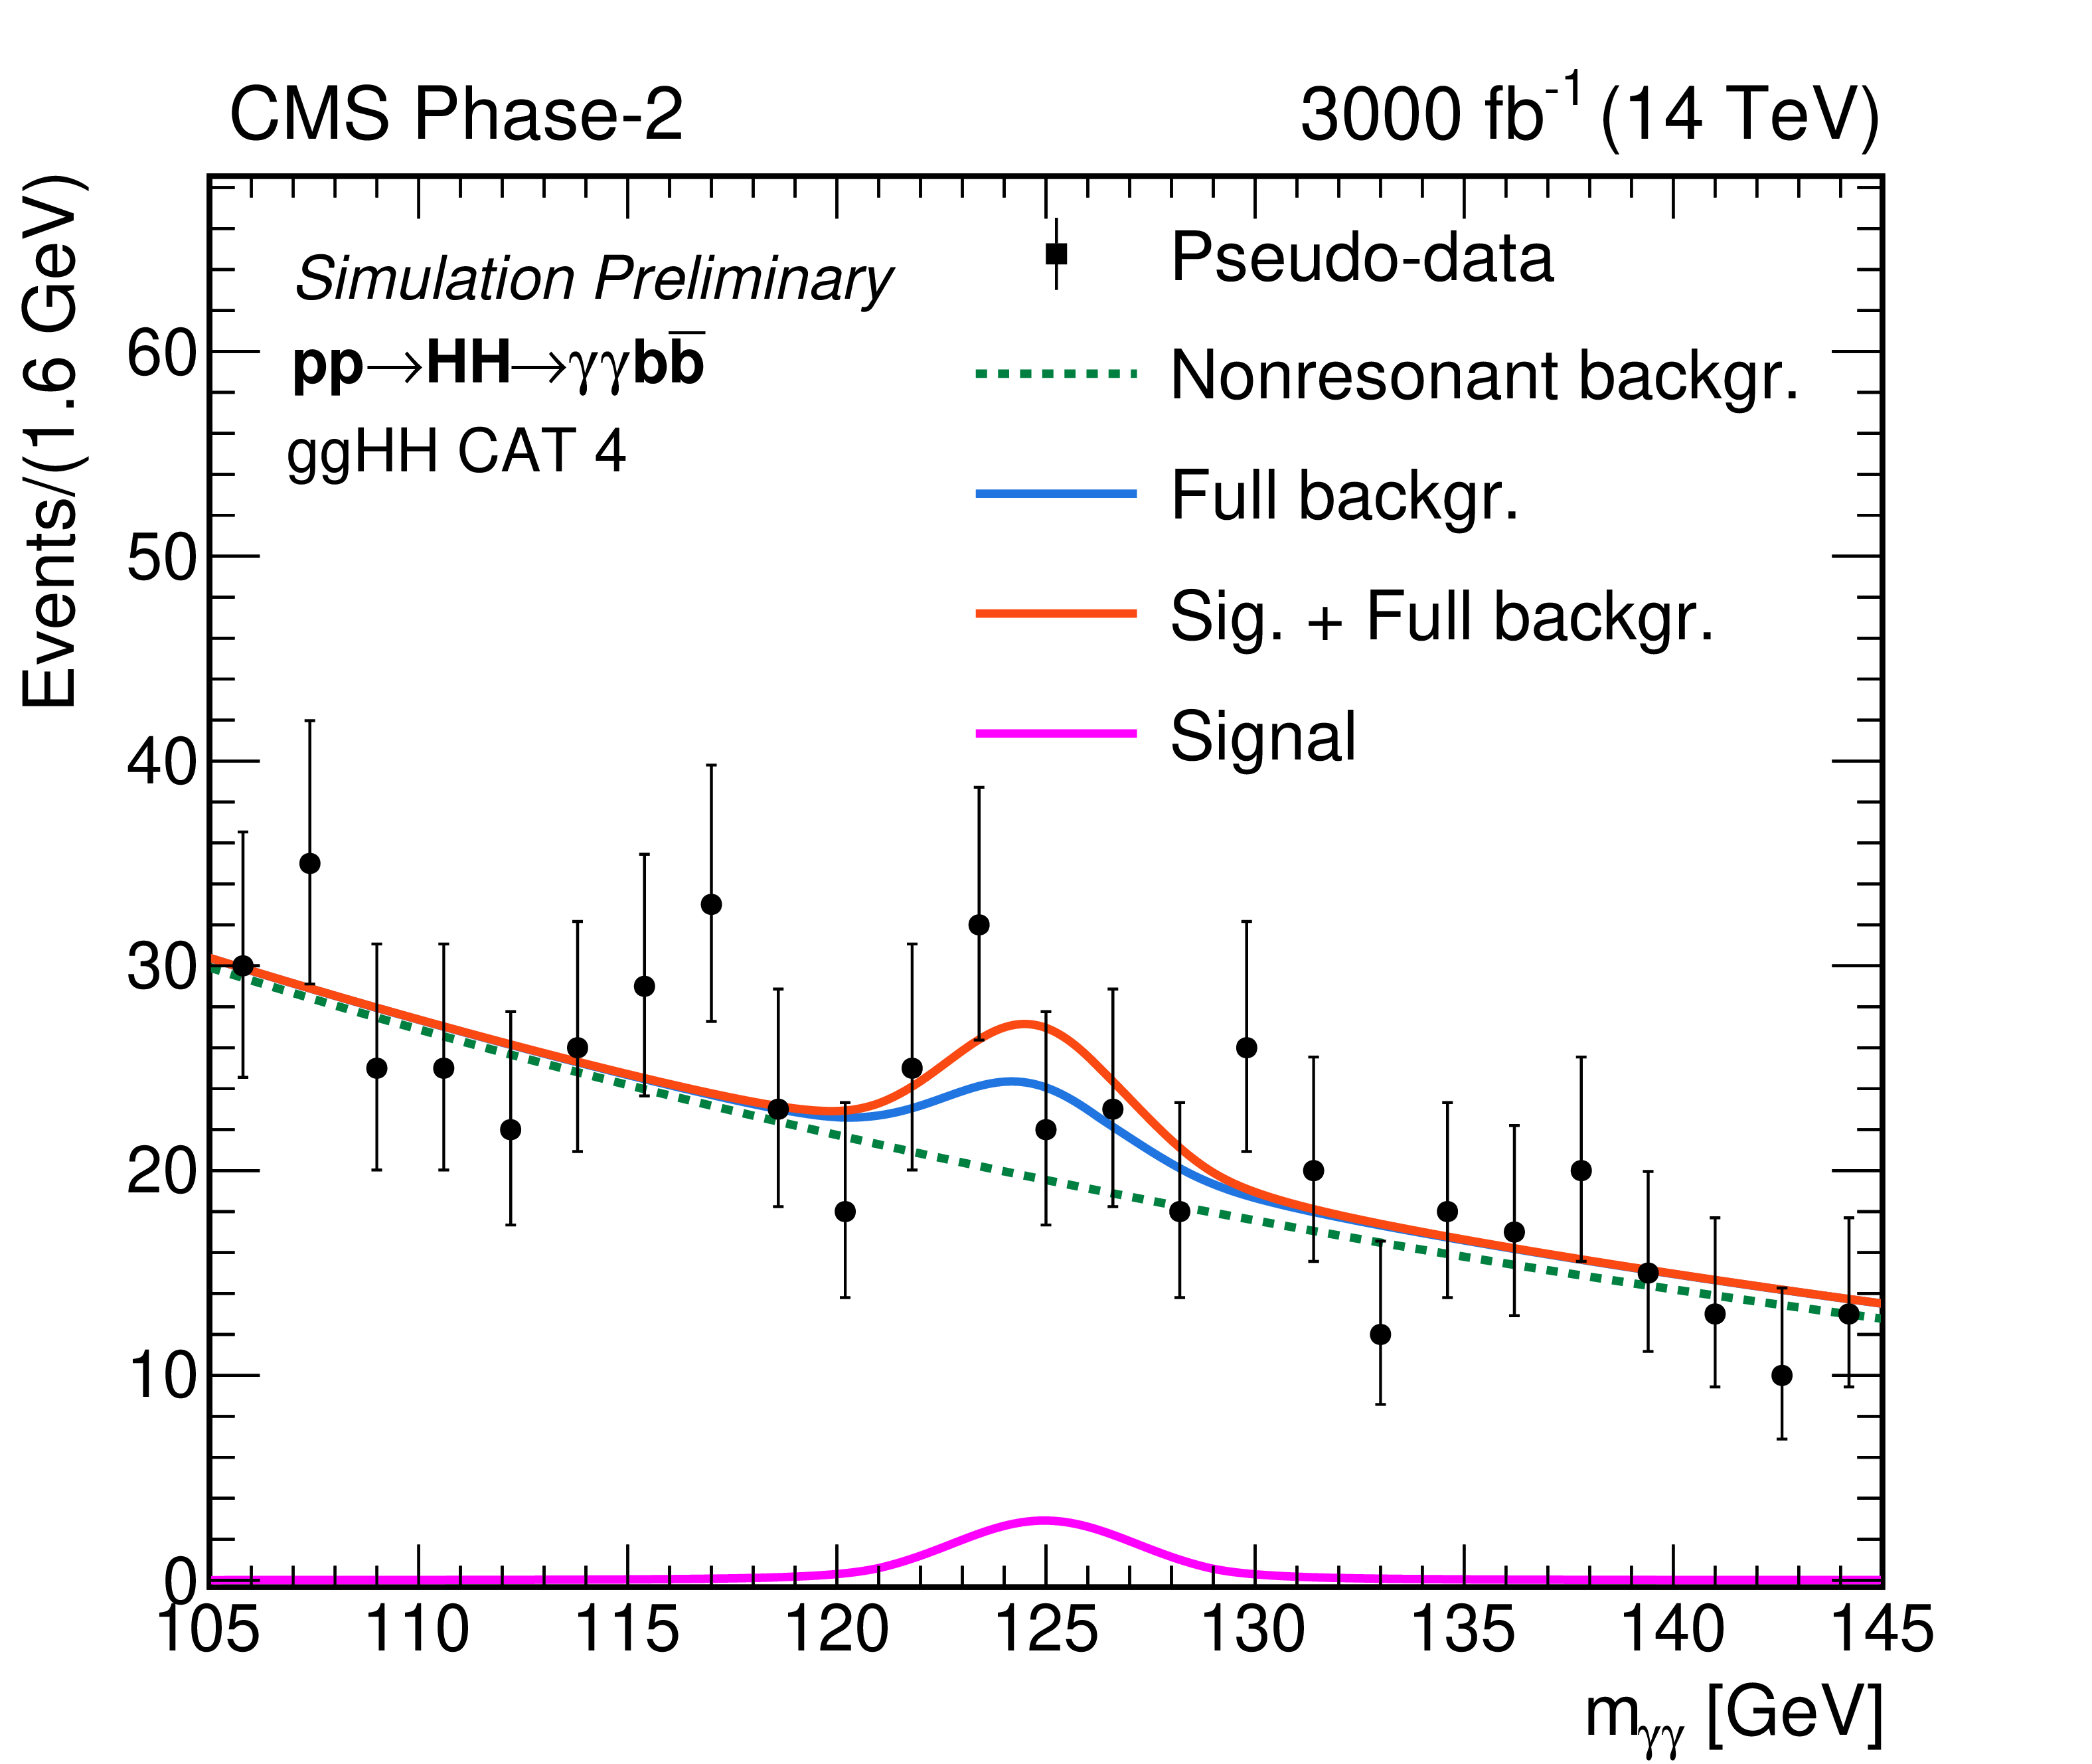
Distributions of the $ {\mathrm m_{\gamma \gamma}} $ (left) and the $ {\rm m_{\rm bb}} $ (right) for the selected pseudo-data events (black points) corresponding to $\mathcal {L} = $ 3000 fb$^{-1}$ shown for ggHH CAT4 (high $ {\rm \tilde{M}_X} $ and medium purity) along with the expectations as estimated from the simulation. The curves correspond to continuum background only (green dashed), total background (continuum + single Higgs boson) (solid blue), and the signal + background (solid red). The signal contribution is shown in solid magenta line at the bottom of the plot. |
png pdf |
Figure 9-a:
Distributions of the $ {\mathrm m_{\gamma \gamma}} $ (left) and the $ {\rm m_{\rm bb}} $ (right) for the selected pseudo-data events (black points) corresponding to $\mathcal {L} = $ 3000 fb$^{-1}$ shown for ggHH CAT4 (high $ {\rm \tilde{M}_X} $ and medium purity) along with the expectations as estimated from the simulation. The curves correspond to continuum background only (green dashed), total background (continuum + single Higgs boson) (solid blue), and the signal + background (solid red). The signal contribution is shown in solid magenta line at the bottom of the plot. |

png pdf |
Figure 9-b:
Distributions of the $ {\mathrm m_{\gamma \gamma}} $ (left) and the $ {\rm m_{\rm bb}} $ (right) for the selected pseudo-data events (black points) corresponding to $\mathcal {L} = $ 3000 fb$^{-1}$ shown for ggHH CAT4 (high $ {\rm \tilde{M}_X} $ and medium purity) along with the expectations as estimated from the simulation. The curves correspond to continuum background only (green dashed), total background (continuum + single Higgs boson) (solid blue), and the signal + background (solid red). The signal contribution is shown in solid magenta line at the bottom of the plot. |
| Tables | |
png pdf |
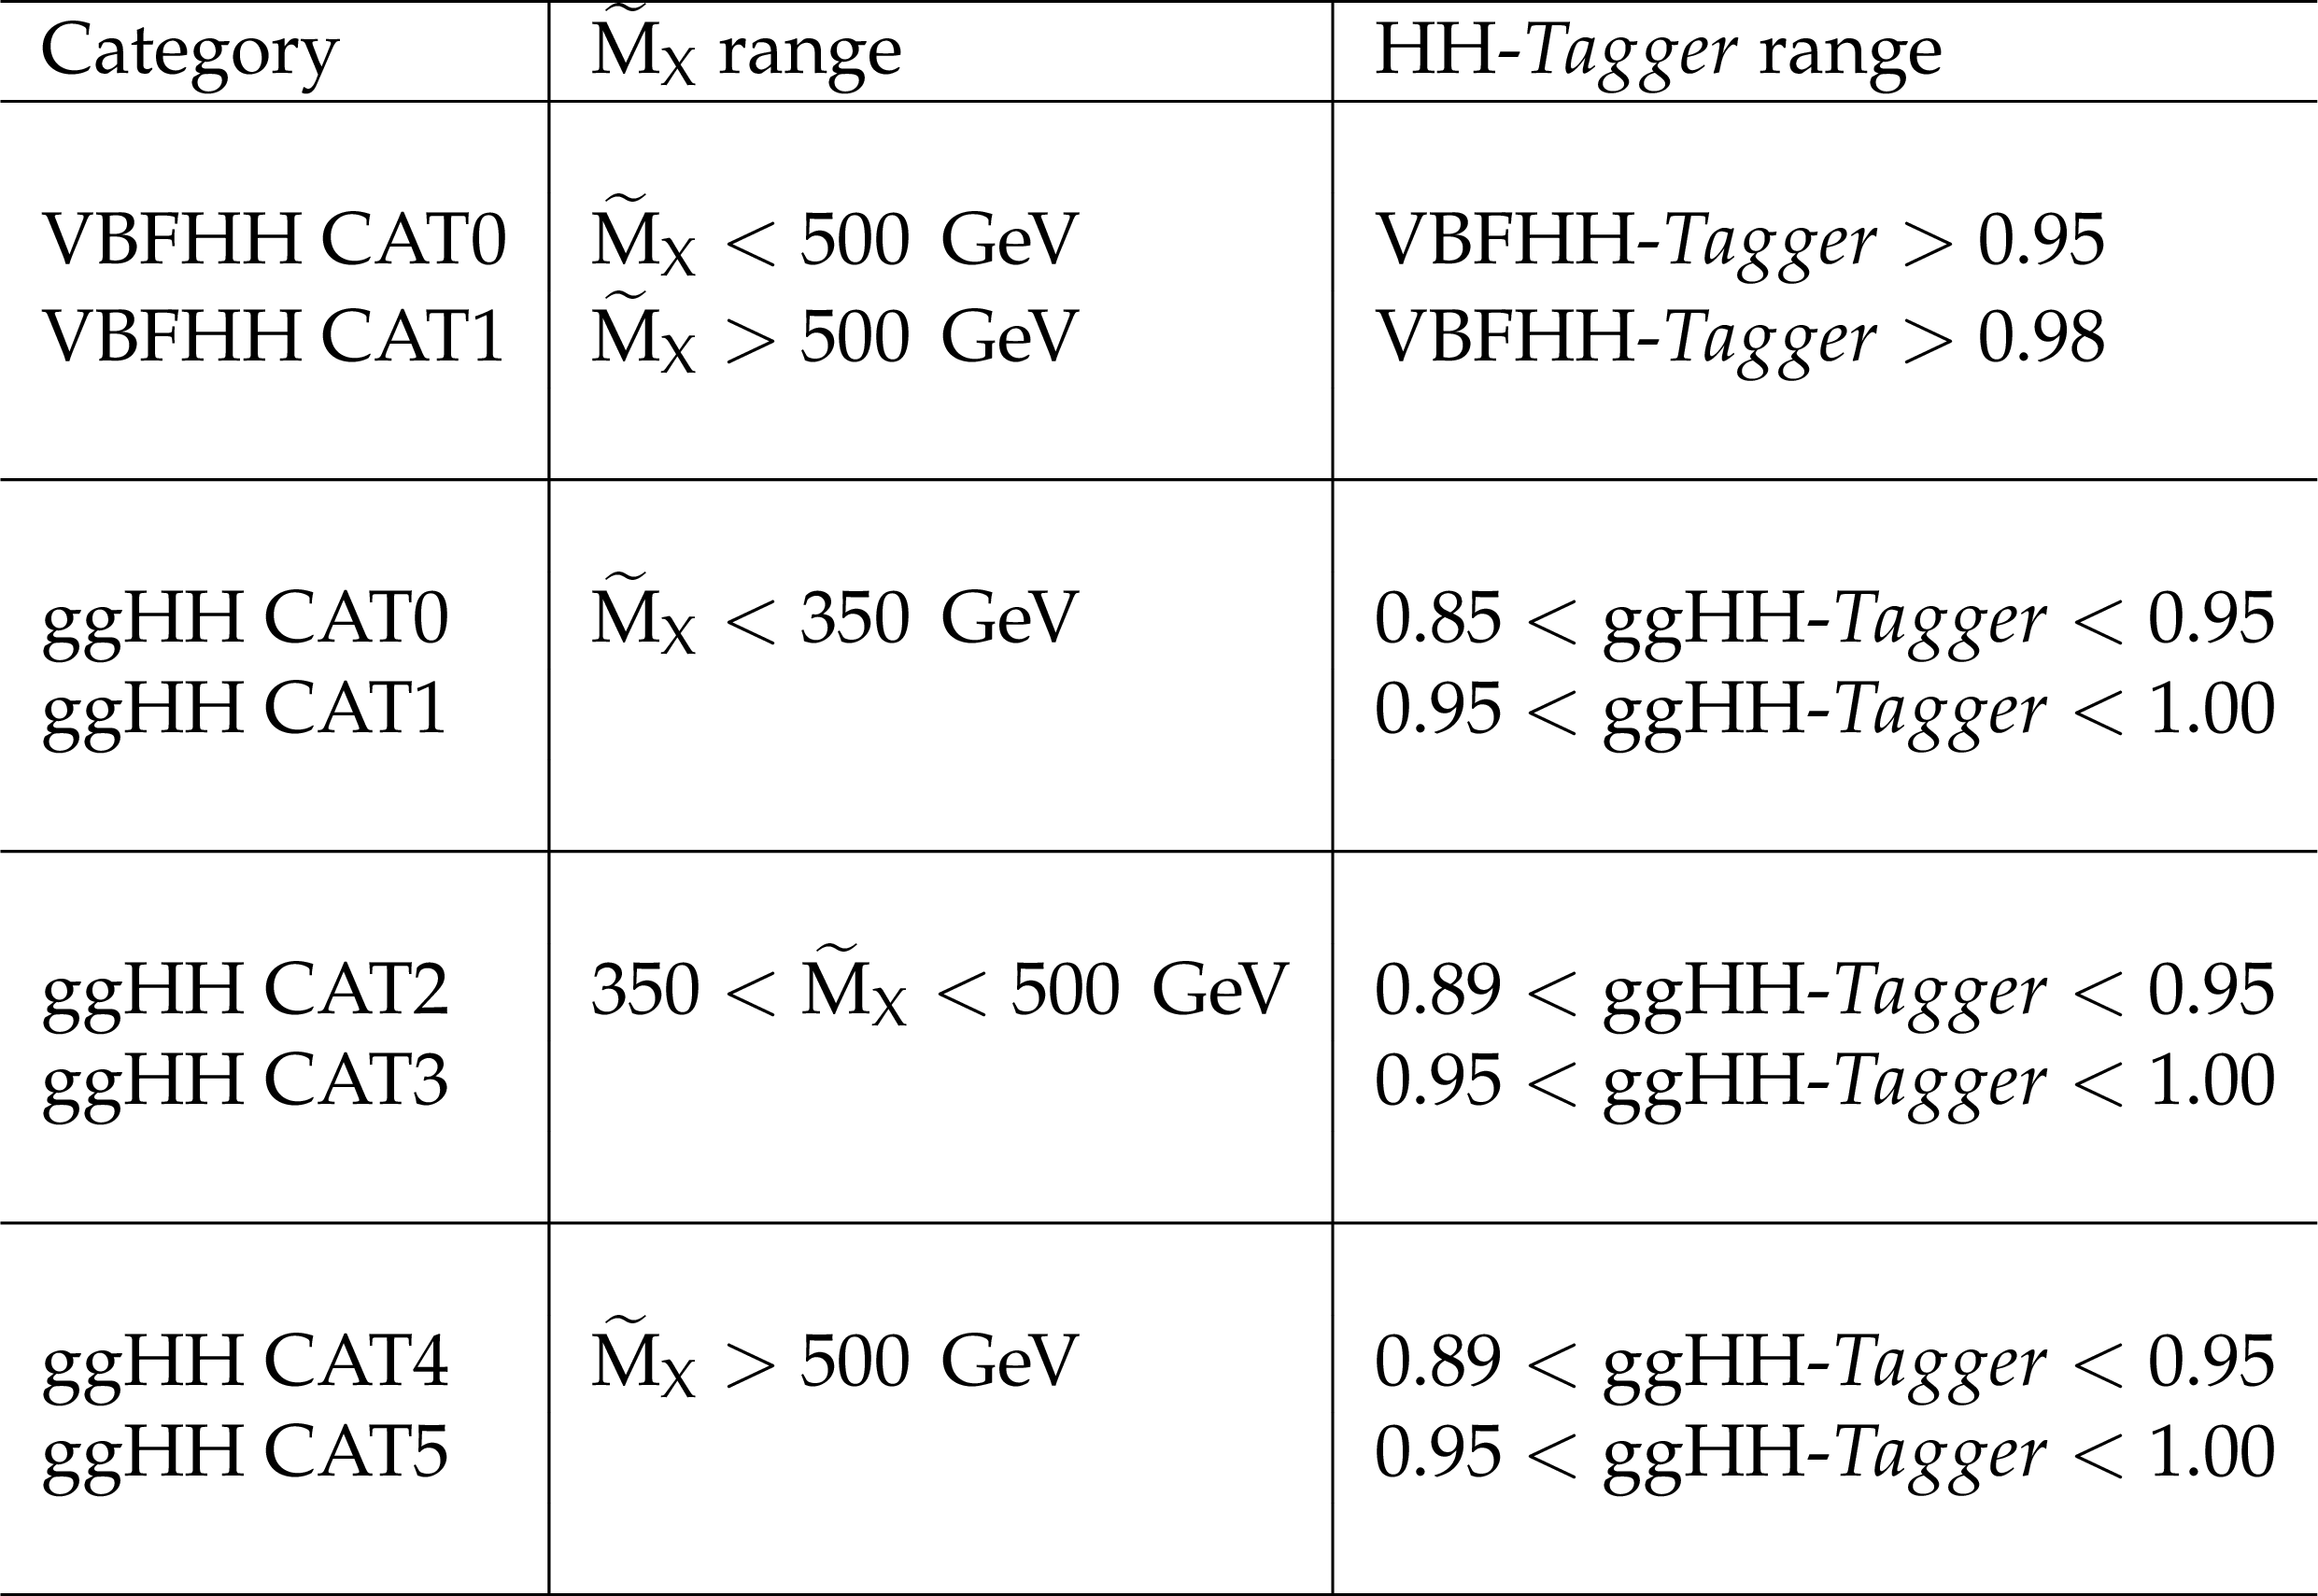
Table 1:
Definitions of the analysis categories. |

png pdf |
Table 2:
Sources of experimental uncertainties and impacts on event yields (in %) estimated for the Run 2 [6] studies and used in this analysis. |
png pdf |
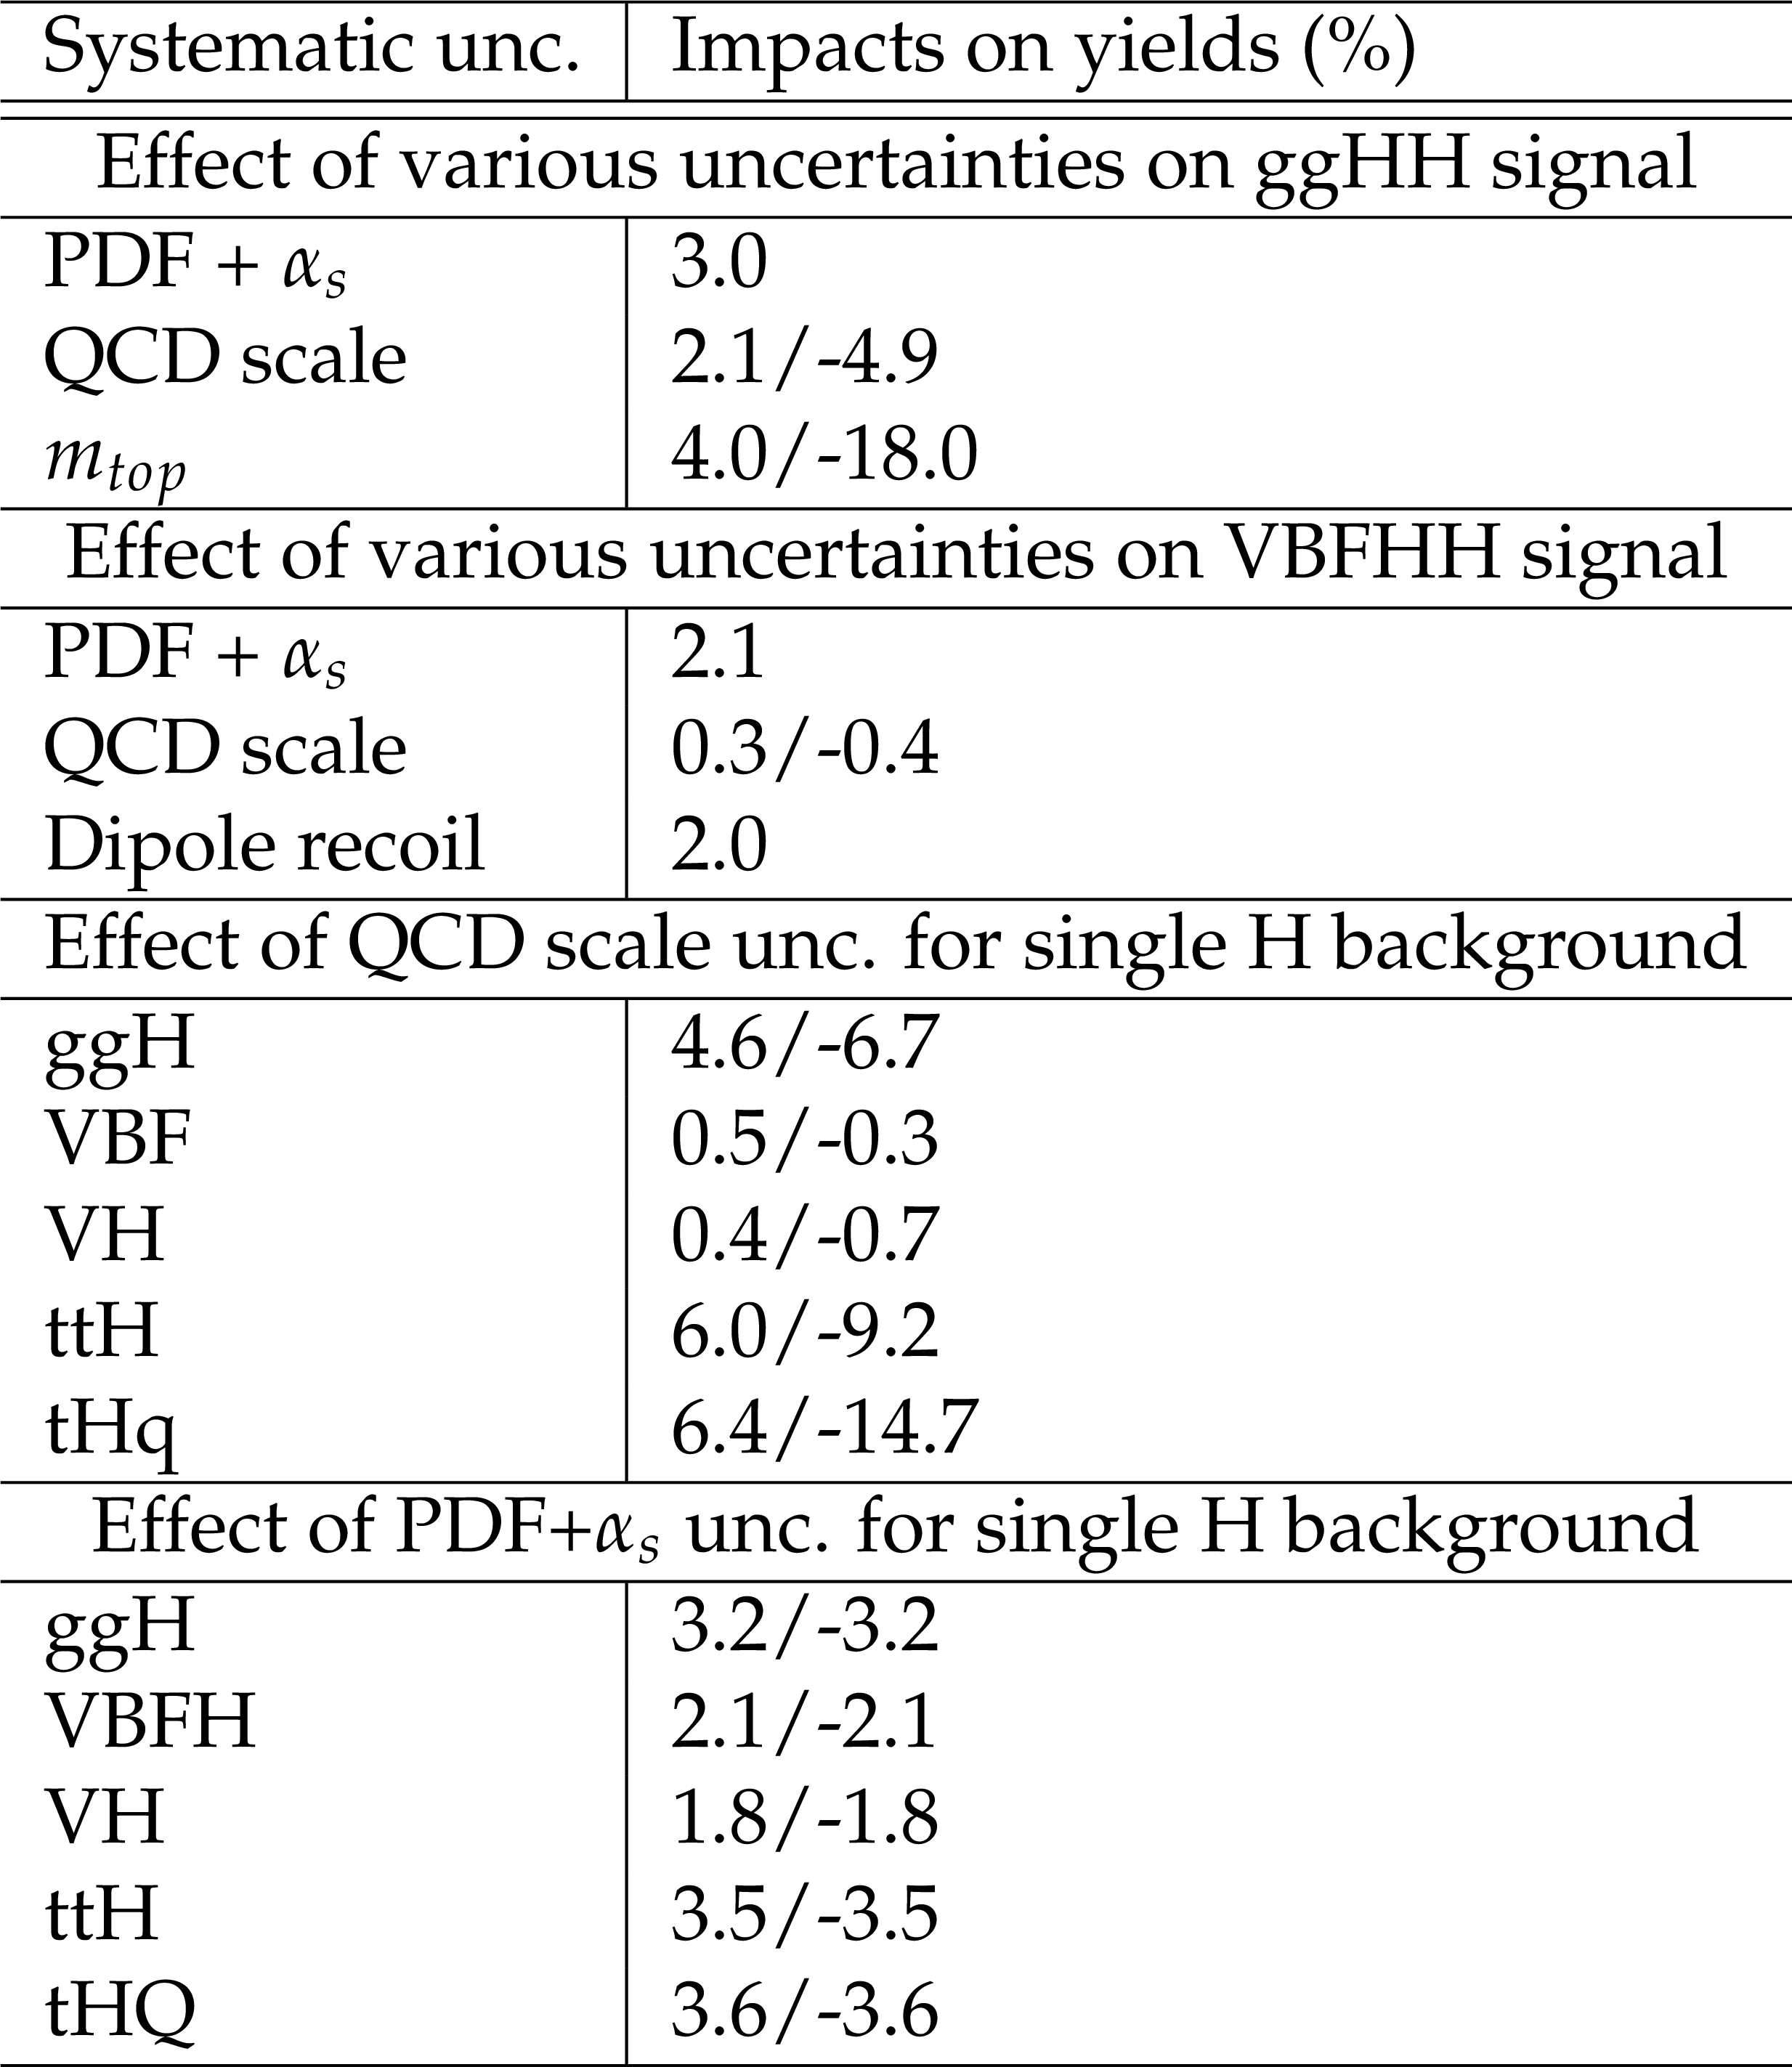
Table 3:
Sources of theoretical uncertainties and impacts on event yields (in %) estimated for the Phase-2 studies and used in this analysis according to CERN Yellow Report IV [34]. |
| Summary |
| The expected signal sensitivity for the standard model production of non-resonant Higgs boson pair in the inclusive bb$\gamma\gamma$ final state is determined to be 2.16$\sigma$. The study has been carried out using Delphes fast simulation of the Phase-2 upgraded CMS detector and corresponding to an average pileup scenario of 200 and integrated luminosity of 3000 fb$^{-1}$ of proton-proton collisions at $\sqrt{s}=$ 14 TeV. Anticipating better analysis techniques and reduced systematic uncertainties, it is expected that the combination of various final states will pave the way for the CMS and ATLAS experiment towards a 5$\sigma$ discovery for the Higgs boson pair production at the HL-LHC. |
| References | ||||
| 1 | U. Baur, T. Plehn, and D. Rainwater | Measuring the Higgs Boson Self-Coupling at the Large Hadron Collider | PRL 89 (Sep, 2002) 151801 | |
| 2 | A. Blondel, A. Clark, and F. Mazzucato | Studies on the measurement of the SM Higgs self-couplings. | ATL-PHYS-2002-029, ATL-COM-PHYS-2002-005, CERN-ATL-PHYS-2002-029, 2 | |
| 3 | F. Gianotti et al. | Physics potential and experimental challenges of the LHC luminosity upgrade | EPJC 39 (2005) 293--333 | hep-ph/0204087 |
| 4 | W. Yao | Studies of measuring Higgs self-coupling with $ HH\rightarrow b\bar b \gamma\gamma $ at the future hadron colliders | in Community Summer Study 2013: Snowmass on the Mississippi 8 | 1308.6302 |
| 5 | Snowmass 2021 | link | ||
| 6 | CMS Collaboration | Search for nonresonant Higgs boson pair production in final states with two bottom quarks and two photons in proton-proton collisions at $ \sqrt{s} = $ 13 TeV | Journal of High Energy Physics 2021 (Mar, 2021) | |
| 7 | CMS Collaboration | Prospects for HH measurements at the HL-LHC | CMS-PAS-FTR-18-019 | CMS-PAS-FTR-18-019 |
| 8 | M. Grazzini et al. | Higgs boson pair production at NNLO with top quark mass effects | Journal of High Energy Physics 2018 (May, 2018) | |
| 9 | F. A. Dreyer and A. Karlberg | Vector-boson fusion Higgs Pair Production at N$ ^3 $LO | PRD 98 (2018), no. 11, 114016 | 1811.07906 |
| 10 | ATLAS Collaboration | Search for Higgs boson pair production in the two bottom quarks plus two photons final state in $ pp $ collisions at $ \sqrt{s}= $ 13 TeV with the ATLAS detector | 2112.11876 | |
| 11 | CMS Collaboration | The CMS Experiment at the CERN LHC | JINST 3 (2008) S08004 | CMS-00-001 |
| 12 | CMS Collaboration | Technical Proposal for the Phase-II Upgrade of the CMS Detector | CMS-PAS-TDR-15-002 | CMS-PAS-TDR-15-002 |
| 13 | CMS Collaboration | The Phase-2 Upgrade of the CMS Tracker | CMS-PAS-TDR-17-001 | CMS-PAS-TDR-17-001 |
| 14 | CMS Collaboration | The Phase-2 Upgrade of the CMS Barrel Calorimeters Technical Design Report | CMS-PAS-TDR-17-002 | CMS-PAS-TDR-17-002 |
| 15 | CMS Collaboration | The Phase-2 Upgrade of the CMS Endcap Calorimeter | CMS-PAS-TDR-17-007 | CMS-PAS-TDR-17-007 |
| 16 | CMS Collaboration | The Phase-2 Upgrade of the CMS Muon Detectors | CMS-PAS-TDR-17-003 | CMS-PAS-TDR-17-003 |
| 17 | CMS Collaboration | A MIP Timing Detector for the CMS Phase-2 Upgrade | CMS-PAS-TDR-19-002 | CMS-PAS-TDR-19-002 |
| 18 | CMS Collaboration | The Phase-2 Upgrade of the CMS Level-1 Trigger | CMS-PAS-TDR-20-001 | CMS-PAS-TDR-20-001 |
| 19 | CMS Collaboration | The Phase-2 Upgrade of the CMS Data Acquisition and High Level Trigger | CDS | |
| 20 | CMS Collaboration | Expected performance of the physics objects with the upgraded CMS detector at the HL-LHC | CDS | |
| 21 | E. Bagnaschi, G. Degrassi, P. Slavich, and A. Vicini | Higgs production via gluon fusion in the POWHEG approach in the SM and in the MSSM | JHEP 02 (2012) 088 | 1111.2854 |
| 22 | G. Heinrich et al. | Probing the trilinear Higgs boson coupling in di-Higgs production at NLO QCD including parton shower effects | JHEP 06 (2019) 066 | 1903.08137 |
| 23 | G. Buchalla et al. | Higgs boson pair production in non-linear Effective Field Theory with full $ m_t $-dependence at NLO QCD | JHEP 09 (2018) 057 | 1806.05162 |
| 24 | J. Alwall et al. | The automated computation of tree-level and next-to-leading order differential cross sections, and their matching to parton shower simulations | JHEP 07 (2014) 079 | 1405.0301 |
| 25 | T. Sjostrand et al. | An introduction to PYTHIA 8.2 | CPC 191 (2015) 159 | 1410.3012 |
| 26 | E. Bothmann et al. | Event generation with Sherpa 2.2 | SciPost Physics 7 (Sep, 2019) | |
| 27 | J. de Favereau et al. | Delphes 3: a modular framework for fast simulation of a generic collider experiment | Journal of High Energy Physics 2014 (Feb, 2014) | |
| 28 | CMS Collaboration | Pileup mitigation at CMS in 13 TeV data | JINST 15 (2020), no. 09, P09018 | CMS-JME-18-001 2003.00503 |
| 29 | M. Cacciari, G. P. Salam, and G. Soyez | The anti-$ {k_{\mathrm{T}}} $ jet clustering algorithm | JHEP 04 (2008) 063 | 0802.1189 |
| 30 | CMS Collaboration | Performance of the DeepJet b tagging algorithm using 41.9/fb of data from proton-proton collisions at 13TeV with Phase 1 CMS detector | CDS | |
| 31 | E. Bols et al. | Jet Flavour Classification Using DeepJet | JINST 15 (2020), no. 12, P12012 | 2008.10519 |
| 32 | A. Hoecker and et al. | TMVA - Toolkit for Multivariate Data Analysis | technical report | 0703039 |
| 33 | S. Bolognesi et al. | On the spin and parity of a single-produced resonance at the LHC | PRD 86 (2012) 095031 | 1208.4018 |
| 34 | LHC Higgs Cross Section Working Group Collaboration | CERN Yellow Reports: Monographs | CERN, 2016 | |
|
|
Compact Muon Solenoid LHC, CERN |
|

|

|

|

|

|