

Compact Muon Solenoid
LHC, CERN
| CMS-PAS-LUM-16-001 | ||
| CMS luminosity calibration for the pp reference run at $\sqrt{s}= $ 5.02 TeV | ||
| CMS Collaboration | ||
| December 2016 | ||
| Abstract: The measurement of the integrated luminosity delivered to the CMS Experiment during the very first LHC proton-proton run at 5.02 TeV center-of-mass energy is presented. The Pixel Cluster Counting method is used and the absolute luminosity scale calibration is derived from an analysis of Van der Meer Scans performed in November 2015. The overall uncertainty on the luminosity measurement is 2.3%. The time stability of such calibrations is also studied and taken into account for the final systematic uncertainty. | ||
| Links: CDS record (PDF) ; inSPIRE record ; CADI line (restricted) ; | ||
| Figures | |
png pdf |
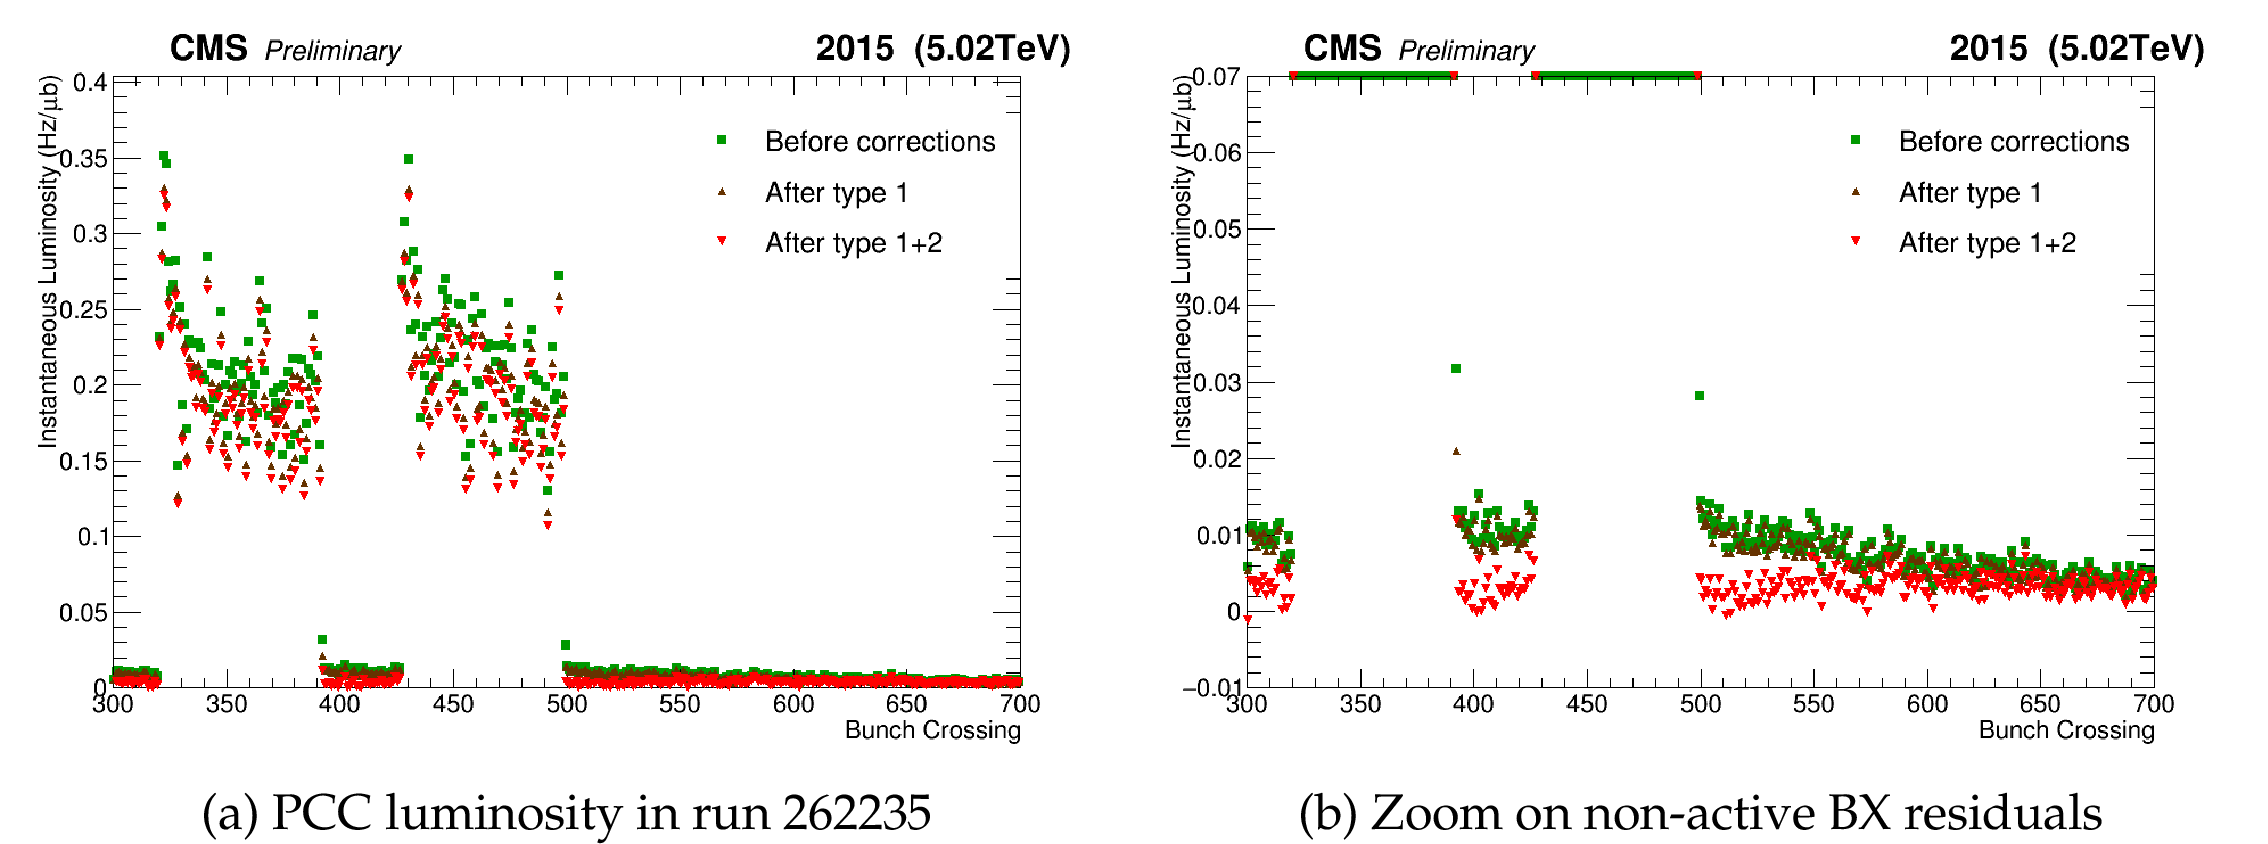
Figure 1:
Instantaneous luminosity as a function of bunch crossing, showing the impact of type 1 and type 2 corrections. |

png |
Figure 1-a:
Instantaneous luminosity as a function of bunch crossing, showing the impact of type 1 and type 2 corrections. |

png |
Figure 1-b:
Instantaneous luminosity as a function of bunch crossing, showing the impact of type 1 and type 2 corrections. |
png pdf |
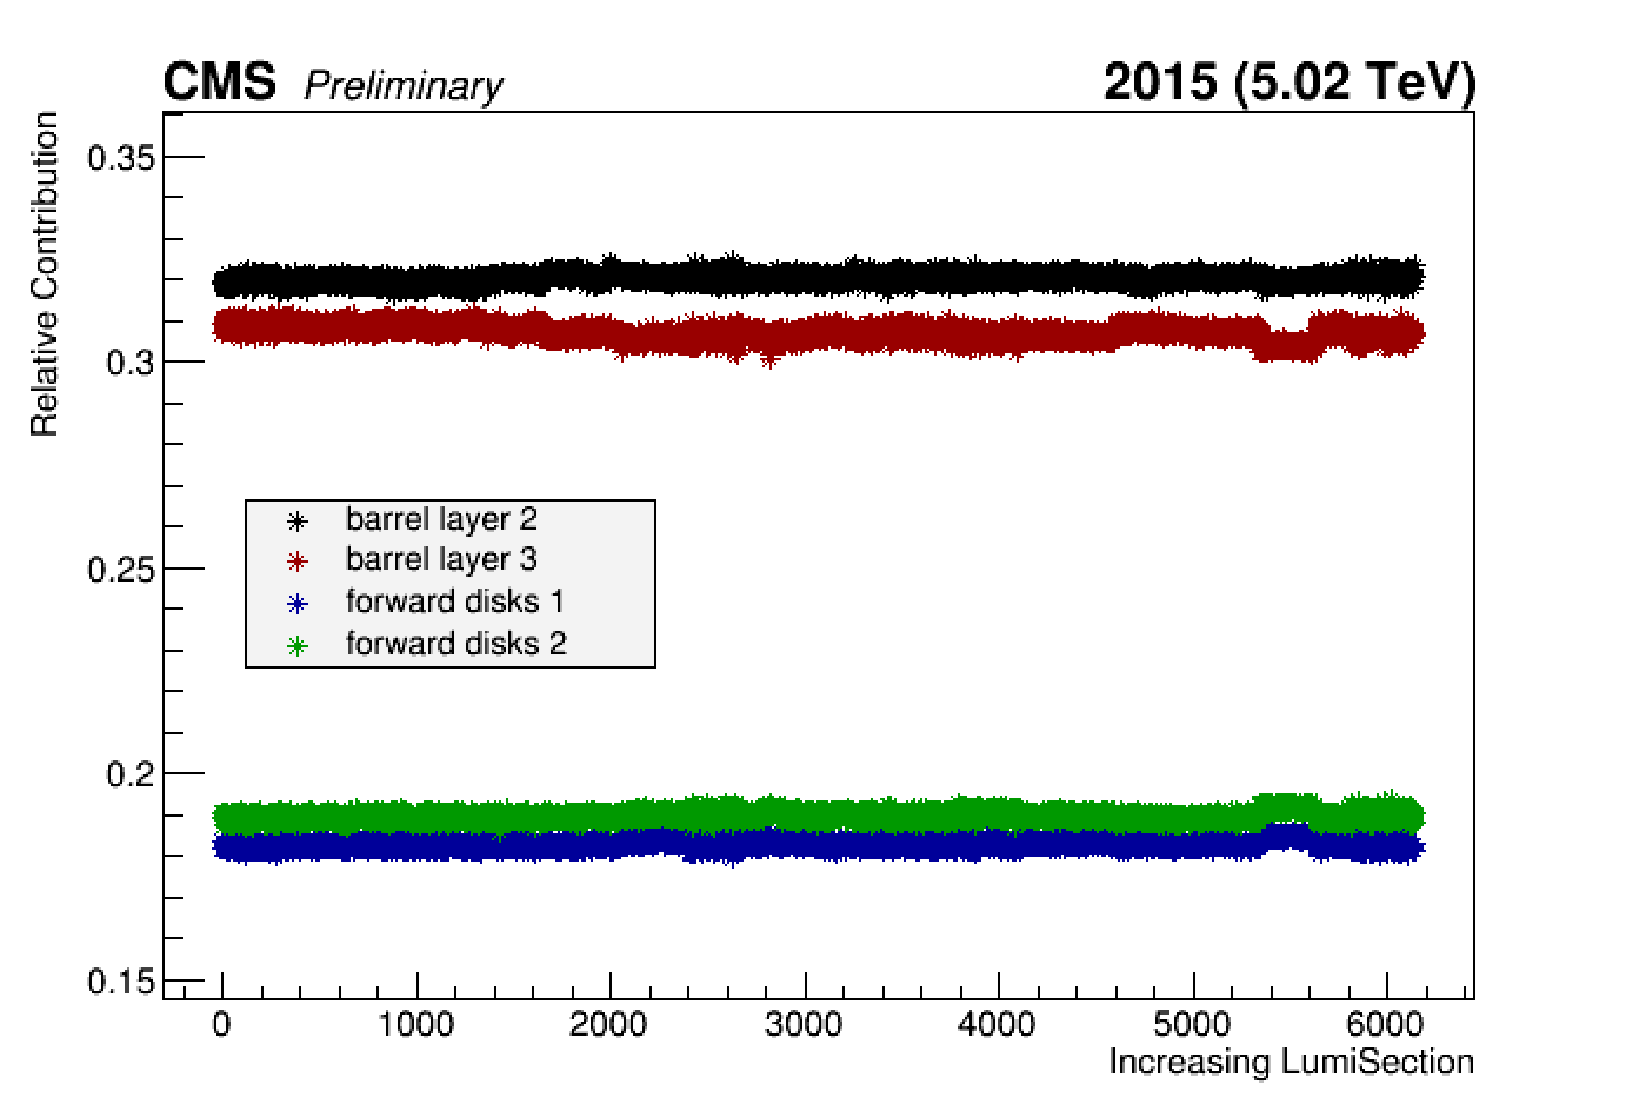
Figure 2:
The relative contributions in percentage of the different pixel layers for the entire November 2015 data-taking period. Note that the innermost pixel layer is excluded from the PCC rate measurements. Only periods where the CMS detector was fully operational were considered. |

png pdf |
Figure 3:
Horizontal and vertical beam displacements, measured with the DOROS BPMs, during the VdM scan campaign on November 2015 . The displacement is set to zero at the beginning of the Fill. Scans that were excluded from the PCC measurement are marked with purple. |
png pdf |
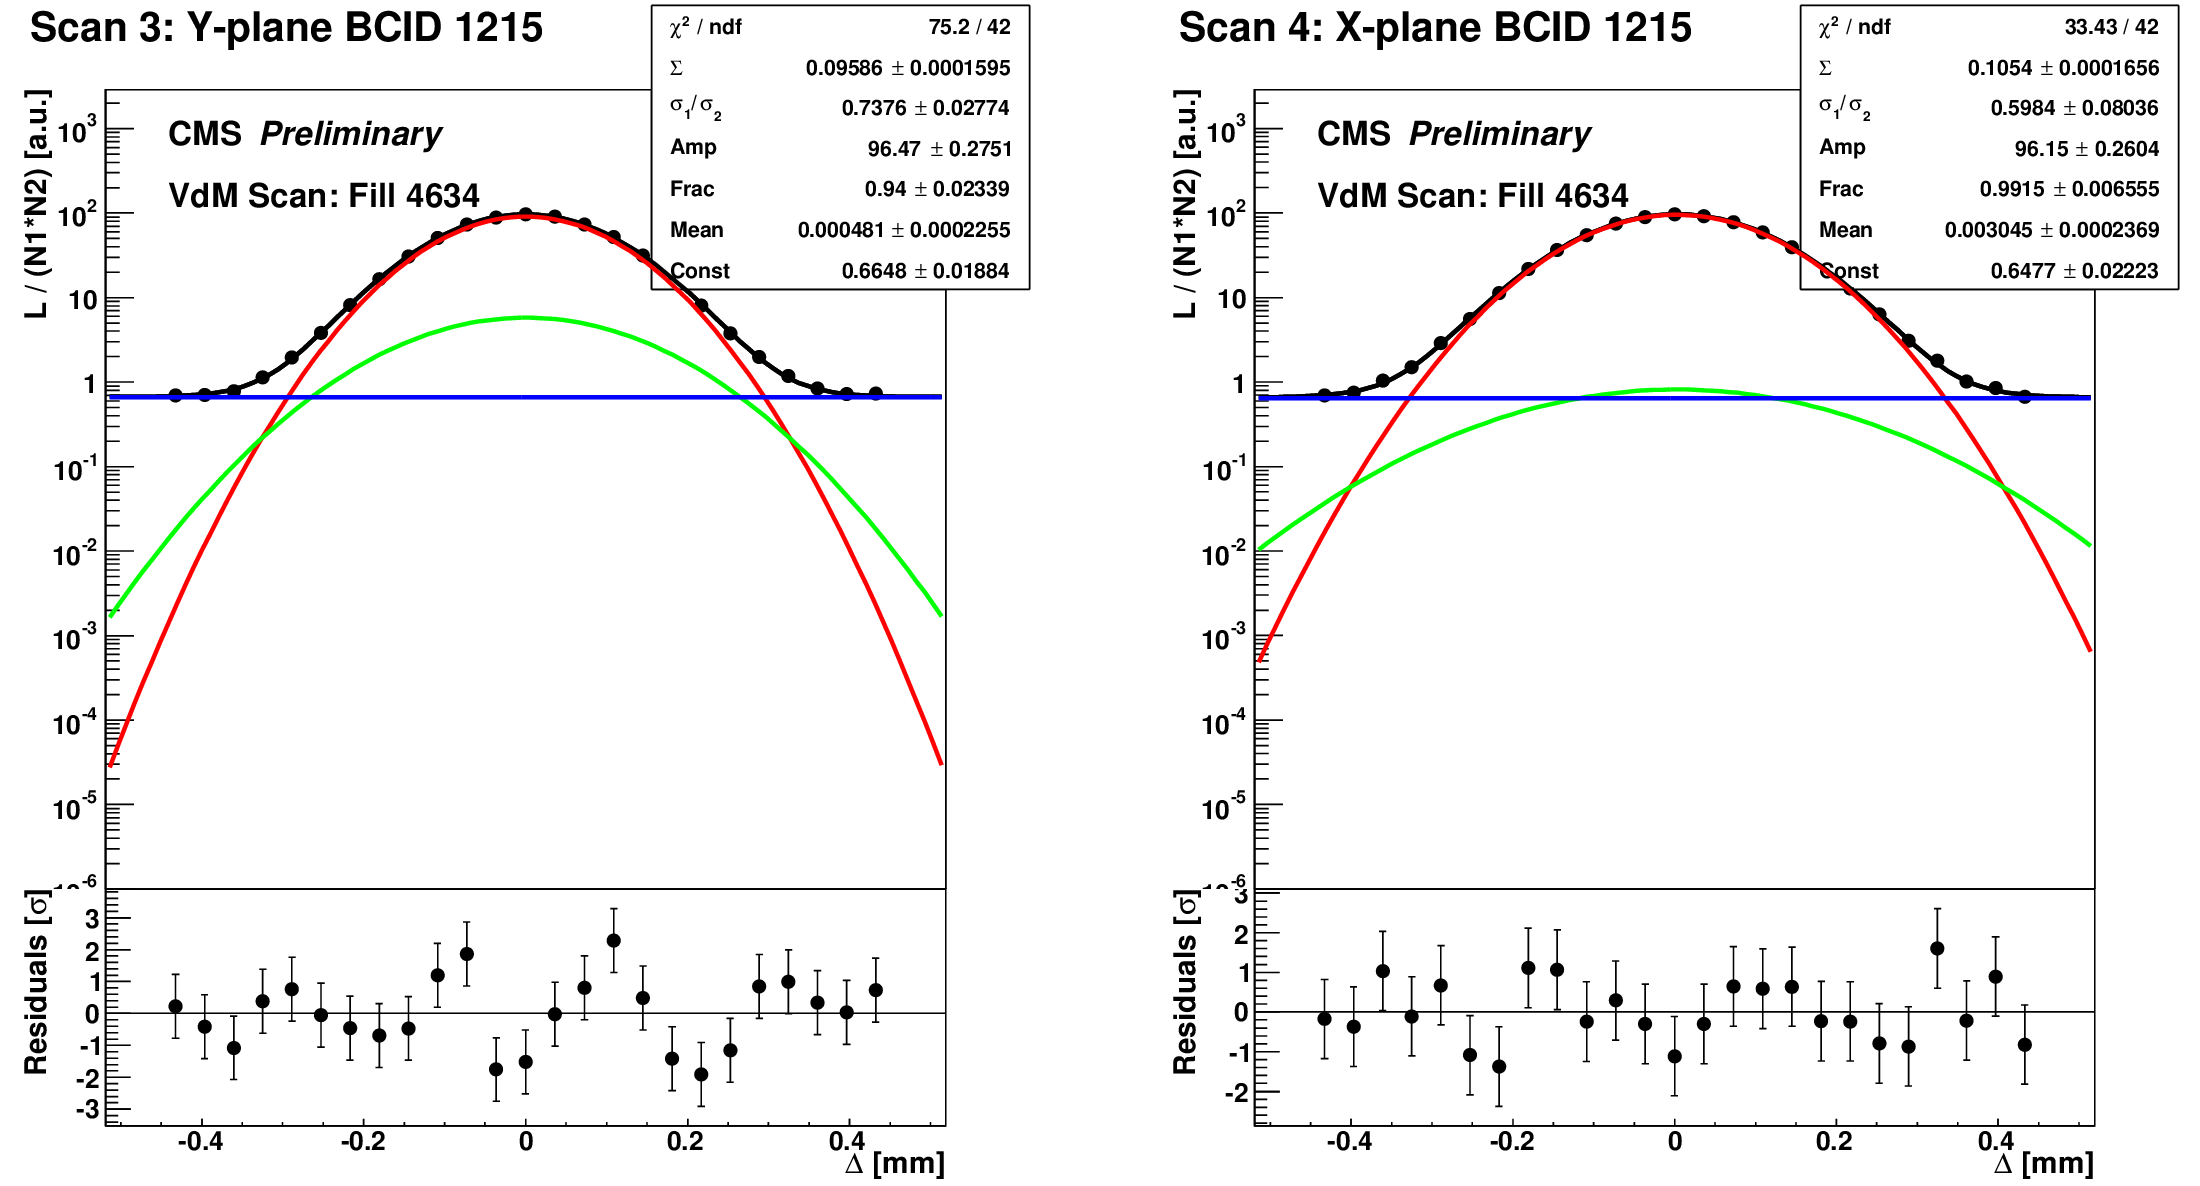
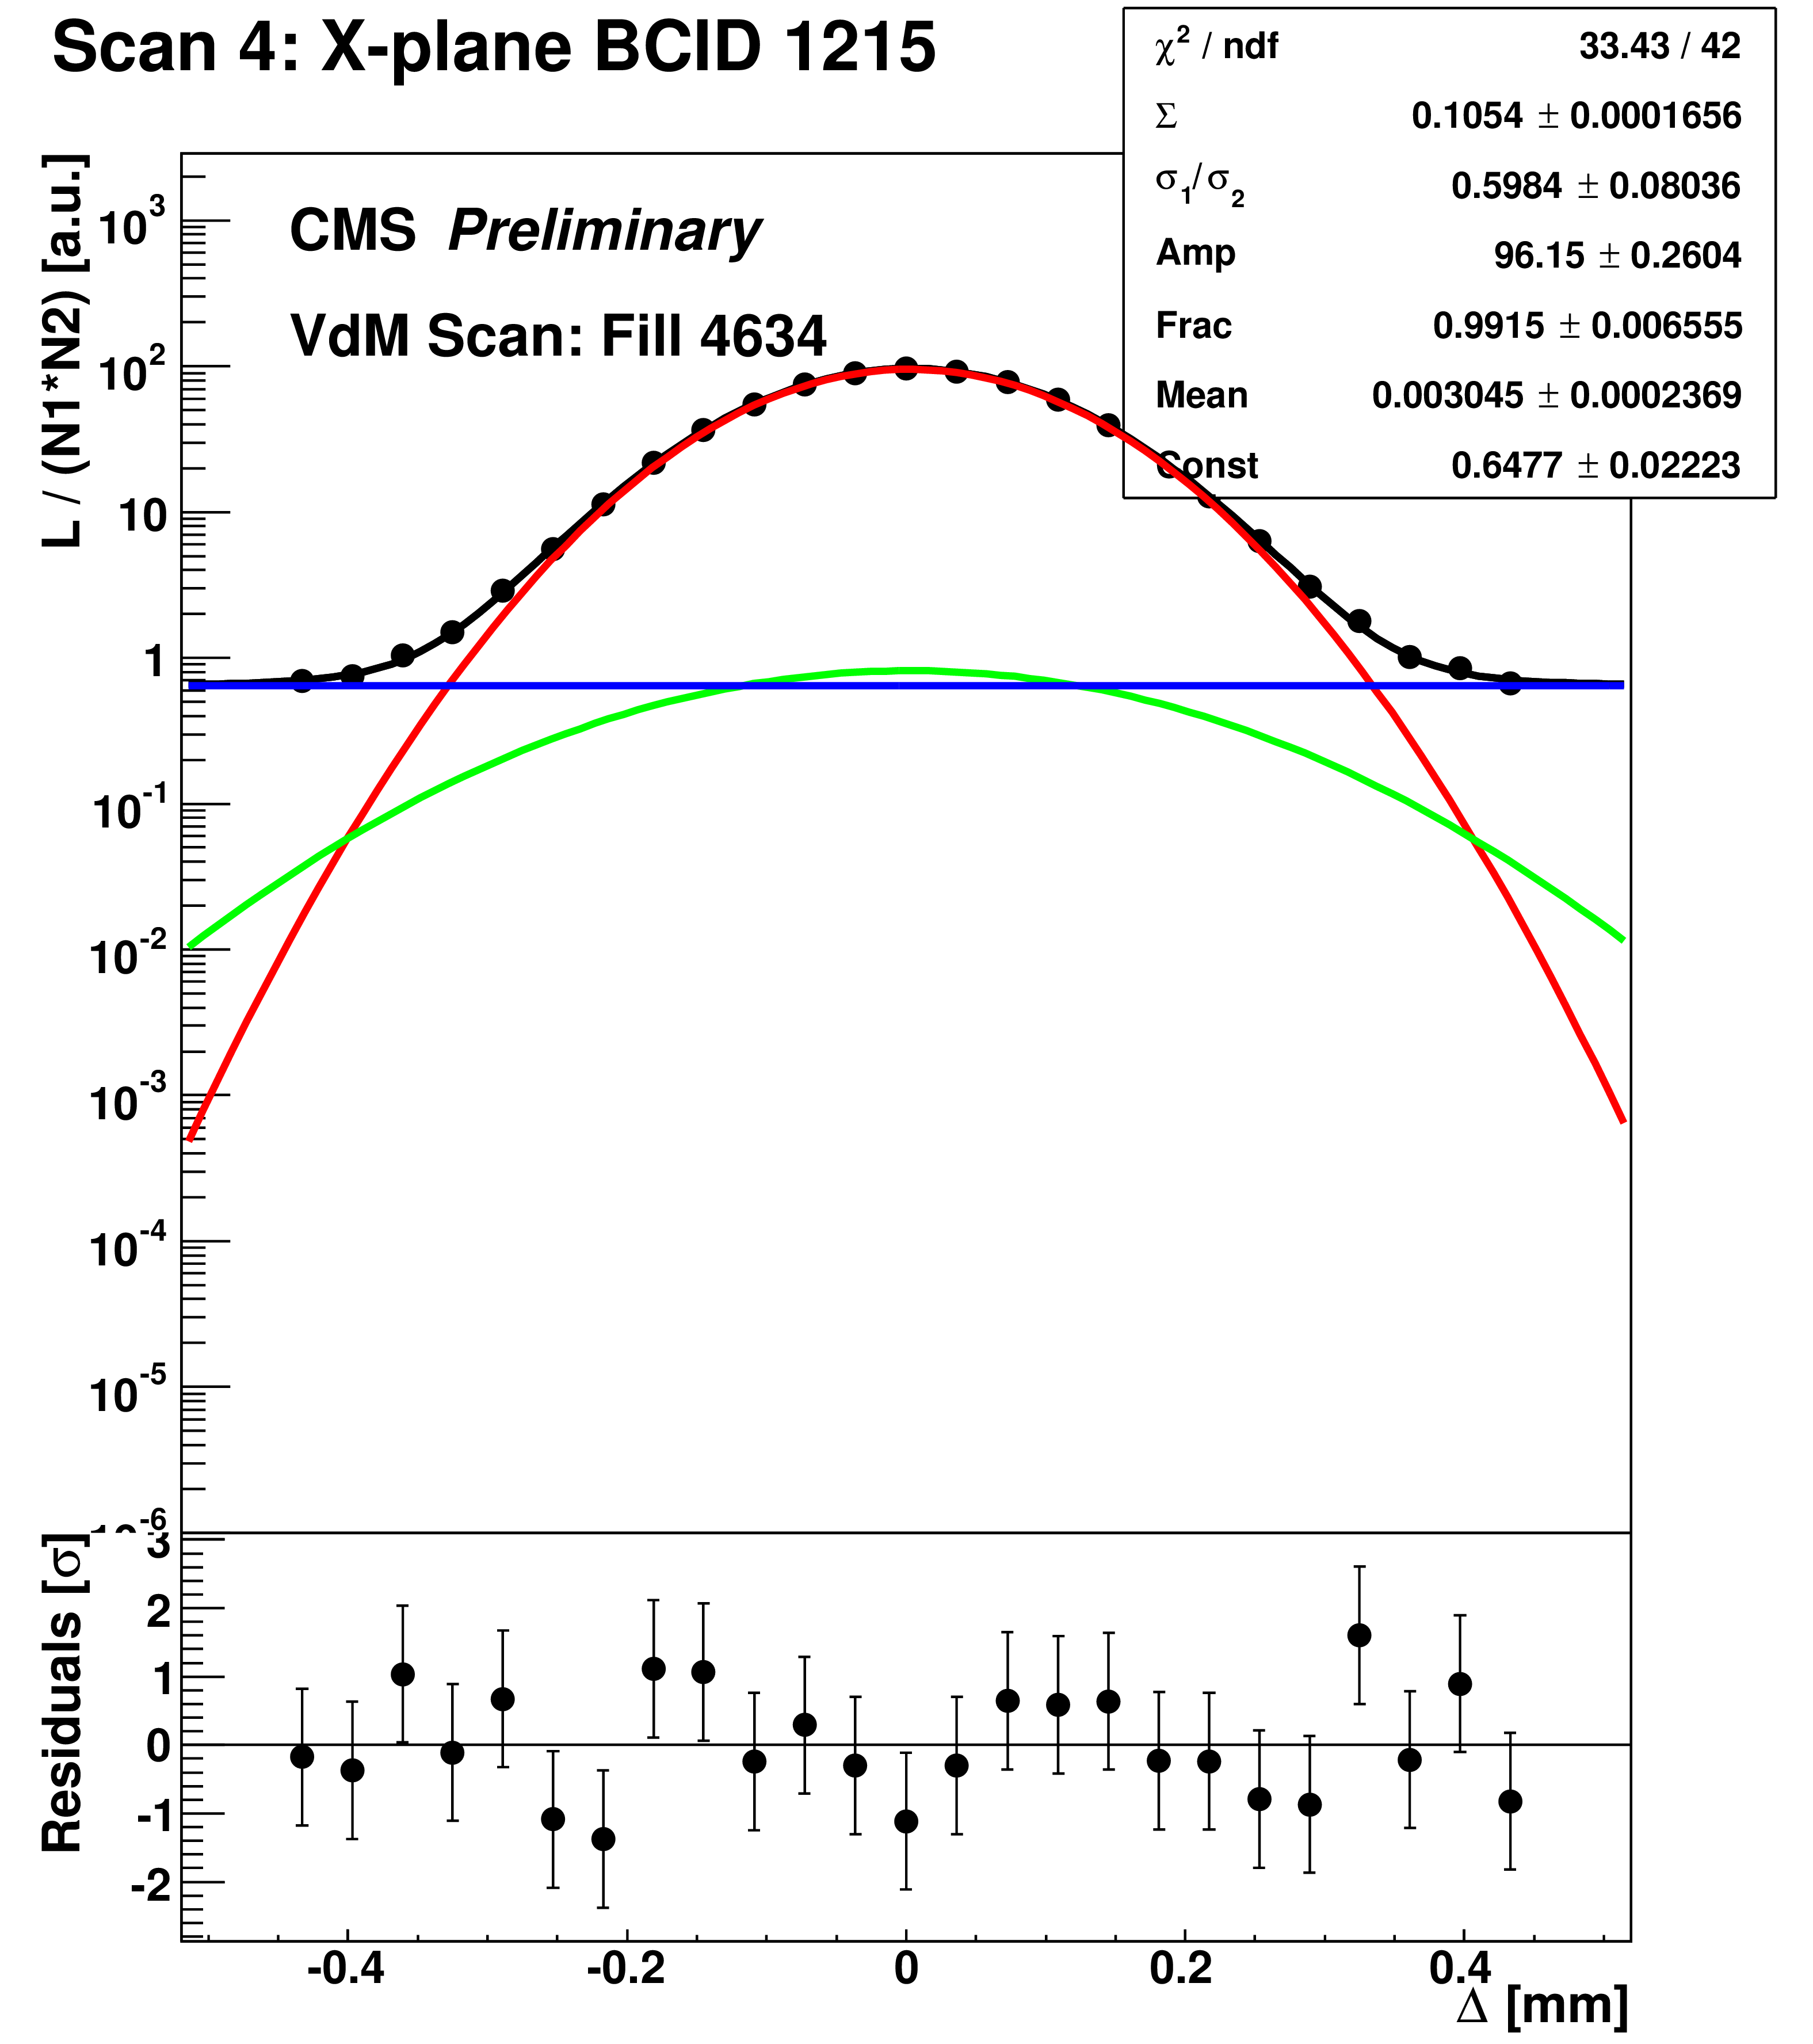
Figure 4:
Fitted scan curves recorded by PCC during $Y_3$ (left) and $X_3$ (right). |

png pdf |
Figure 4-a:
Fitted scan curves recorded by PCC during $Y_3$ (left) and $X_3$ (right). |
png pdf |
Figure 4-b:
Fitted scan curves recorded by PCC during $Y_3$ (left) and $X_3$ (right). |

png pdf |
Figure 5:
Fitted scan curves of the Vertex Counting rates during $Y_3$ (left) and $X_3$ (right). |

png pdf |
Figure 5-a:
Fitted scan curves of the Vertex Counting rates during $Y_3$ (left) and $X_3$ (right). |

png pdf |
Figure 5-b:
Fitted scan curves of the Vertex Counting rates during $Y_3$ (left) and $X_3$ (right). |

png pdf |
Figure 6:
The fitted $\Sigma _{x/y}$ (a,b) as a function of BCID (a) and Scan sequence (b). |

png pdf |
Figure 6-a:
The fitted $\Sigma _{x/y}$ (a,b) as a function of BCID (a) and Scan sequence (b). |

png pdf |
Figure 6-b:
The fitted $\Sigma _{x/y}$ (a,b) as a function of BCID (a) and Scan sequence (b). |

png pdf |
Figure 7:
a) The weighted average of PCC visible cross sections per BCID. b) The resulting cross sections with statistical error for all BCID measured over all scans. c) The weighted average of PCC visible cross sections per scan. |

png pdf |
Figure 7-a:
a) The weighted average of PCC visible cross sections per BCID. b) The resulting cross sections with statistical error for all BCID measured over all scans. c) The weighted average of PCC visible cross sections per scan. |
png pdf |
Figure 7-b:
a) The weighted average of PCC visible cross sections per BCID. b) The resulting cross sections with statistical error for all BCID measured over all scans. c) The weighted average of PCC visible cross sections per scan. |

png pdf |
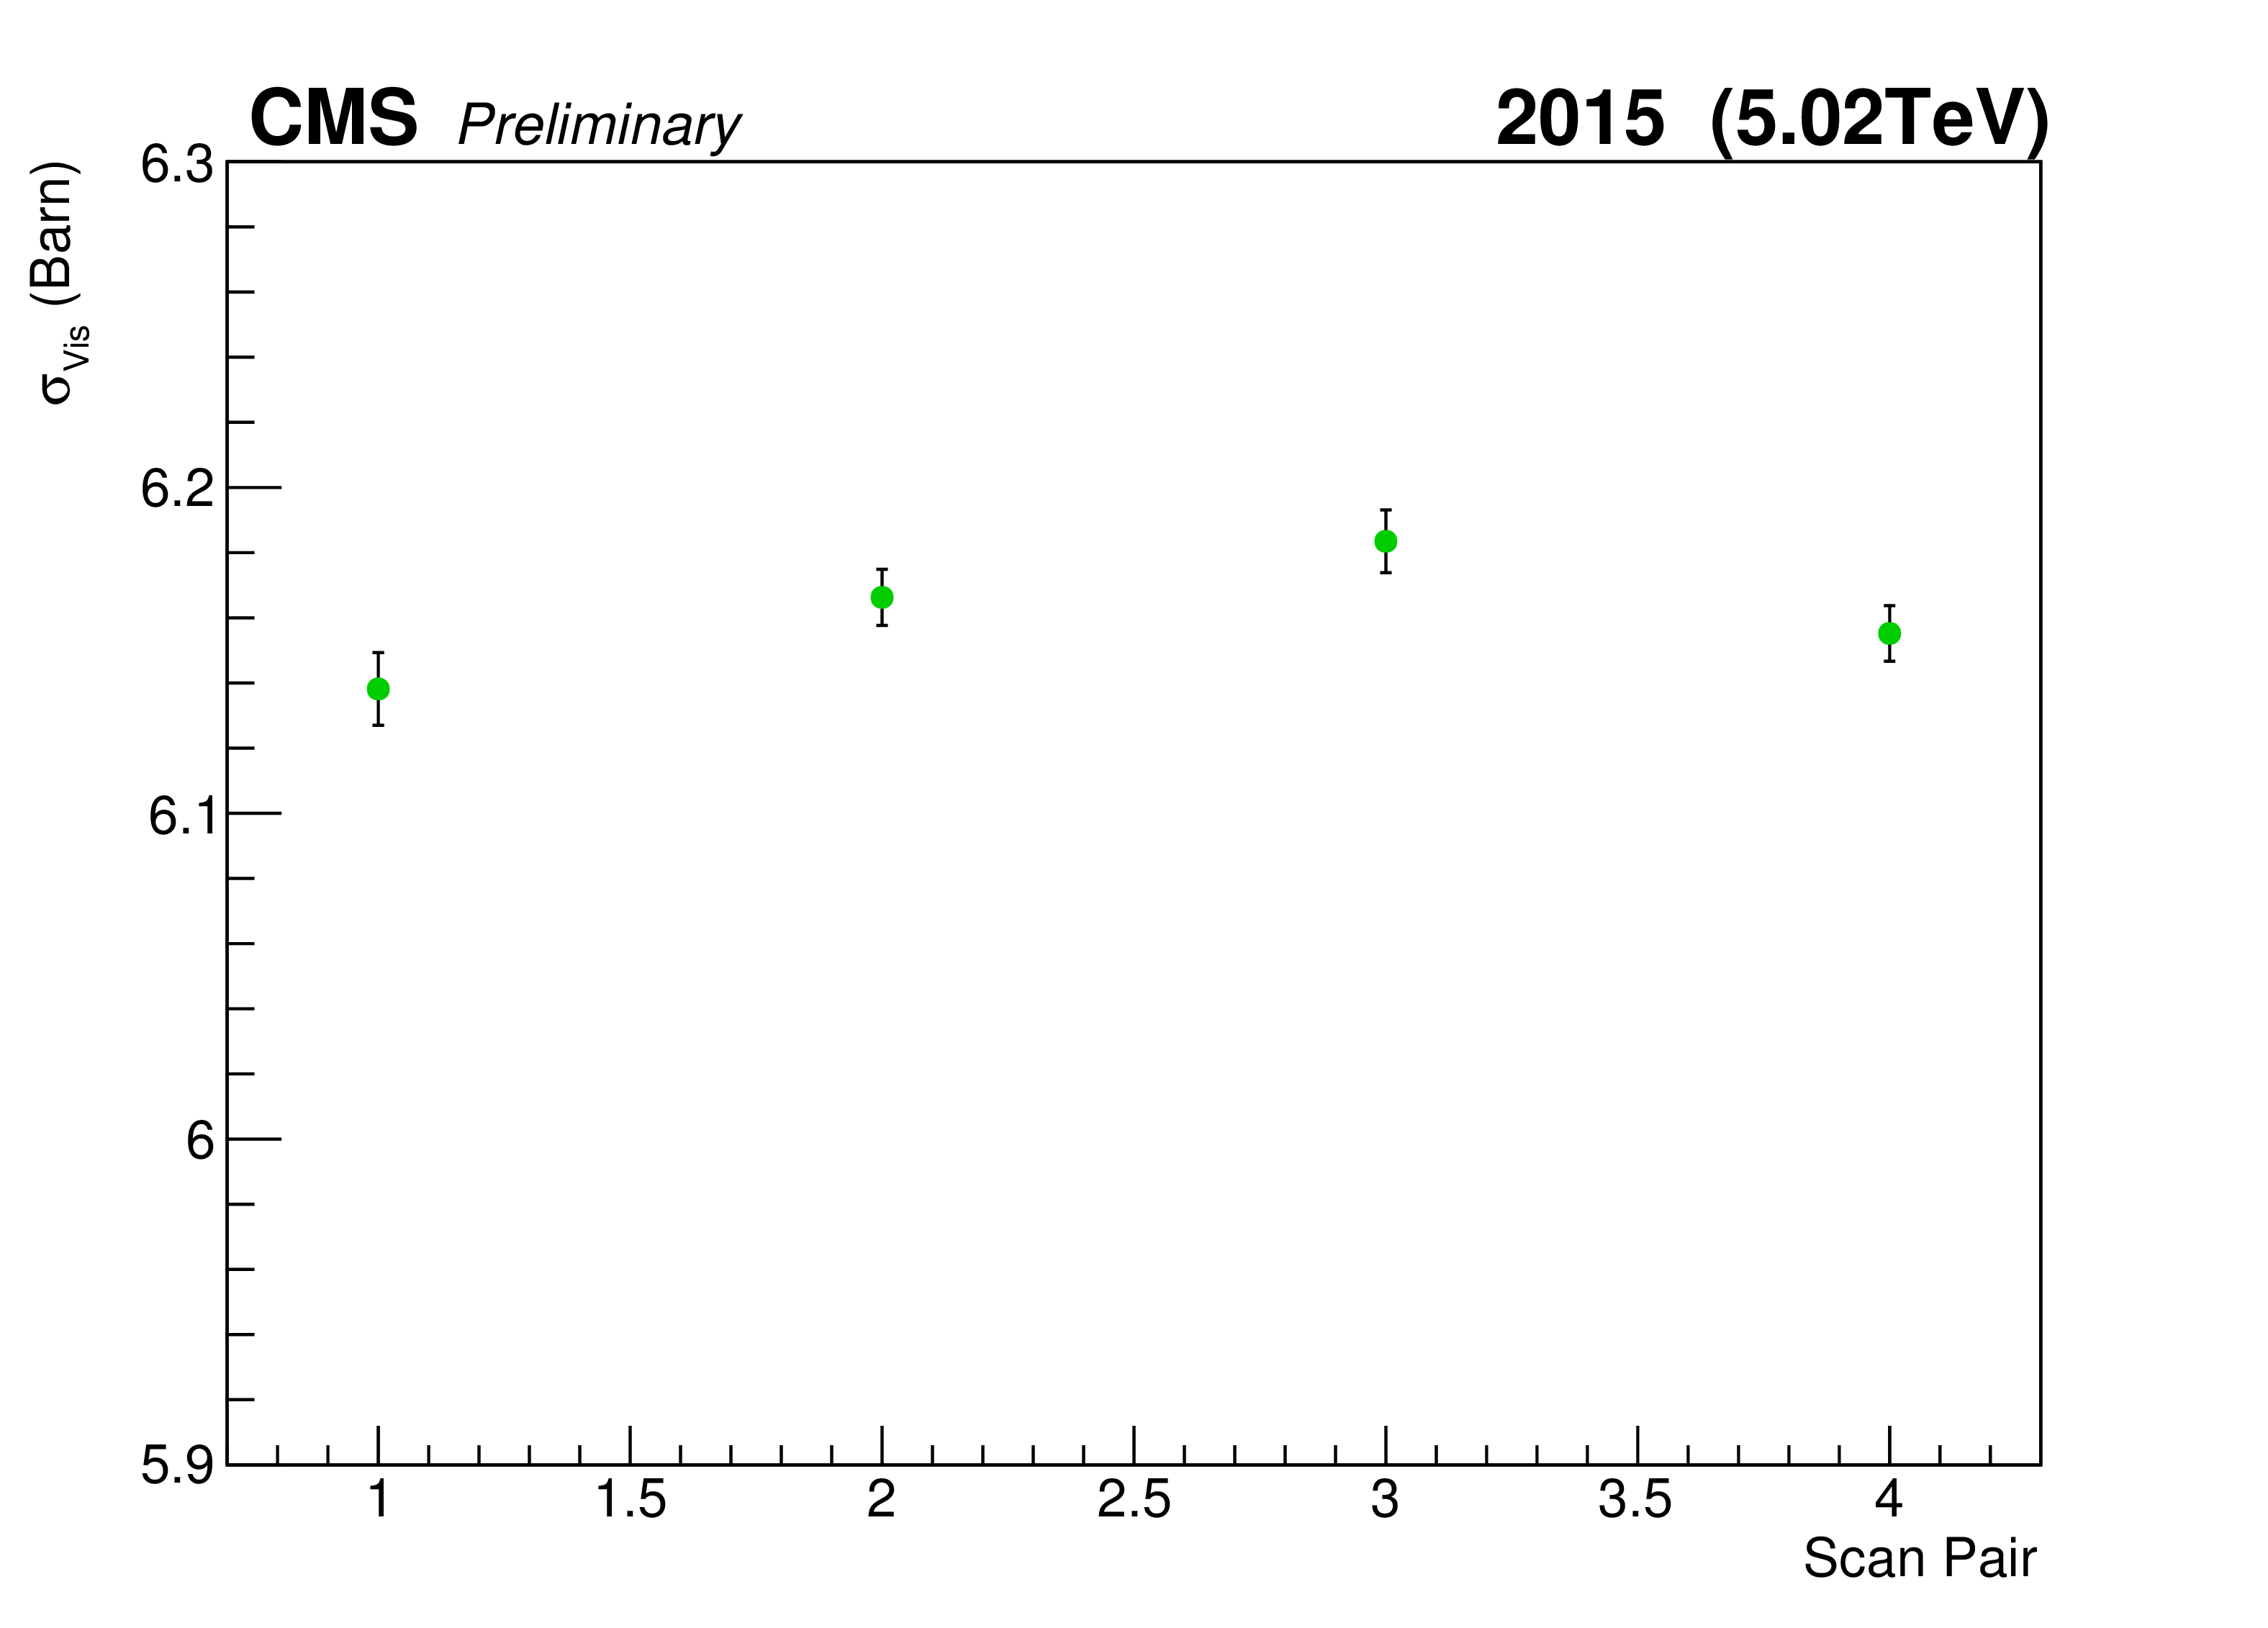
Figure 7-c:
a) The weighted average of PCC visible cross sections per BCID. b) The resulting cross sections with statistical error for all BCID measured over all scans. c) The weighted average of PCC visible cross sections per scan. |
png pdf |
Figure 8:
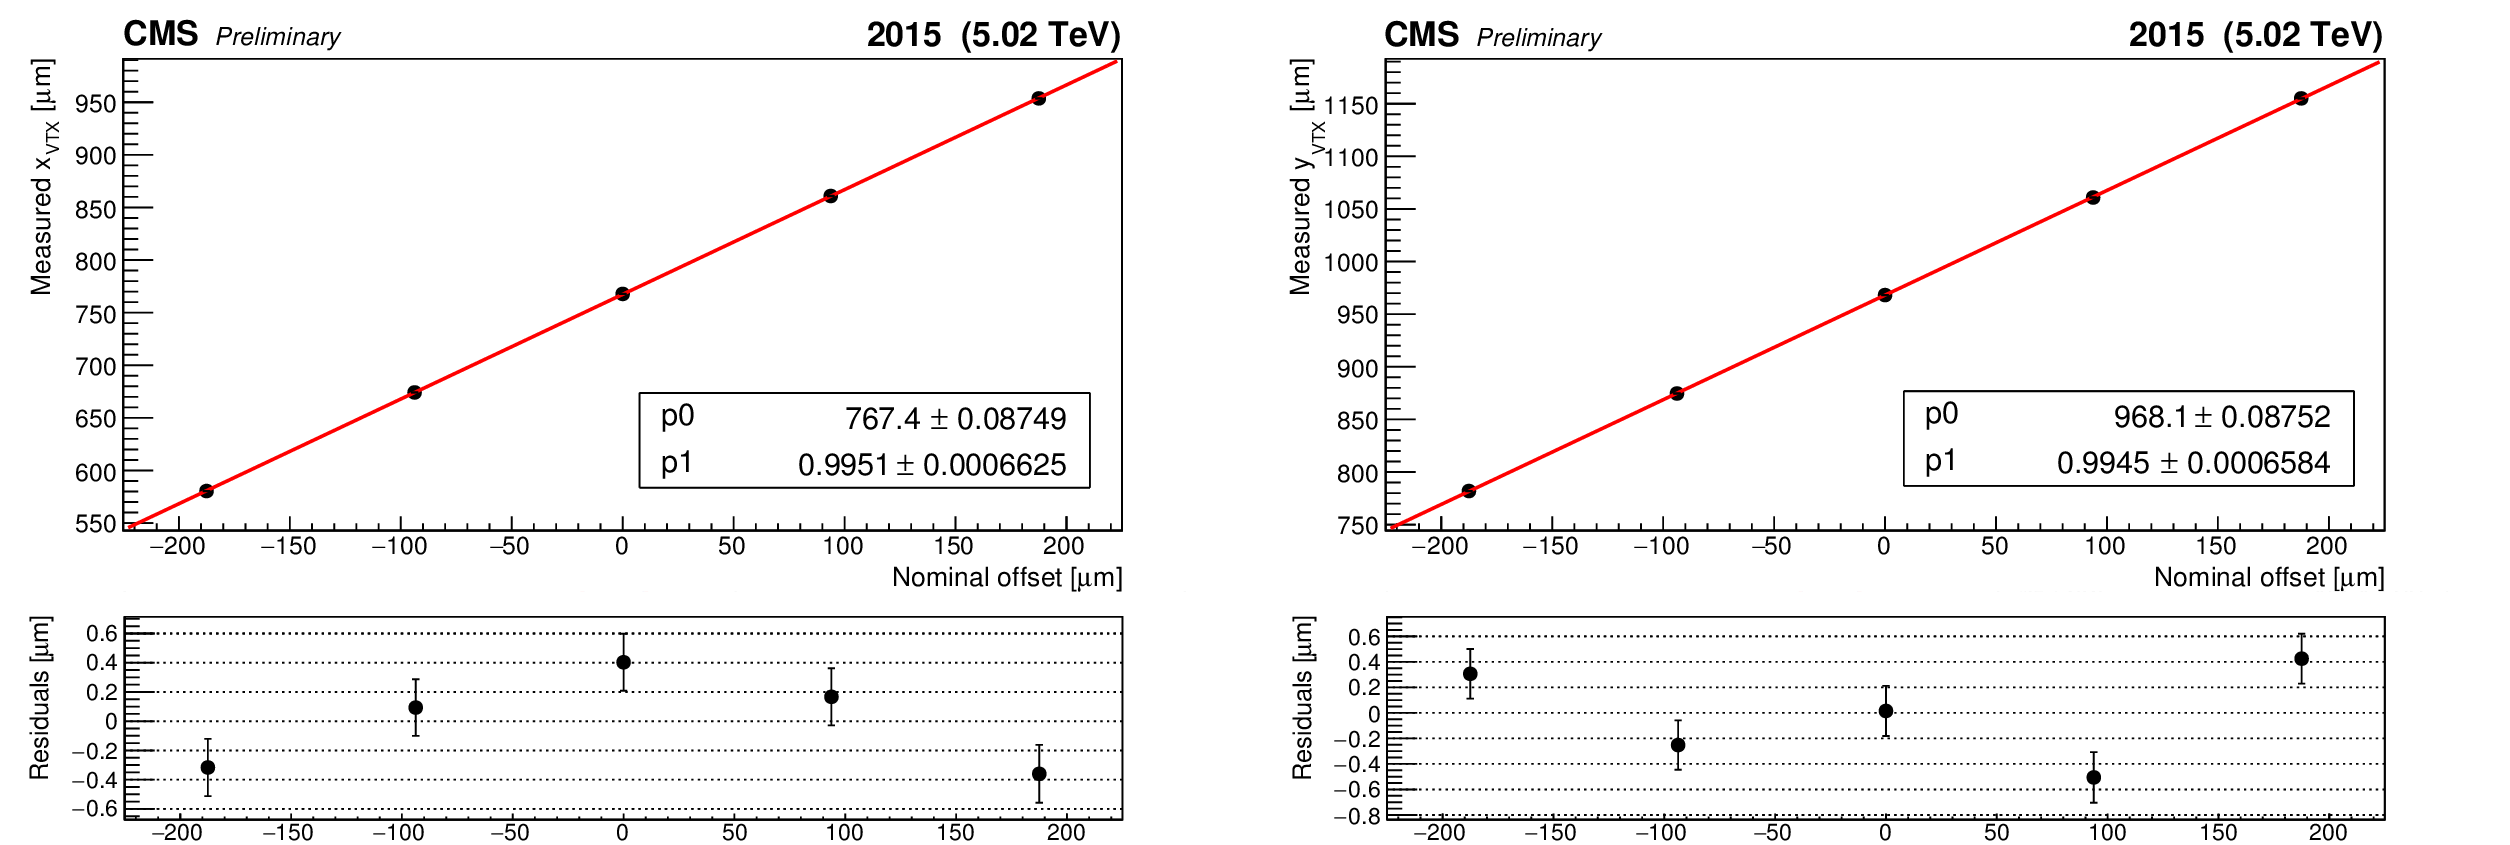
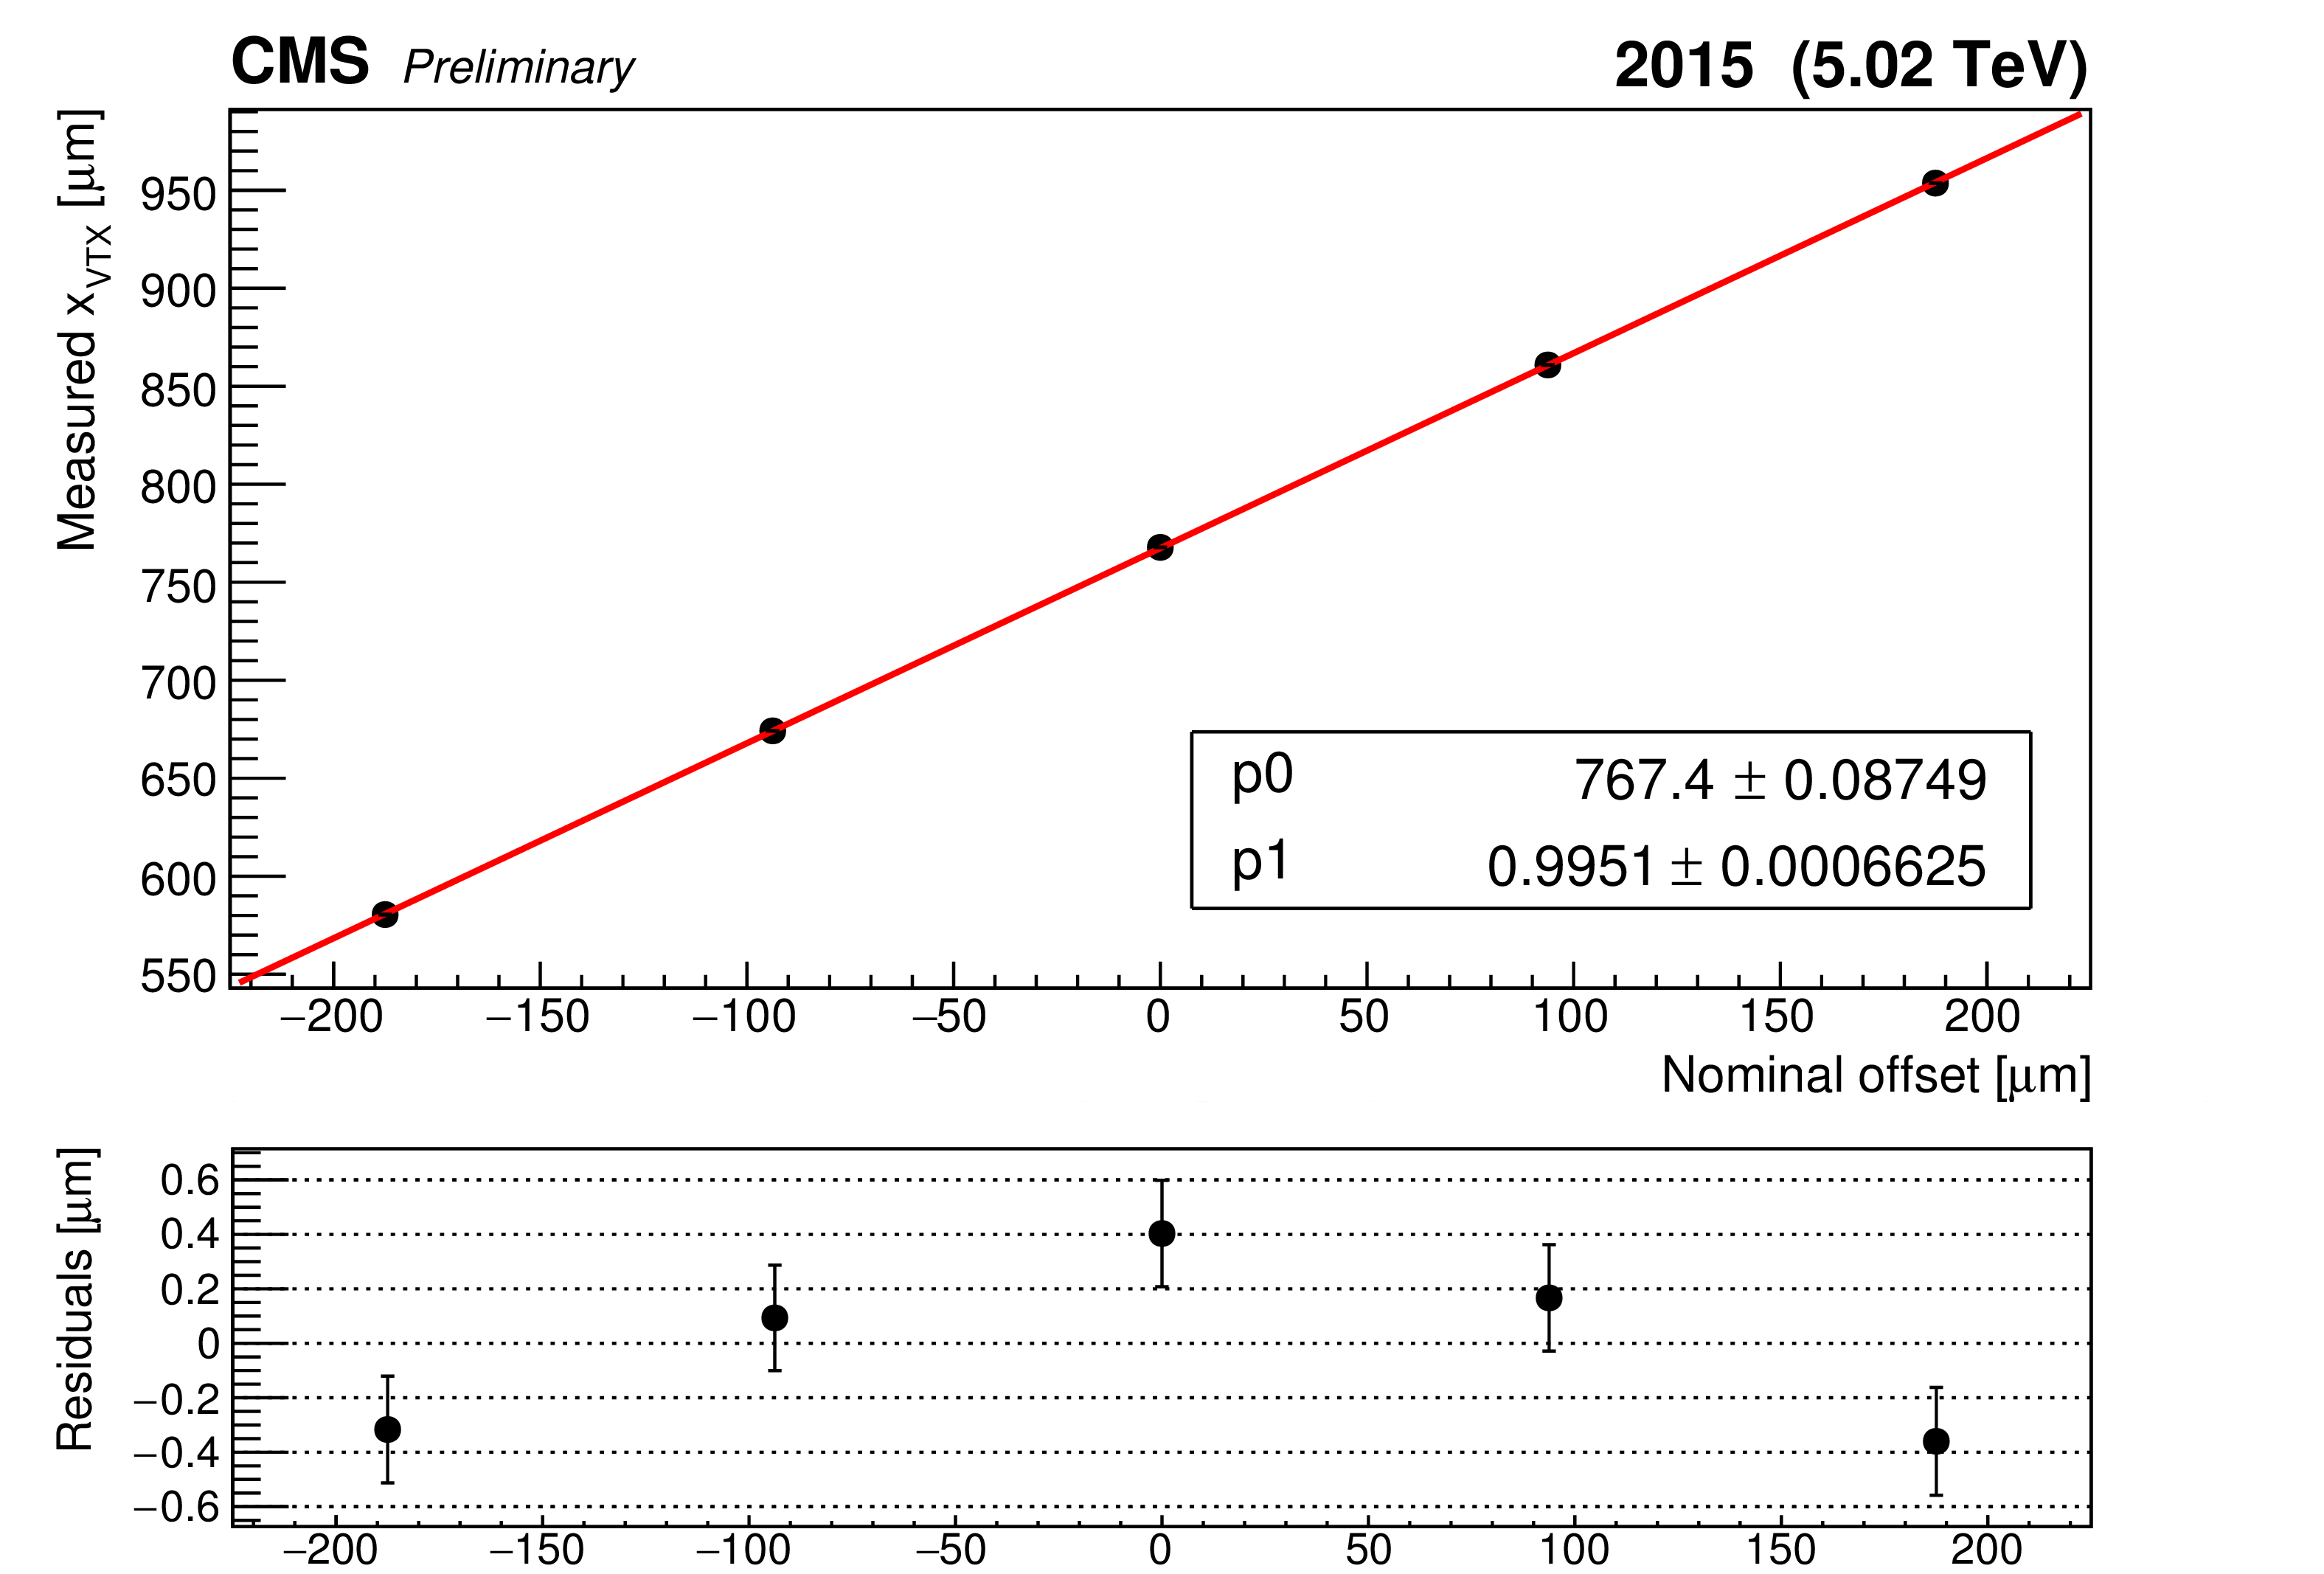
Examples of the measured beam spot positions as a function of the beam centroid offsets are shown for a horizontal (left) and a vertical (right) LSC scans. The points are fitted with a straight line to derive the LSC calibration constant. |
png pdf |
Figure 8-a:
Examples of the measured beam spot positions as a function of the beam centroid offsets are shown for a horizontal (left) and a vertical (right) LSC scans. The points are fitted with a straight line to derive the LSC calibration constant. |

png pdf |
Figure 8-b:
Examples of the measured beam spot positions as a function of the beam centroid offsets are shown for a horizontal (left) and a vertical (right) LSC scans. The points are fitted with a straight line to derive the LSC calibration constant. |

png pdf |
Figure 9:
Difference of the two vertical and horizontal beam orbits from before and after each scan as measured by the DOROS BPM in ${ \mu \text {m}}$ is shown. |
png pdf |
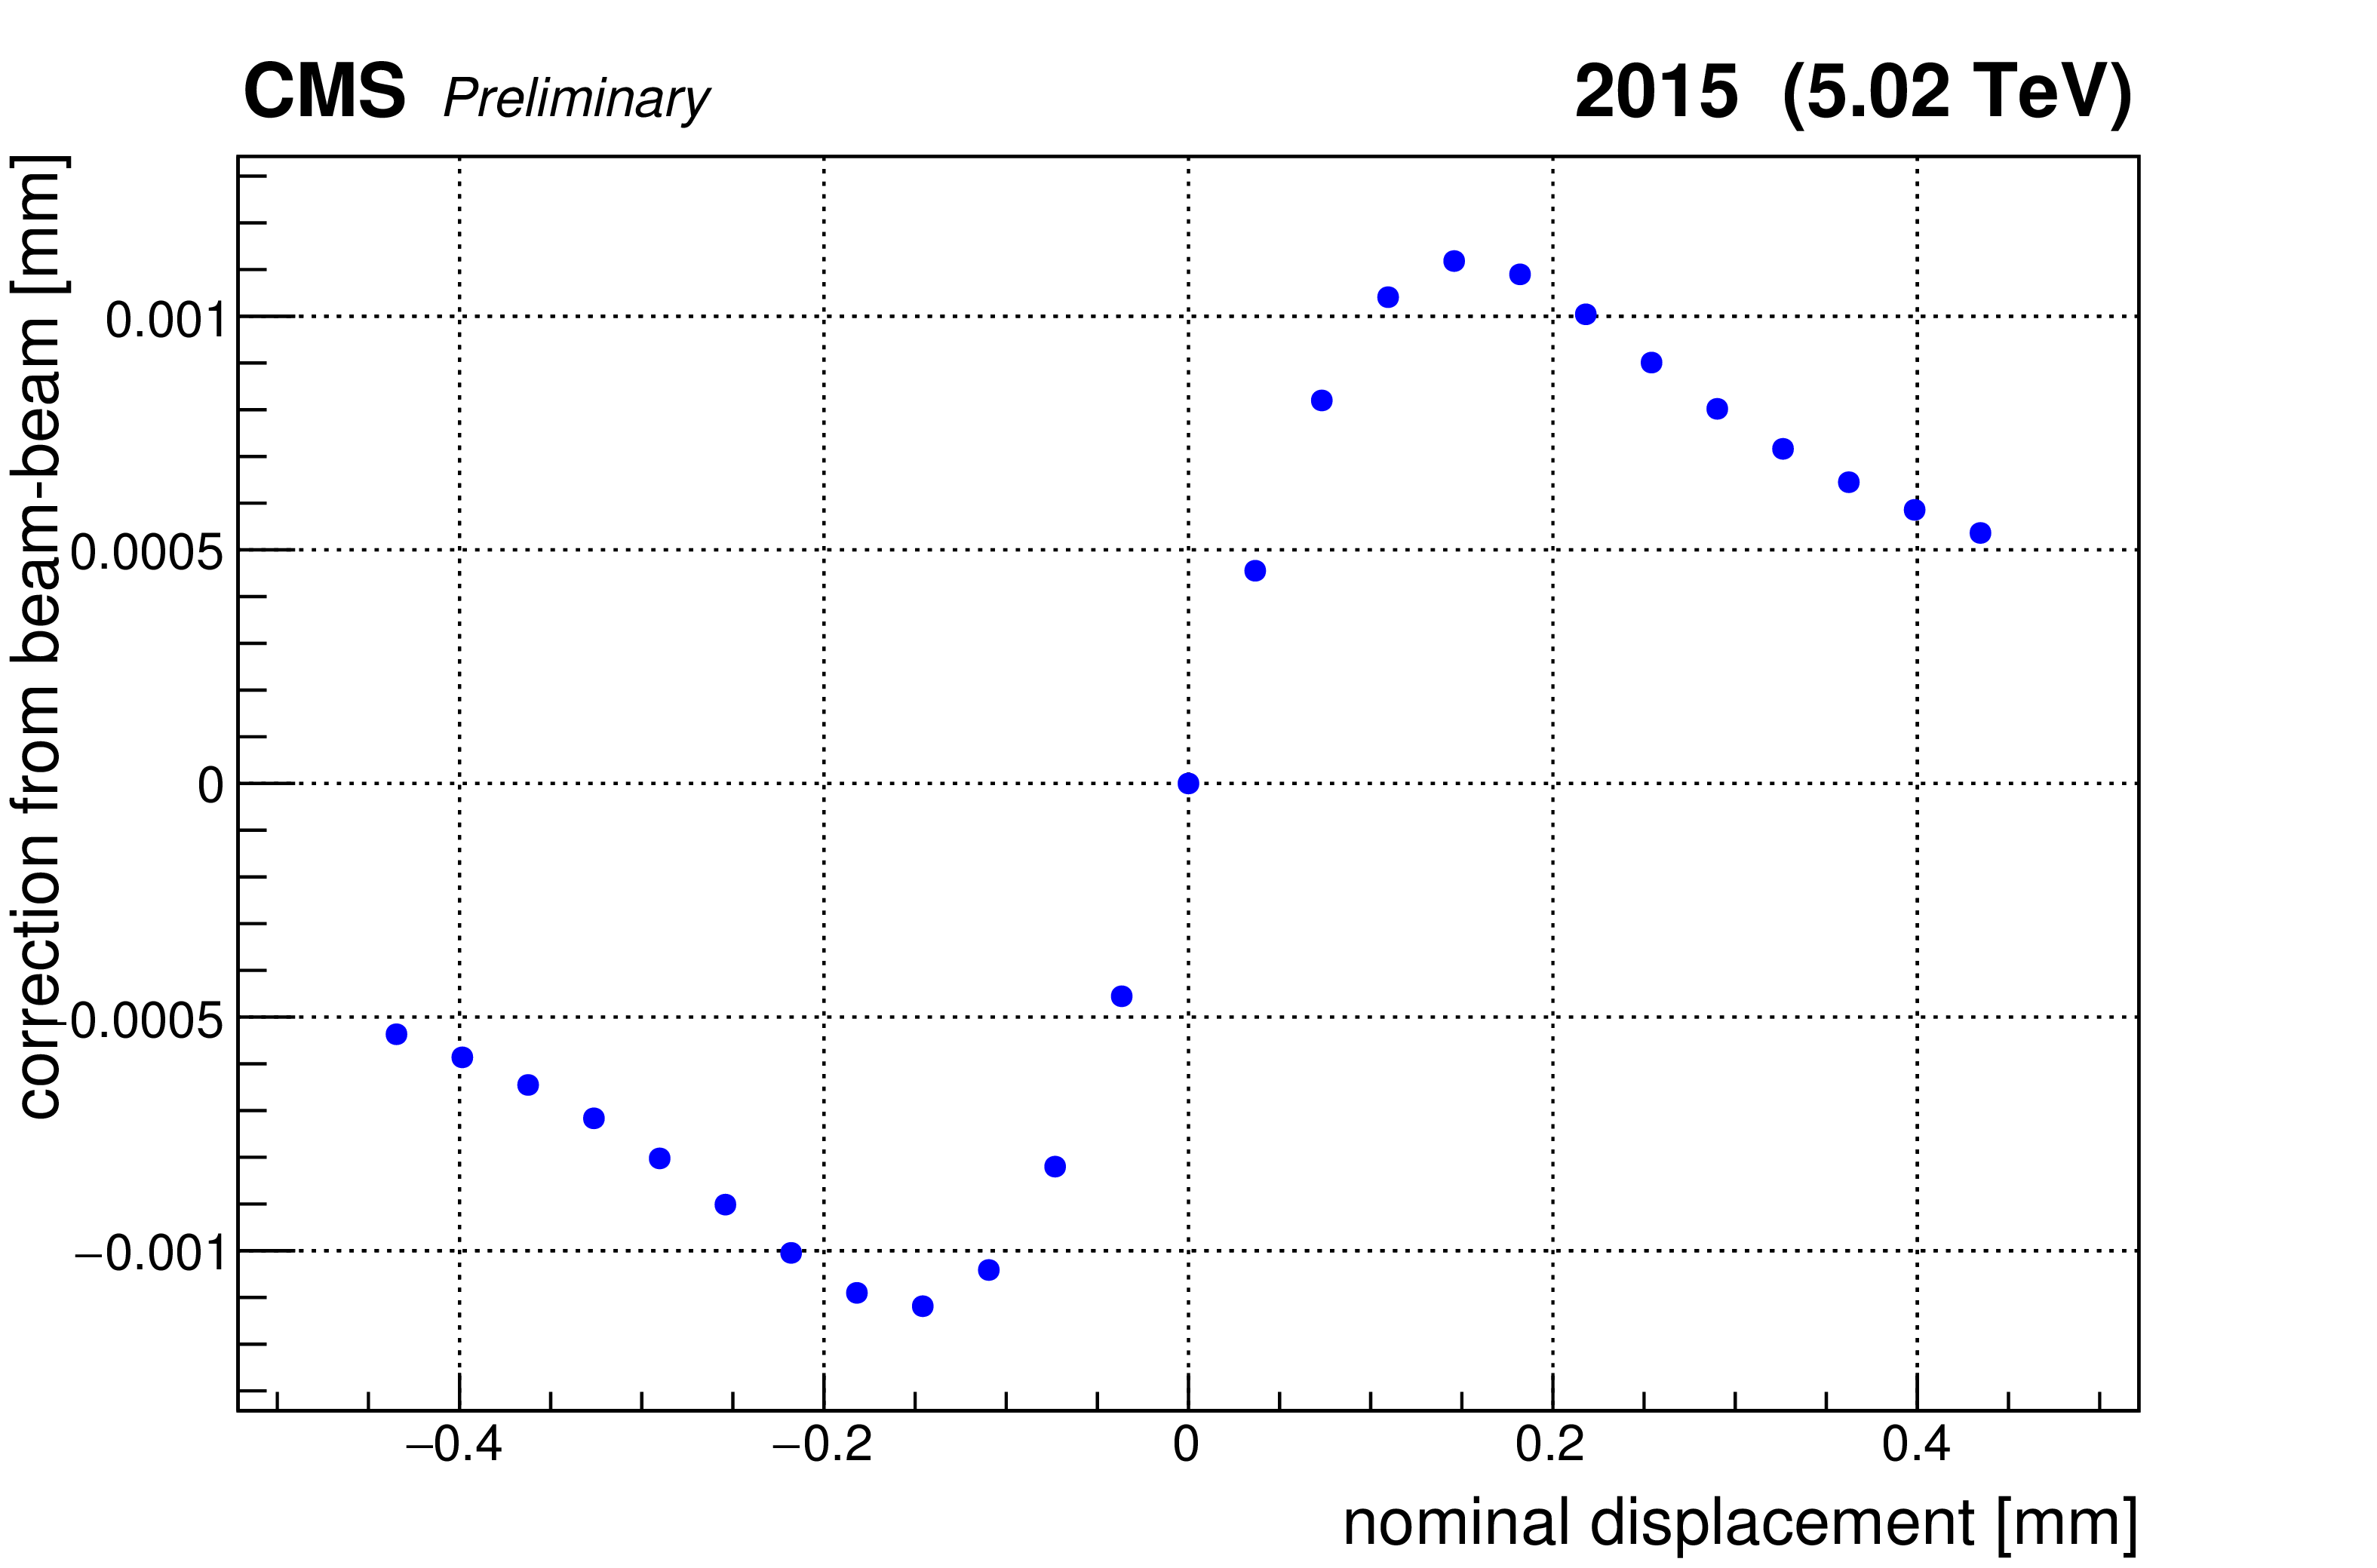
Figure 10:
An example of beam-beam deflection estimated as a function of the nominal beams displacement. |
| Tables | |

png pdf |
Table 1:
Summary of the LHC beam parameters for fill 4634 . |

png pdf |
Table 2:
Results of the length-scale calibration for the two horizontal and vertical LSC scans . |

png pdf |
Table 3:
Comparison of the effective areas from the simulated VdM scans with bunch proton densities extracted having applied Eq. {eq:dgmodel1} to the Beam Images (Eq. {eq:deriveFitModel2}) against the beam overlap integrals incorporating genuine non-factorizabilities. Statistical uncertainties are minor. |

png pdf |
Table 4:
Summary of the systematic uncertainties entering the CMS luminosity measurement for $\sqrt {s}=$ 5.02 TeV proton-proton collisions. When applicable, the percentage correction is shown. |
| Summary |
| In summary, the total uncertainty on the CMS luminosity measurement in November 2015 is 2.3% for CMS data recorded with proton-proton collisions at $\sqrt{s}=$ 5.02 TeV. |
| References | ||||
| 1 | S. van der Meer | Calibration of the effective beam height in the ISR | Technical Report CERN-ISR-PO-68-31 | |
| 2 | ALICE Collaboration | Measurement of visible cross sections in proton-lead collisions at $ \sqrt{s_{\rm NN}} $ = 5.02 TeV in van der Meer scans with the ALICE detector | JINST 9 (2014), no. 11, P11003 | 1405.1849 |
| 3 | ATLAS Collaboration | Improved luminosity determination in pp collisions at sqrt(s) = 7 TeV using the ATLAS detector at the LHC | EPJC73 (2013), no. 8 | 1302.4393 |
| 4 | LHCb Collaboration | Precision luminosity measurements at LHCb | JINST 9 (2014), no. 12, P12005 | 1410.0149 |
| 5 | CMS Collaboration | CMS Luminosity Based on Pixel Cluster Counting - Summer 2013 Update | CDS | |
| 6 | CMS Collaboration | CMS Luminosity Measurement for the 2015 Data Taking Period | CDS | |
| 7 | C. Barschel et al. | Results of the LHC DCCT Calibration Studies | Technical Report CERN-ATS-Note-2012-026 PERF | |
| 8 | D. Belohrad et al. | The LHC Fast BCT system: A comparison of Design Parameters with Initial Performance | Technical Report CERN-BE-2010-010, CERN, Geneva, May | |
| 9 | M. Gasior, J. Olexa, and R. Steinhagen | BPM Electronics based on Compensated Diode Detectors – Results from development Systems | Conf. Proc. C1204151 (Apr, 2012) MOPG010. 3 p | |
| 10 | M. Zanetti | Beams Scan based Absolute Normalization of the CMS Luminosity Measurement. CMS 2010 luminosity determination | Technical Report CERN-Proceedings-2011-001 | |
| 11 | CMS Collaboration | CMS Luminosity Based on Pixel Cluster Counting - Summer 2012 Update | CDS | |
| 12 | J. Salfeld-Nebgen, M. Klute, and C. A. Medlock | Beam Imaging and Luminosity Calibration | Technical Report CERN-OPEN-2016-003 | |
| 13 | W. Kozanecki, T. Pieloni, and J. Wenninger | Observation of Beam-beam Deflections with LHC Orbit Data | Technical Report CERN-ACC-NOTE-2013-0006 | |
| 14 | A. Jeff et al. | Longitudinal density monitor for the LHC | PRST Accel. Beams 15 (Mar, 2012) 032803 | |
| 15 | C. Barschel | Precision luminosity measurement at LHCb with beam-gas imaging | Technical Report CERN-THESIS-2013-301, RWTH Aachen University, Geneva, Mar | |
|
|
Compact Muon Solenoid LHC, CERN |
|

|

|

|

|

|