

Compact Muon Solenoid
LHC, CERN
| CMS-PAS-SMP-14-023 | ||
| Differential cross section measurements of W bosons produced in association with jets in proton-proton collisions at $\sqrt{s}= $ 8 TeV | ||
| CMS Collaboration | ||
| April 2016 | ||
| Abstract: Measurements of the differential cross-sections for a $\mathrm{W}(\rightarrow \mu\nu)$ boson produced in association with jets are presented here. The measurements use a data sample of proton-proton collisions at a center-of-mass energy of 8 TeV that was recorded by the CMS detector at the LHC, and corresponds to an integrated luminosity of 19.6 fb$^{-1}$. The cross sections are reported as a function of jet multiplicity, the jet transverse momenta, and the scalar sum of jet transverse momenta ($H_\mathrm{T}$) for different jet multiplicities. Several angular correlation distributions among the jets and the muon are also examined, as well as the distributions of the average number of jets as a function of $H_\mathrm{T}$ and as a function of angular variables. Such angular distributions are sensitive to the modeling of higher order corrections, and to the modeling of parton emissions. The cross section measurements are then compared with the predictions from leading-order and multileg next-to-leading-order Monte Carlo generators, fixed order next-to-leading-order theoretical predictions for up to four jets as well as next-to-next-to-leading-order predictions of W+1 jet. | ||
|
Links:
CDS record (PDF) ;
inSPIRE record ;
CADI line (restricted) ;
These preliminary results are superseded in this paper, PRD 95 (2017) 052002. The superseded preliminary plots can be found here. |
||
| Figures | |

png pdf |
Figure 1-a:
Reconstructed data and simulated signal and backgrounds for inclusive jet multiplicity (a) and the $ {p_{\mathrm {T}}} $ of the leading jet (b) in $\mathrm{ W } + \geq 1$ jet events. |

png pdf |
Figure 1-b:
Reconstructed data and simulated signal and backgrounds for inclusive jet multiplicity (a) and the $ {p_{\mathrm {T}}} $ of the leading jet (b) in $\mathrm{ W } + \geq 1$ jet events. |

png pdf |
Figure 2:
Systematic uncertainties on measured cross section as a function of jet multiplicity. Shown in the figure are uncertainties due to jet energy scale (JES), background normalisation (BG), the b-tagging efficiency (BtagSF), the finite number of simulated events used to construct the response matrix (MC), and other systematic uncertainties mentioned in Section {systematics}. |

png pdf |
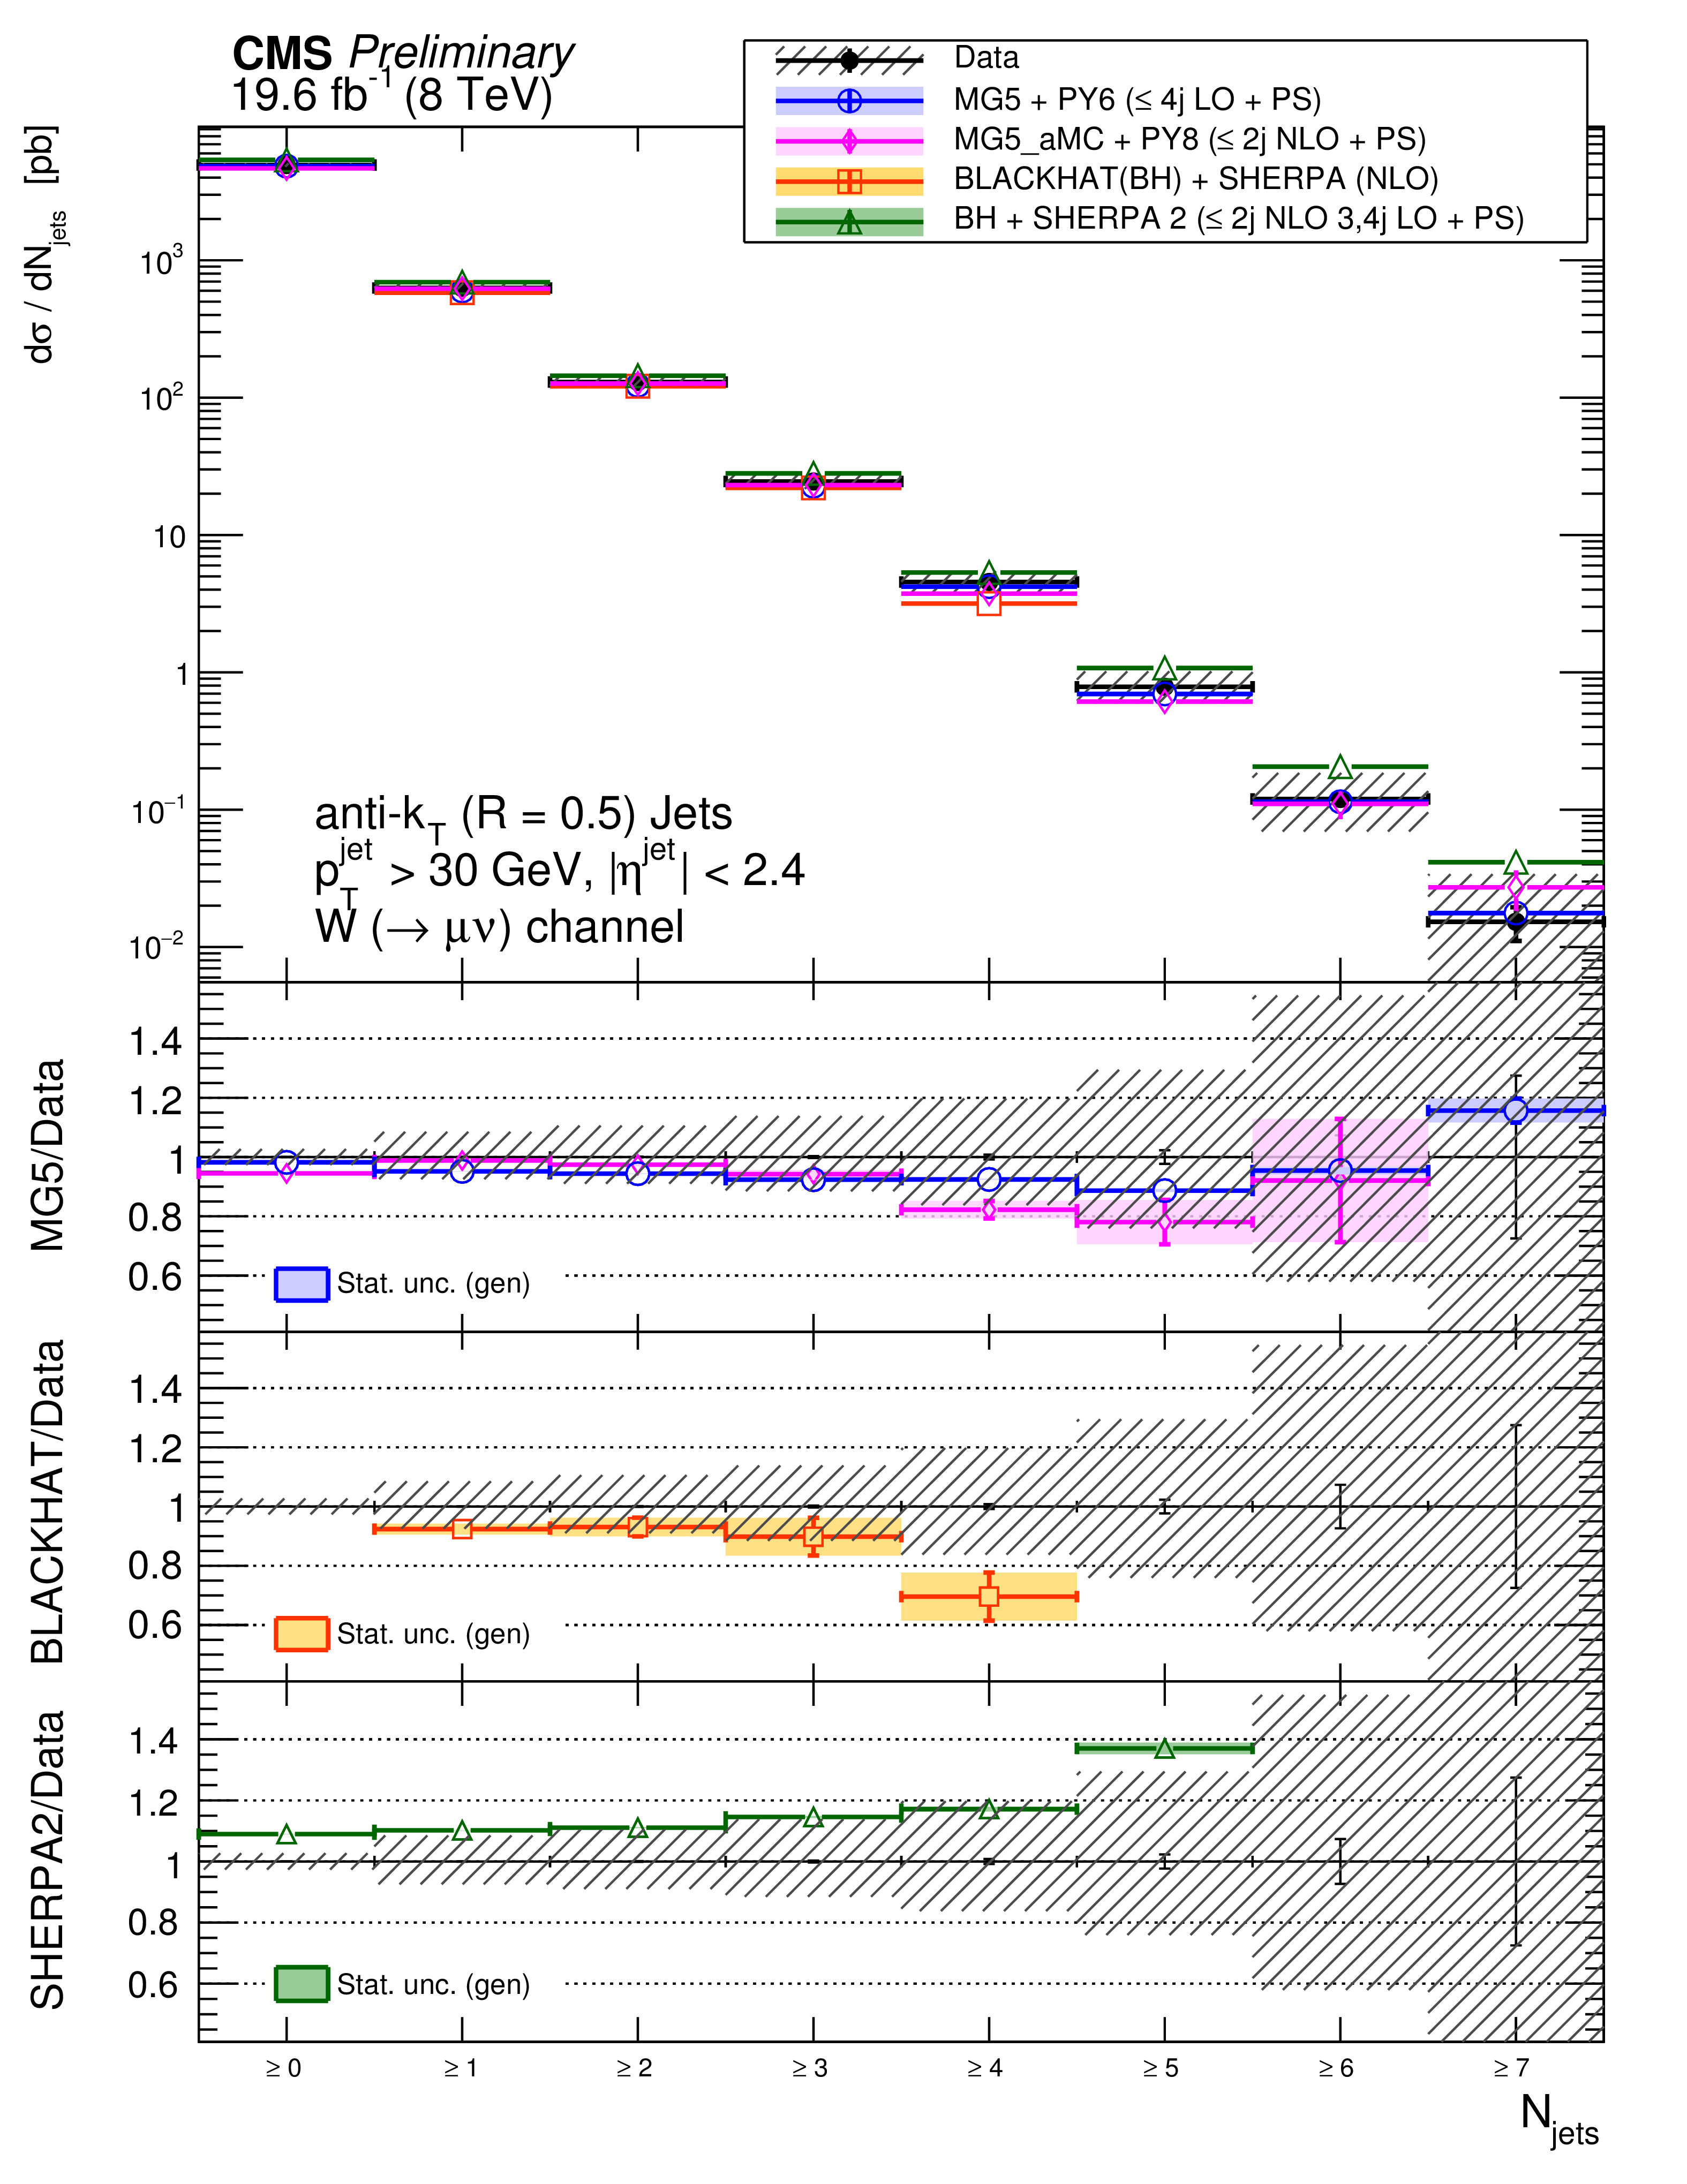
Figure 3-a:
The cross section measurement for the exclusive and inclusive jet multiplicities, compared to the prediction of MadGraph , MadGraph5$\_$aMC@NLO, SHERPA-2, and BLACKHAT+SHERPA (corrected for hadronization and multiple-parton interactions). Black circular markers with the grey hatched band represent the unfolded data measurement and its uncertainty. Overlaid are the predictions together with their statistical uncertainties (Theory stat.). The BLACKHAT+SHERPA uncertainty also contains theoretical systematic uncertainties (Theory syst.) described in Section 9. The lower plots show the ratio of each prediction to the unfolded data. |
png pdf |
Figure 3-b:
The cross section measurement for the exclusive and inclusive jet multiplicities, compared to the prediction of MadGraph , MadGraph5$\_$aMC@NLO, SHERPA-2, and BLACKHAT+SHERPA (corrected for hadronization and multiple-parton interactions). Black circular markers with the grey hatched band represent the unfolded data measurement and its uncertainty. Overlaid are the predictions together with their statistical uncertainties (Theory stat.). The BLACKHAT+SHERPA uncertainty also contains theoretical systematic uncertainties (Theory syst.) described in Section 9. The lower plots show the ratio of each prediction to the unfolded data. |

png pdf |
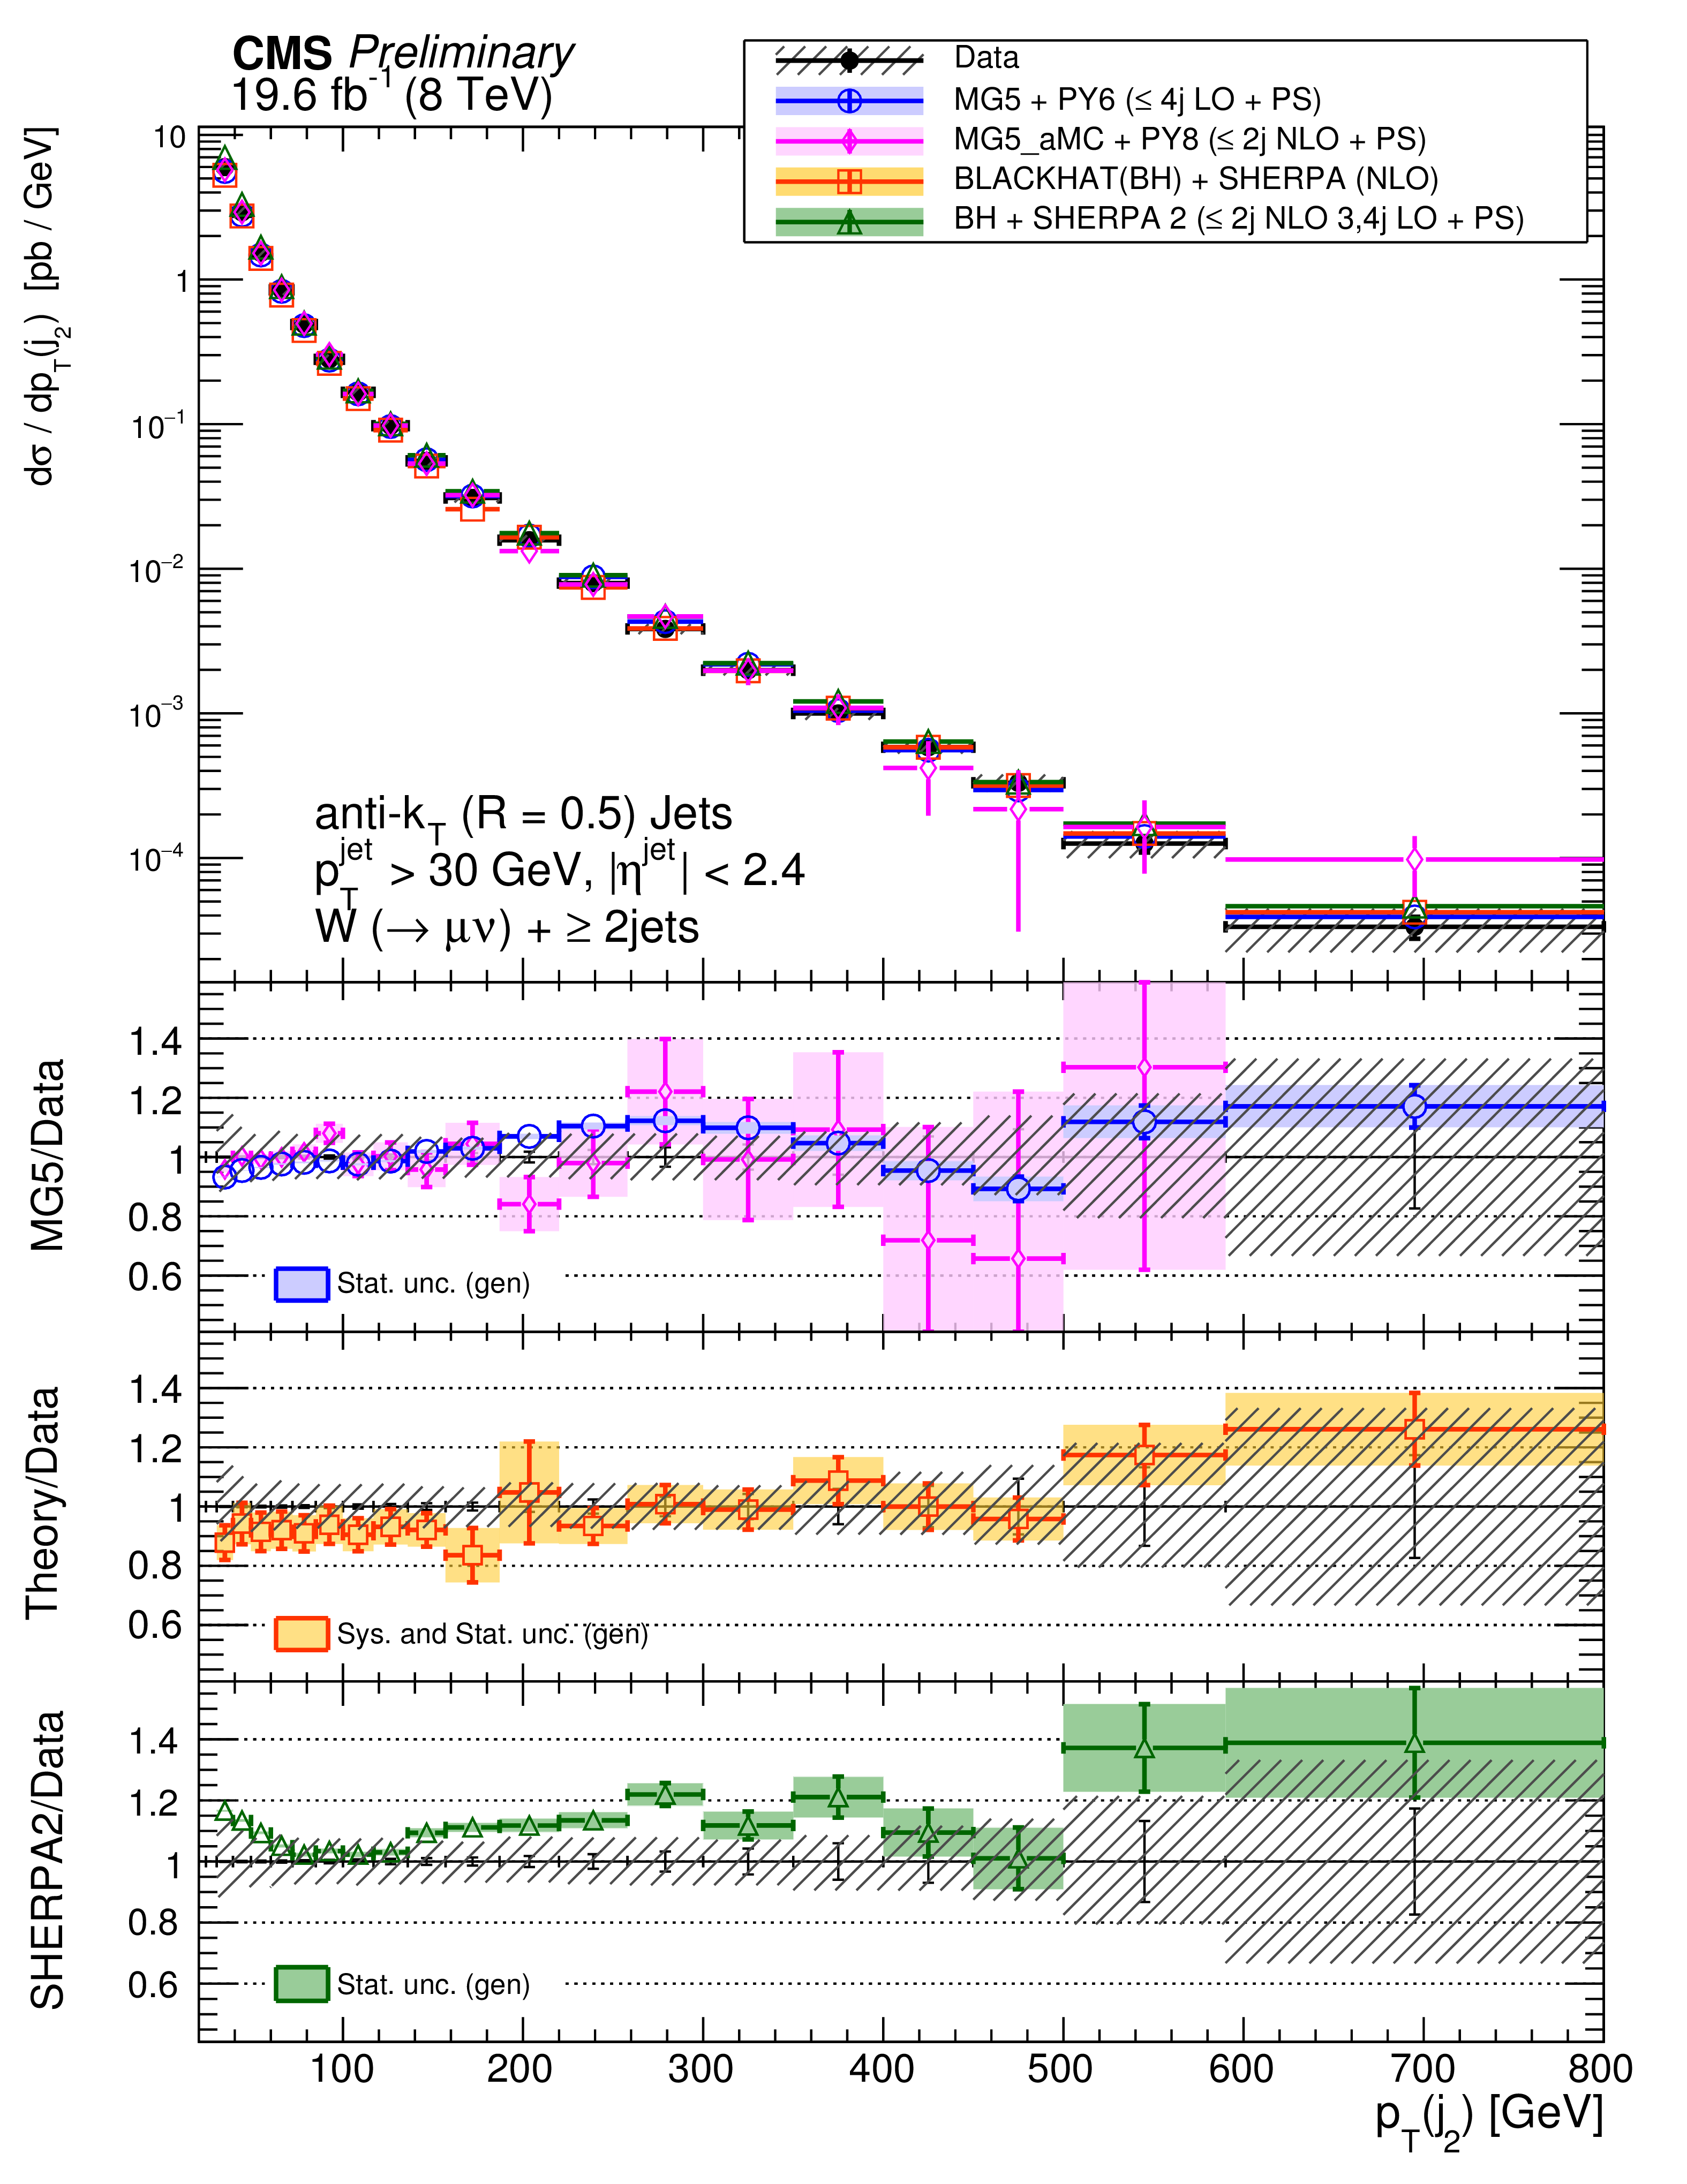
Figure 4-a:
The differential cross section measurement for the leading four jets' transverse momenta, compared to the prediction of MadGraph, MadGraph5$\_$aMC@NLO, SHERPA-2, BLACKHAT+SHERPA , and NNLO inclusive 1 jet production (indicated as NNLO1j). BLACKHAT+SHERPA and NNLO1j are corrected for hadronisation and multiple-parton interactions effects. Black circular markers with the grey hatched band represent the unfolded data measurement and its uncertainty. Overlaid are the predictions together with their statistical uncertainties (Theory stat.). The BLACKHAT+SHERPA and the NNLO1j uncertainties also contain theoretical systematic uncertainties (Theory syst.) described in Section 9. The lower plots show the ratio of each prediction to the unfolded data. |
png pdf |
Figure 4-b:
The differential cross section measurement for the leading four jets' transverse momenta, compared to the prediction of MadGraph, MadGraph5$\_$aMC@NLO, SHERPA-2, BLACKHAT+SHERPA , and NNLO inclusive 1 jet production (indicated as NNLO1j). BLACKHAT+SHERPA and NNLO1j are corrected for hadronisation and multiple-parton interactions effects. Black circular markers with the grey hatched band represent the unfolded data measurement and its uncertainty. Overlaid are the predictions together with their statistical uncertainties (Theory stat.). The BLACKHAT+SHERPA and the NNLO1j uncertainties also contain theoretical systematic uncertainties (Theory syst.) described in Section 9. The lower plots show the ratio of each prediction to the unfolded data. |

png pdf |
Figure 4-c:
The differential cross section measurement for the leading four jets' transverse momenta, compared to the prediction of MadGraph, MadGraph5$\_$aMC@NLO, SHERPA-2, BLACKHAT+SHERPA , and NNLO inclusive 1 jet production (indicated as NNLO1j). BLACKHAT+SHERPA and NNLO1j are corrected for hadronisation and multiple-parton interactions effects. Black circular markers with the grey hatched band represent the unfolded data measurement and its uncertainty. Overlaid are the predictions together with their statistical uncertainties (Theory stat.). The BLACKHAT+SHERPA and the NNLO1j uncertainties also contain theoretical systematic uncertainties (Theory syst.) described in Section 9. The lower plots show the ratio of each prediction to the unfolded data. |

png pdf |
Figure 4-d:
The differential cross section measurement for the leading four jets' transverse momenta, compared to the prediction of MadGraph, MadGraph5$\_$aMC@NLO, SHERPA-2, BLACKHAT+SHERPA , and NNLO inclusive 1 jet production (indicated as NNLO1j). BLACKHAT+SHERPA and NNLO1j are corrected for hadronisation and multiple-parton interactions effects. Black circular markers with the grey hatched band represent the unfolded data measurement and its uncertainty. Overlaid are the predictions together with their statistical uncertainties (Theory stat.). The BLACKHAT+SHERPA and the NNLO1j uncertainties also contain theoretical systematic uncertainties (Theory syst.) described in Section 9. The lower plots show the ratio of each prediction to the unfolded data. |

png pdf |
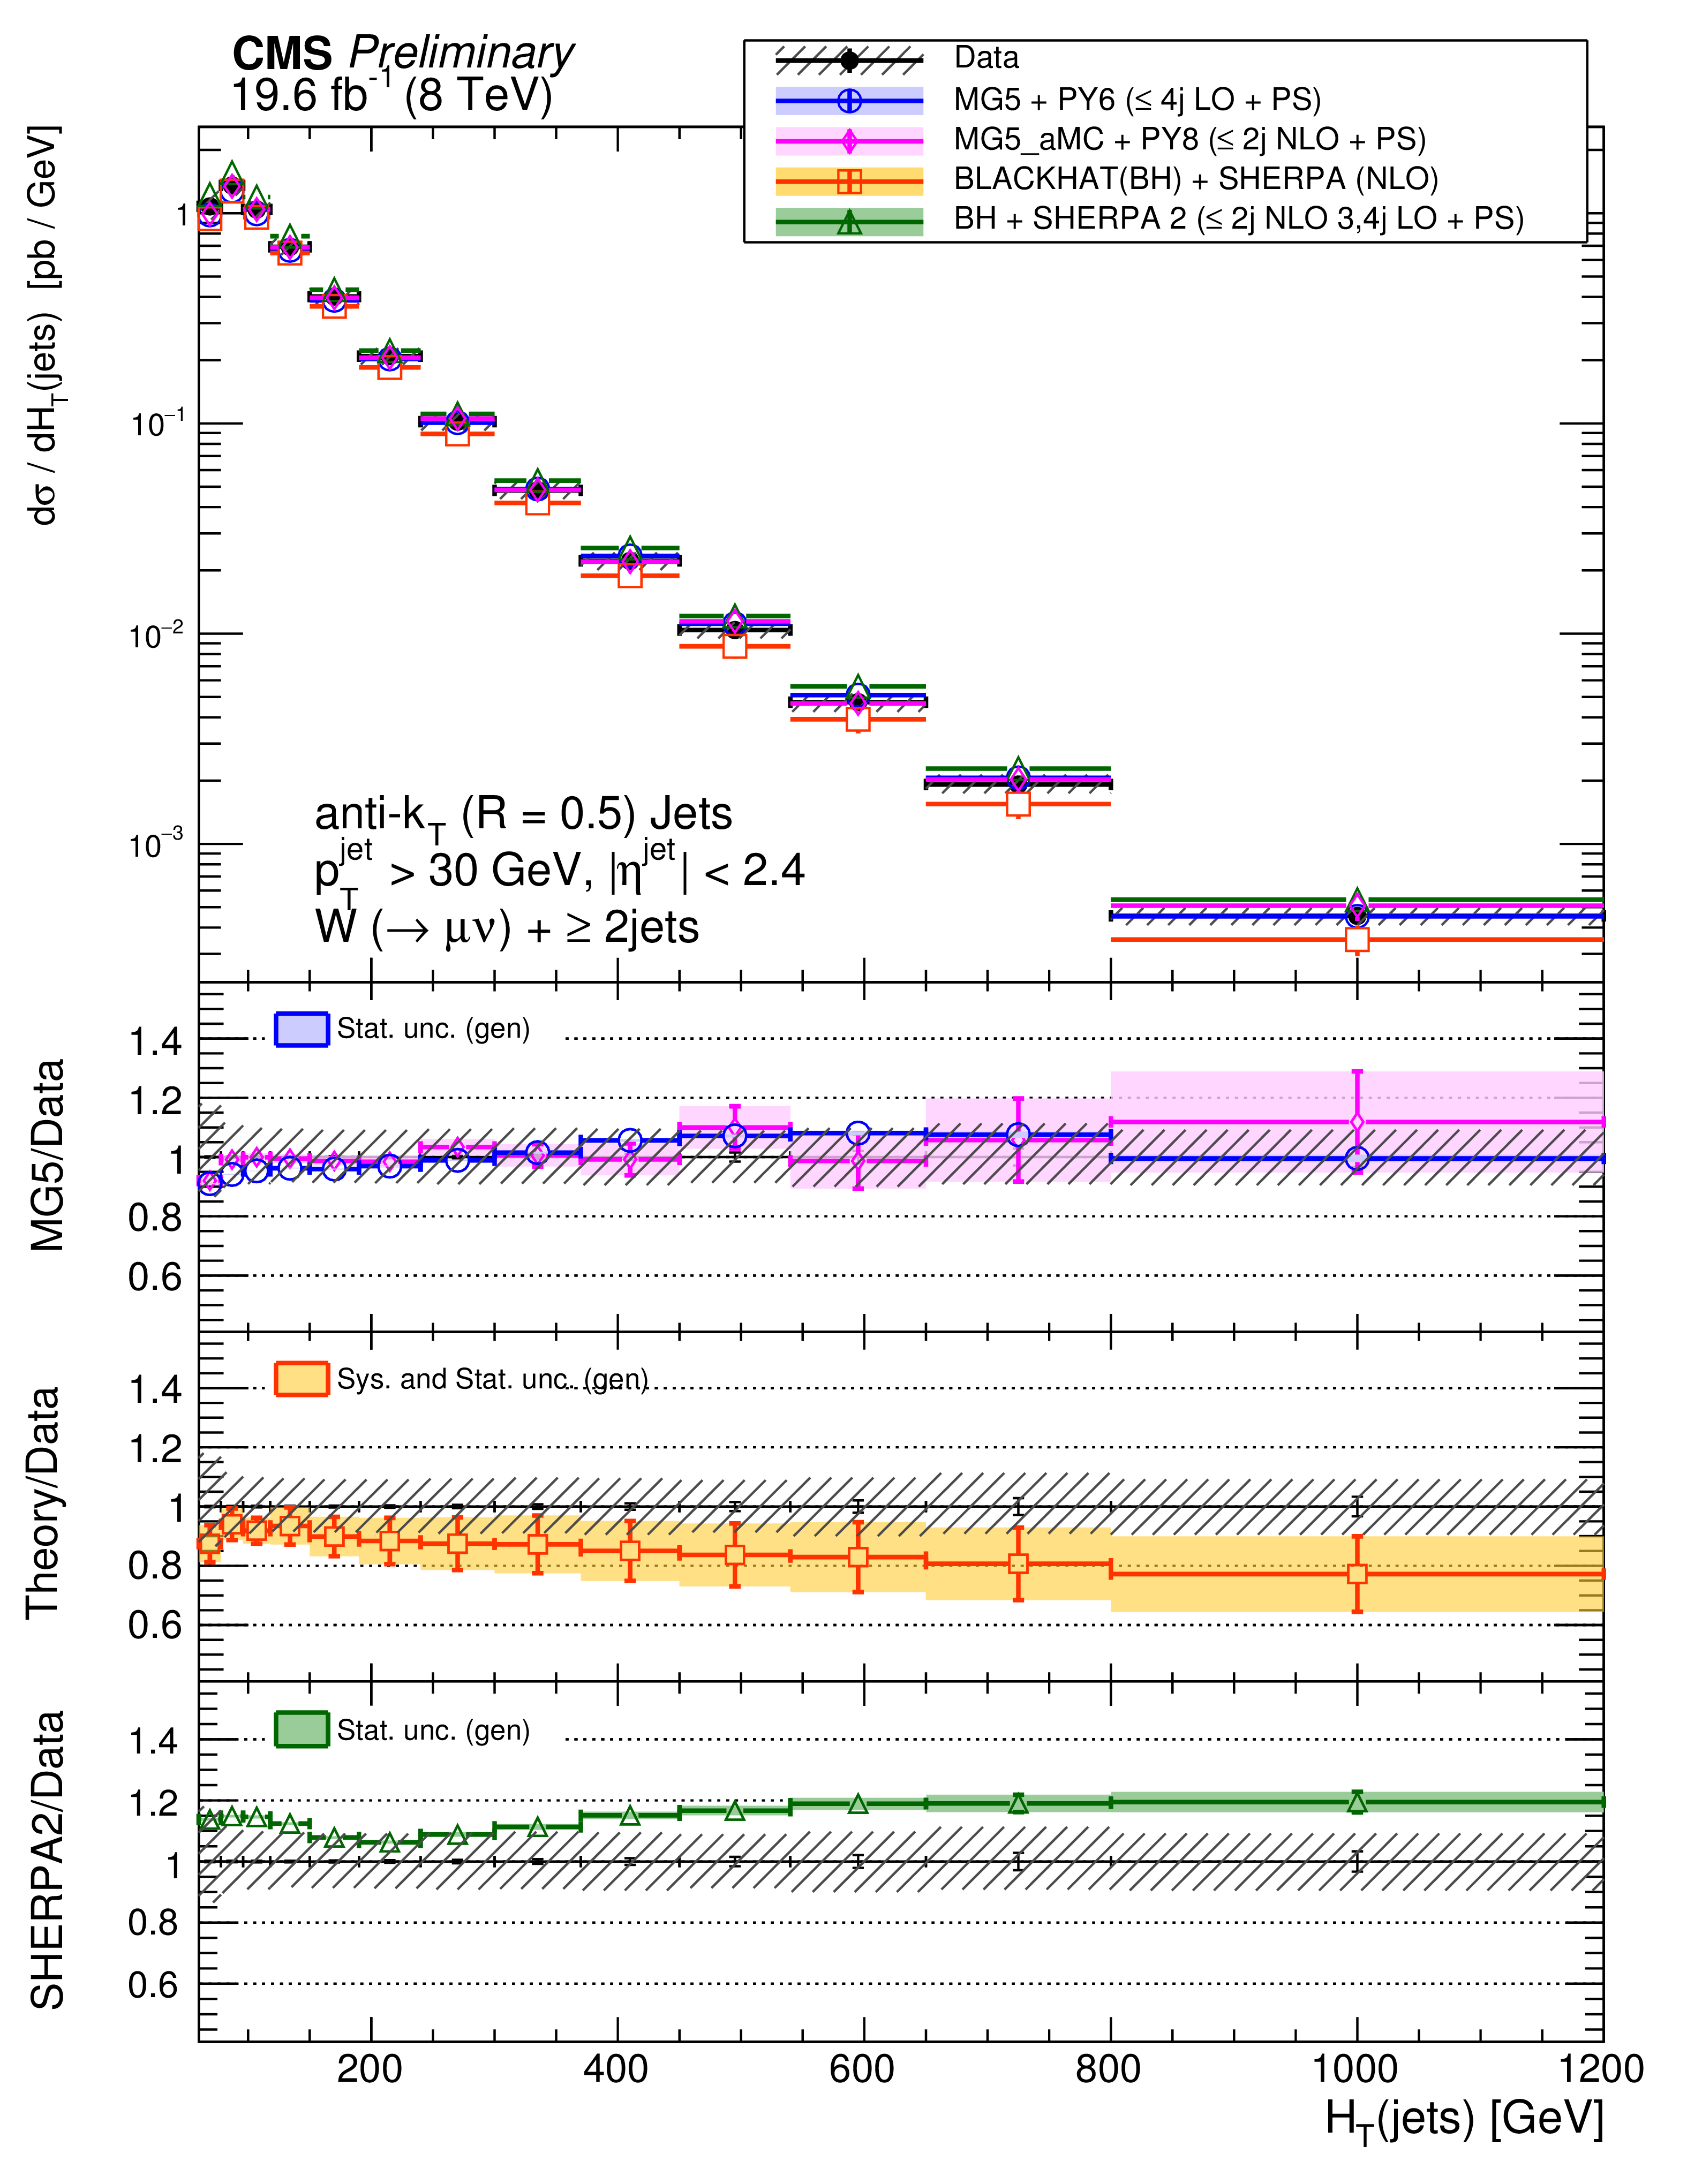
Figure 5-a:
The differential cross section measurement for $ {H_{\mathrm {T}}} $ for inclusive jet multiplicities 1-4, compared to the prediction of MadGraph , MadGraph5$\_$aMC@NLO, SHERPA-2, BLACKHAT+SHERPA , and NNLO inclusive 1 jet production (indicated as NNLO1j). BLACKHAT+SHERPA and NNLO1j are corrected for hadronisation and multiple-parton interactions effects. Black circular markers with the grey hatched band represent the unfolded data measurement and its uncertainty. Overlaid are the predictions together with their statistical uncertainties (Theory stat.). The BLACKHAT+SHERPA and NNLO1j uncertainties also contain theoretical systematic uncertainties (Theory syst.) described in Section 9. The lower plots show the ratio of each prediction to the unfolded data. |
png pdf |
Figure 5-b:
The differential cross section measurement for $ {H_{\mathrm {T}}} $ for inclusive jet multiplicities 1-4, compared to the prediction of MadGraph , MadGraph5$\_$aMC@NLO, SHERPA-2, BLACKHAT+SHERPA , and NNLO inclusive 1 jet production (indicated as NNLO1j). BLACKHAT+SHERPA and NNLO1j are corrected for hadronisation and multiple-parton interactions effects. Black circular markers with the grey hatched band represent the unfolded data measurement and its uncertainty. Overlaid are the predictions together with their statistical uncertainties (Theory stat.). The BLACKHAT+SHERPA and NNLO1j uncertainties also contain theoretical systematic uncertainties (Theory syst.) described in Section 9. The lower plots show the ratio of each prediction to the unfolded data. |

png pdf |
Figure 5-c:
The differential cross section measurement for $ {H_{\mathrm {T}}} $ for inclusive jet multiplicities 1-4, compared to the prediction of MadGraph , MadGraph5$\_$aMC@NLO, SHERPA-2, BLACKHAT+SHERPA , and NNLO inclusive 1 jet production (indicated as NNLO1j). BLACKHAT+SHERPA and NNLO1j are corrected for hadronisation and multiple-parton interactions effects. Black circular markers with the grey hatched band represent the unfolded data measurement and its uncertainty. Overlaid are the predictions together with their statistical uncertainties (Theory stat.). The BLACKHAT+SHERPA and NNLO1j uncertainties also contain theoretical systematic uncertainties (Theory syst.) described in Section 9. The lower plots show the ratio of each prediction to the unfolded data. |

png pdf |
Figure 5-d:
The differential cross section measurement for $ {H_{\mathrm {T}}} $ for inclusive jet multiplicities 1-4, compared to the prediction of MadGraph , MadGraph5$\_$aMC@NLO, SHERPA-2, BLACKHAT+SHERPA , and NNLO inclusive 1 jet production (indicated as NNLO1j). BLACKHAT+SHERPA and NNLO1j are corrected for hadronisation and multiple-parton interactions effects. Black circular markers with the grey hatched band represent the unfolded data measurement and its uncertainty. Overlaid are the predictions together with their statistical uncertainties (Theory stat.). The BLACKHAT+SHERPA and NNLO1j uncertainties also contain theoretical systematic uncertainties (Theory syst.) described in Section 9. The lower plots show the ratio of each prediction to the unfolded data. |
png pdf |
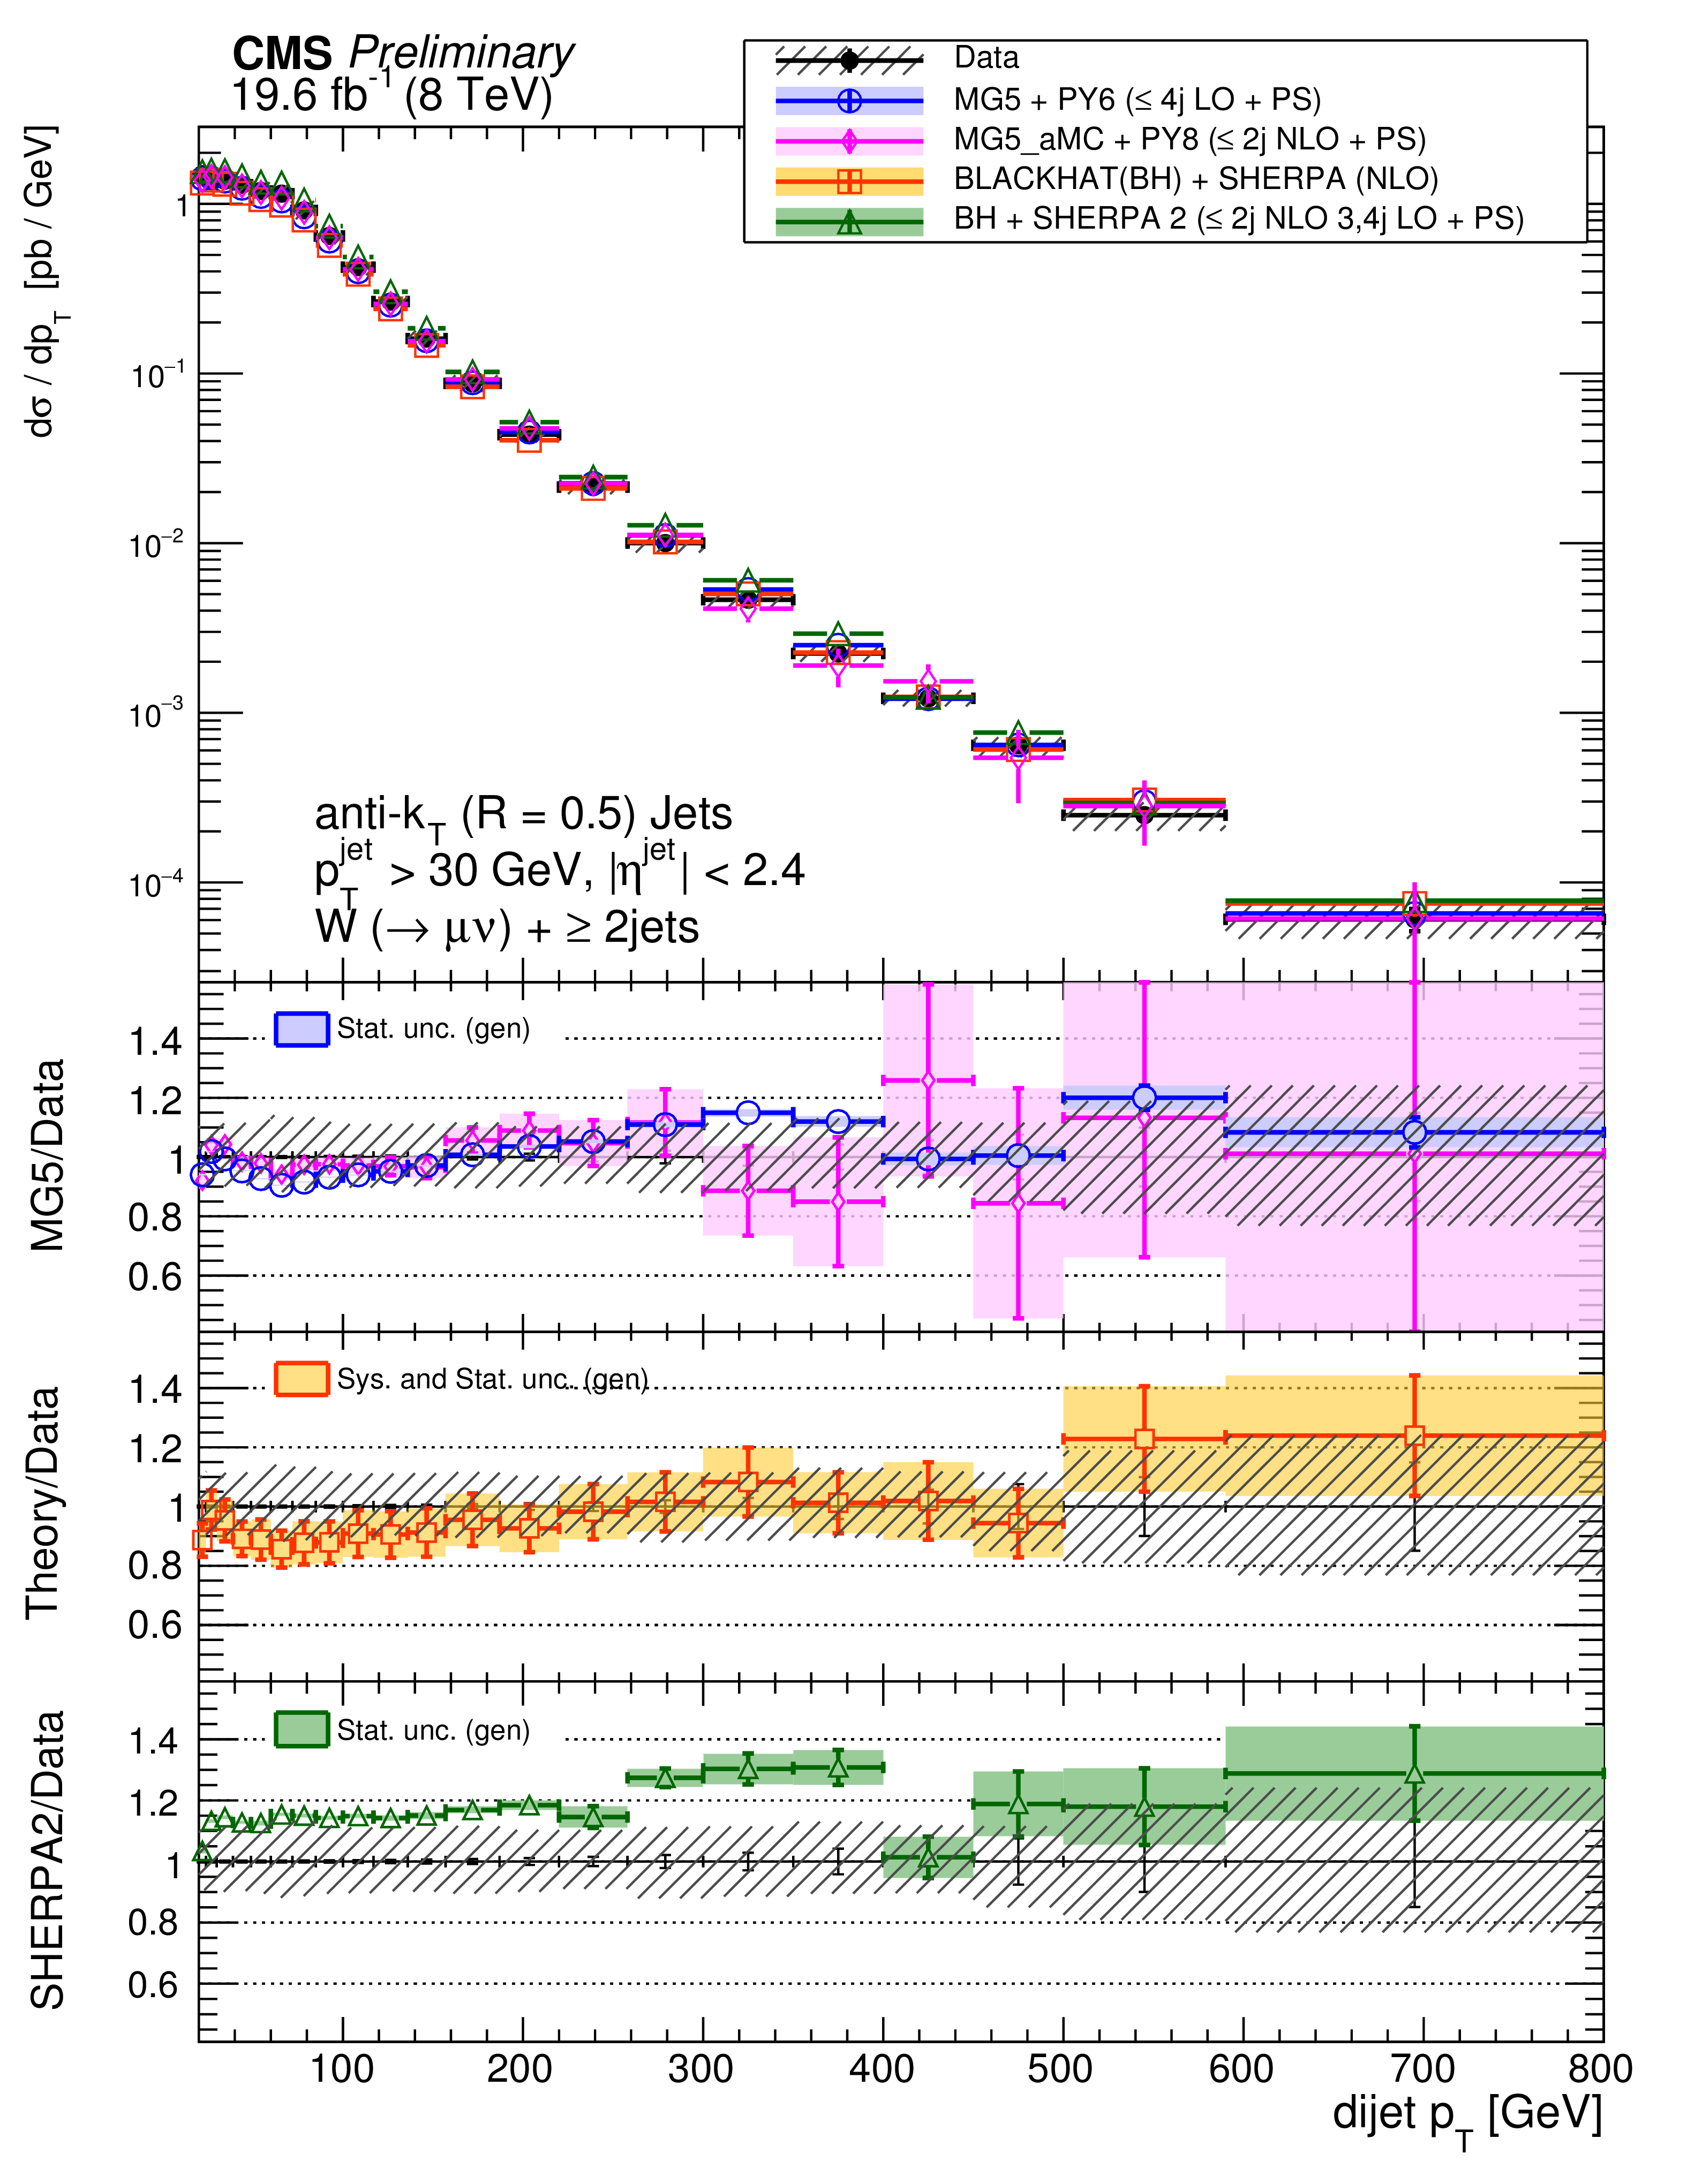
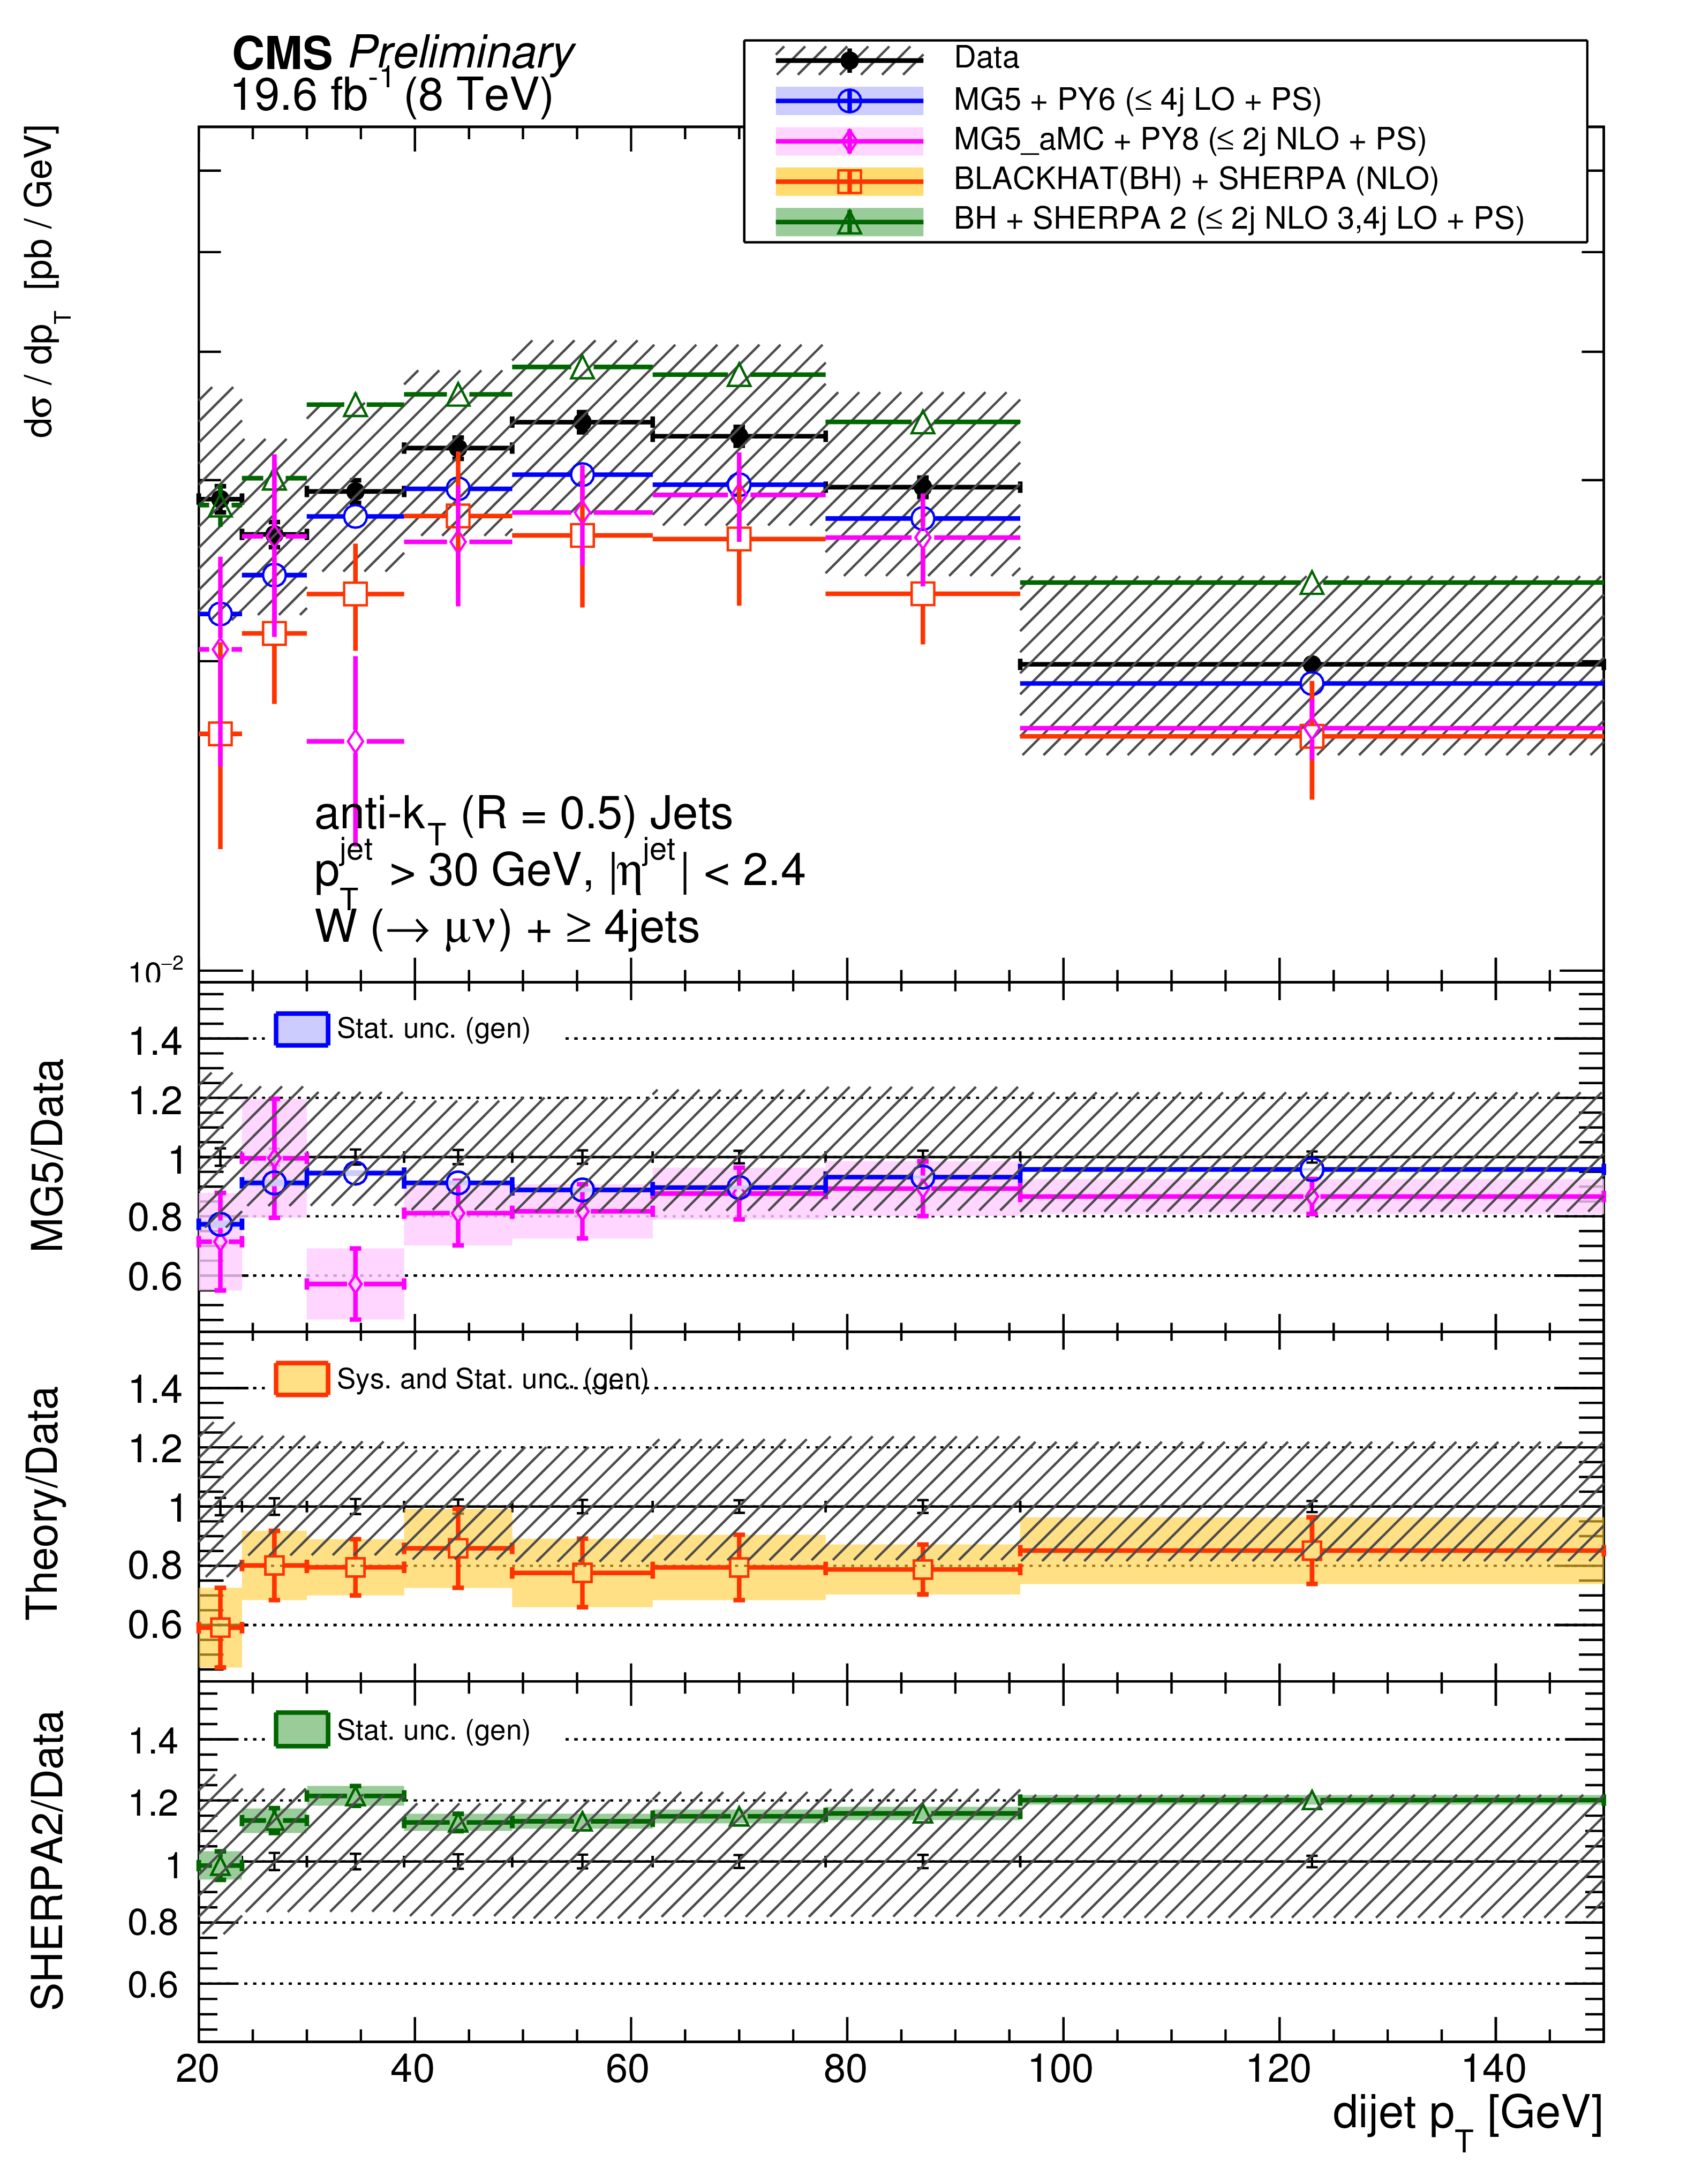
Figure 6-a:
The differential cross section measurement for the dijet $ {p_{\mathrm {T}}} $ for inclusive jet multiplicities 2-4, compared to the prediction of MadGraph , MadGraph5$\_$aMC@NLO, SHERPA-2, and BLACKHAT+SHERPA (corrected for hadronization and multiple-parton interactions). Black circular markers with the grey hatched band represent the unfolded data measurement and its uncertainty. Overlaid are the predictions together with their statistical uncertainties (Theory stat.). The BLACKHAT+SHERPA uncertainty also contains theoretical systematic uncertainties (Theory syst.) described in Section 9. The lower plots show the ratio of each prediction to the unfolded data. |

png pdf |
Figure 6-b:
The differential cross section measurement for the dijet $ {p_{\mathrm {T}}} $ for inclusive jet multiplicities 2-4, compared to the prediction of MadGraph , MadGraph5$\_$aMC@NLO, SHERPA-2, and BLACKHAT+SHERPA (corrected for hadronization and multiple-parton interactions). Black circular markers with the grey hatched band represent the unfolded data measurement and its uncertainty. Overlaid are the predictions together with their statistical uncertainties (Theory stat.). The BLACKHAT+SHERPA uncertainty also contains theoretical systematic uncertainties (Theory syst.) described in Section 9. The lower plots show the ratio of each prediction to the unfolded data. |
png pdf |
Figure 6-c:
The differential cross section measurement for the dijet $ {p_{\mathrm {T}}} $ for inclusive jet multiplicities 2-4, compared to the prediction of MadGraph , MadGraph5$\_$aMC@NLO, SHERPA-2, and BLACKHAT+SHERPA (corrected for hadronization and multiple-parton interactions). Black circular markers with the grey hatched band represent the unfolded data measurement and its uncertainty. Overlaid are the predictions together with their statistical uncertainties (Theory stat.). The BLACKHAT+SHERPA uncertainty also contains theoretical systematic uncertainties (Theory syst.) described in Section 9. The lower plots show the ratio of each prediction to the unfolded data. |
png pdf |
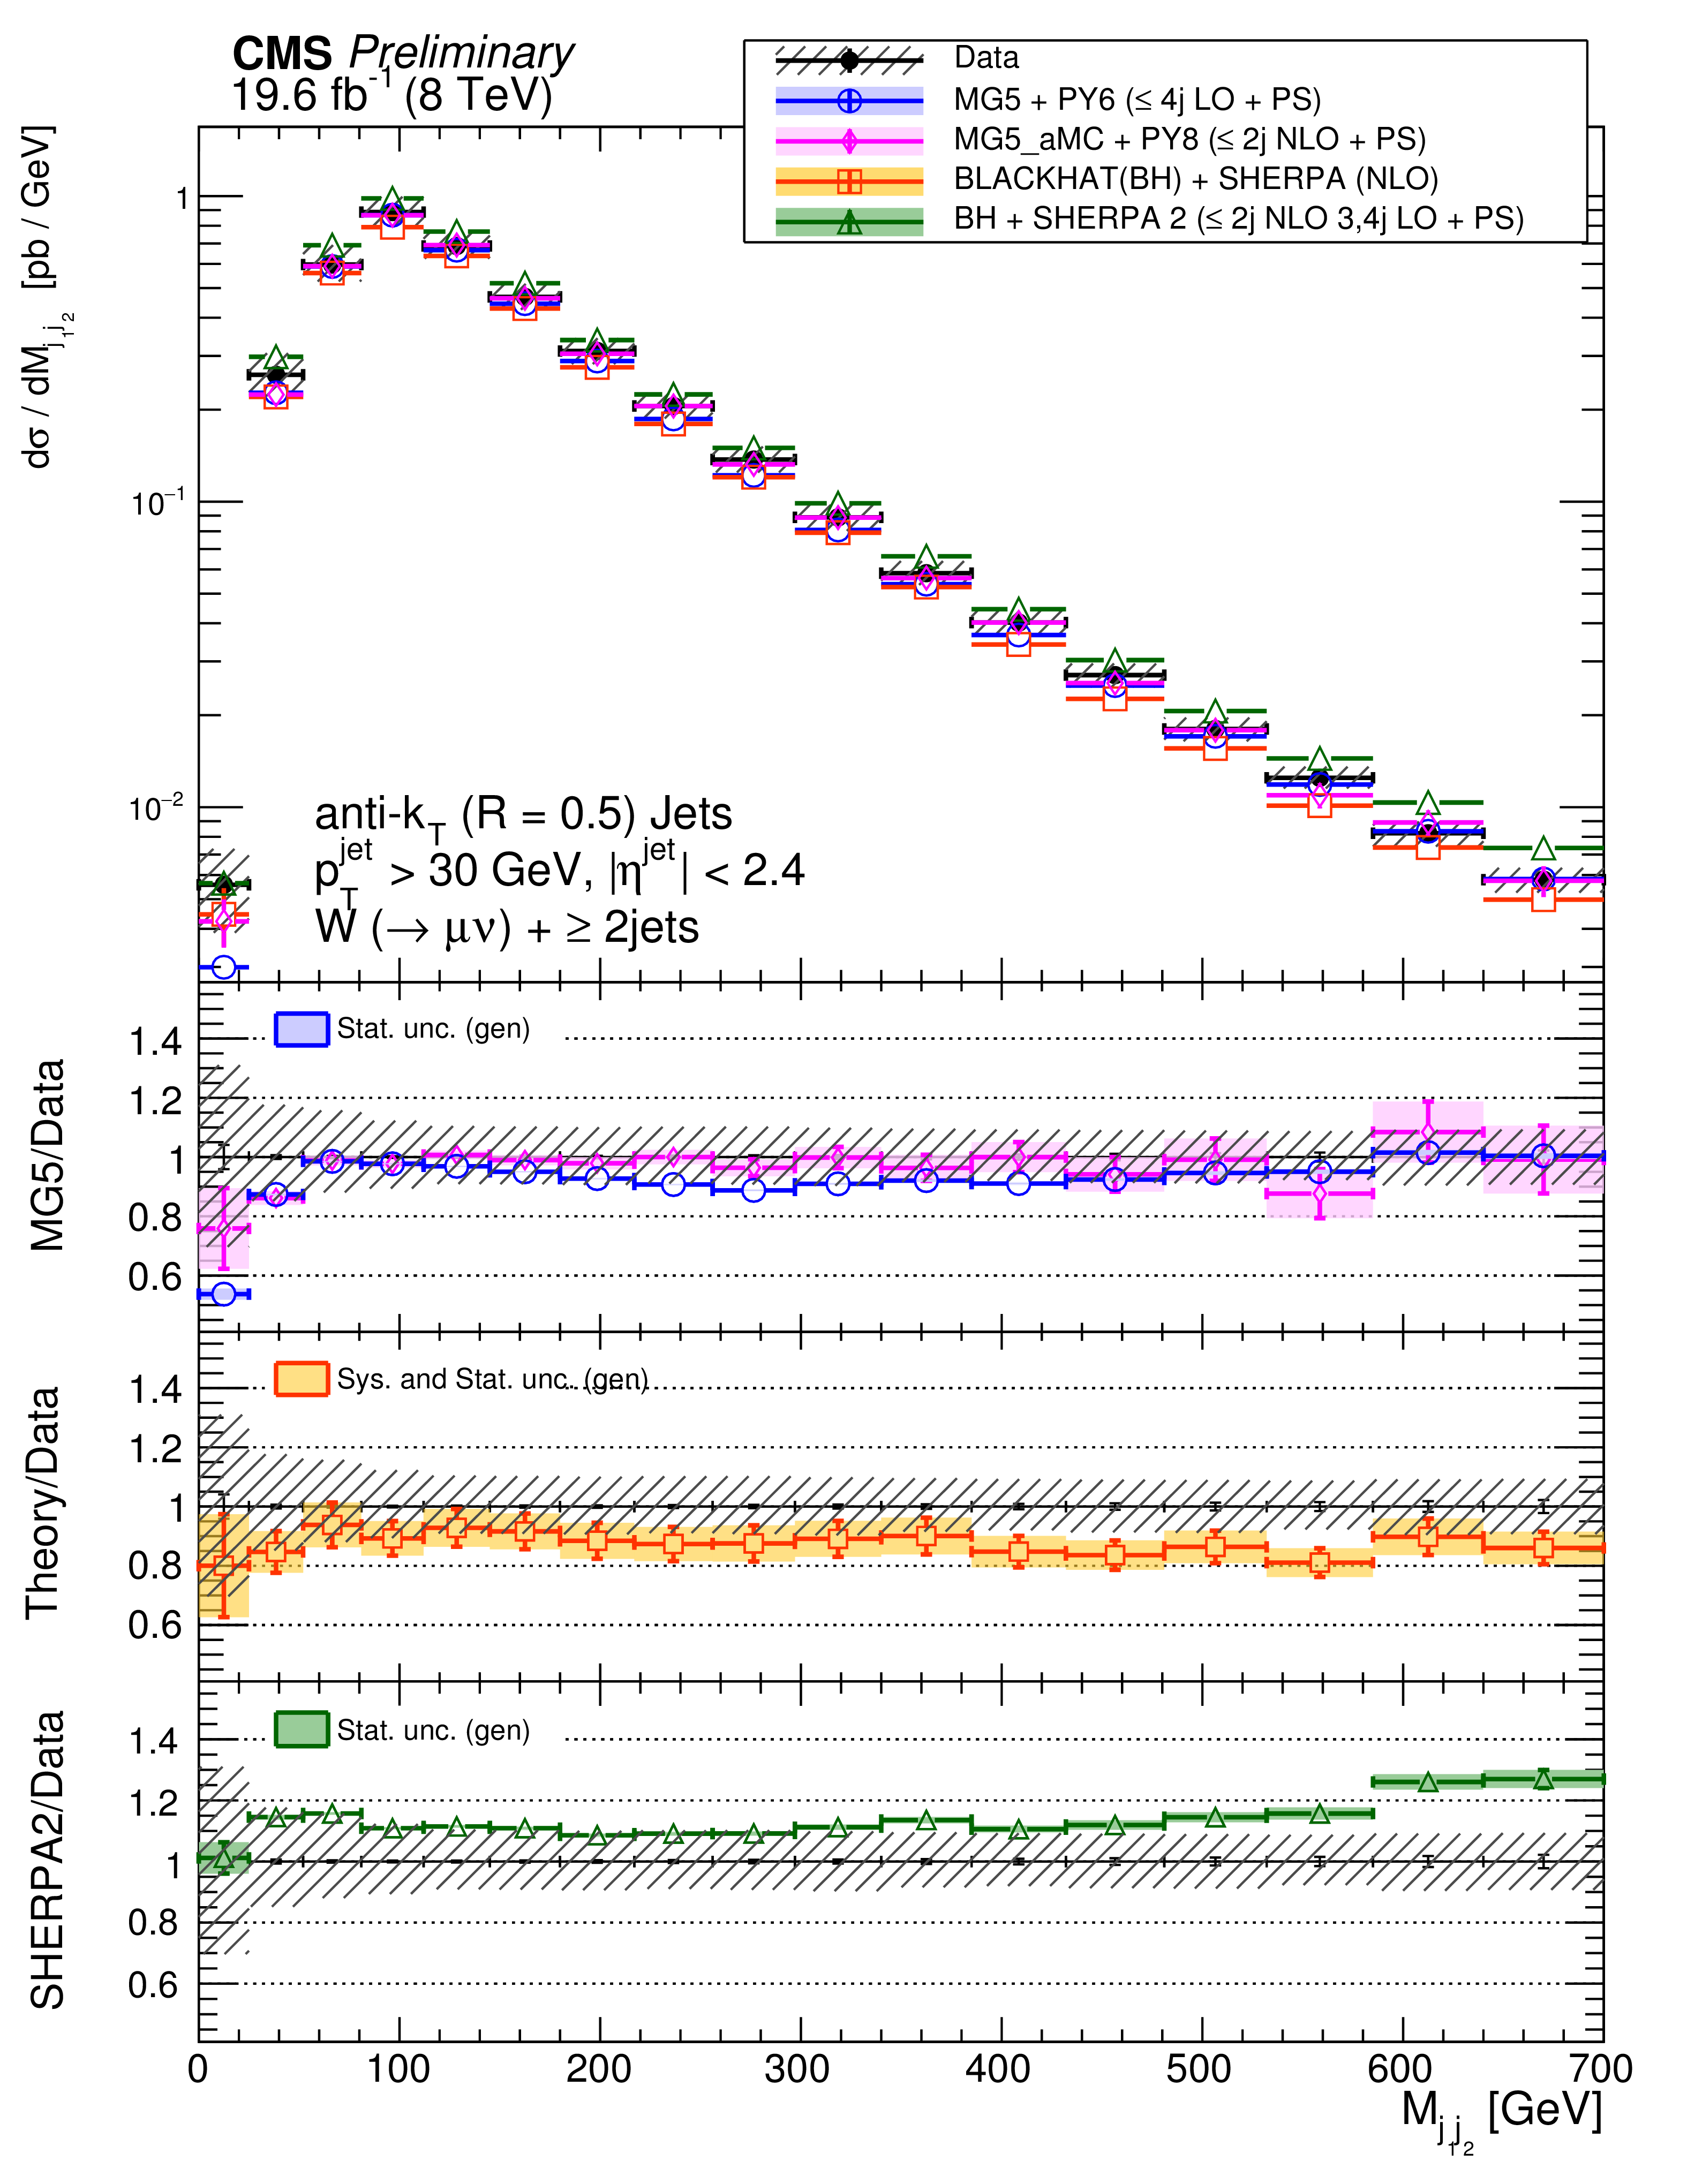
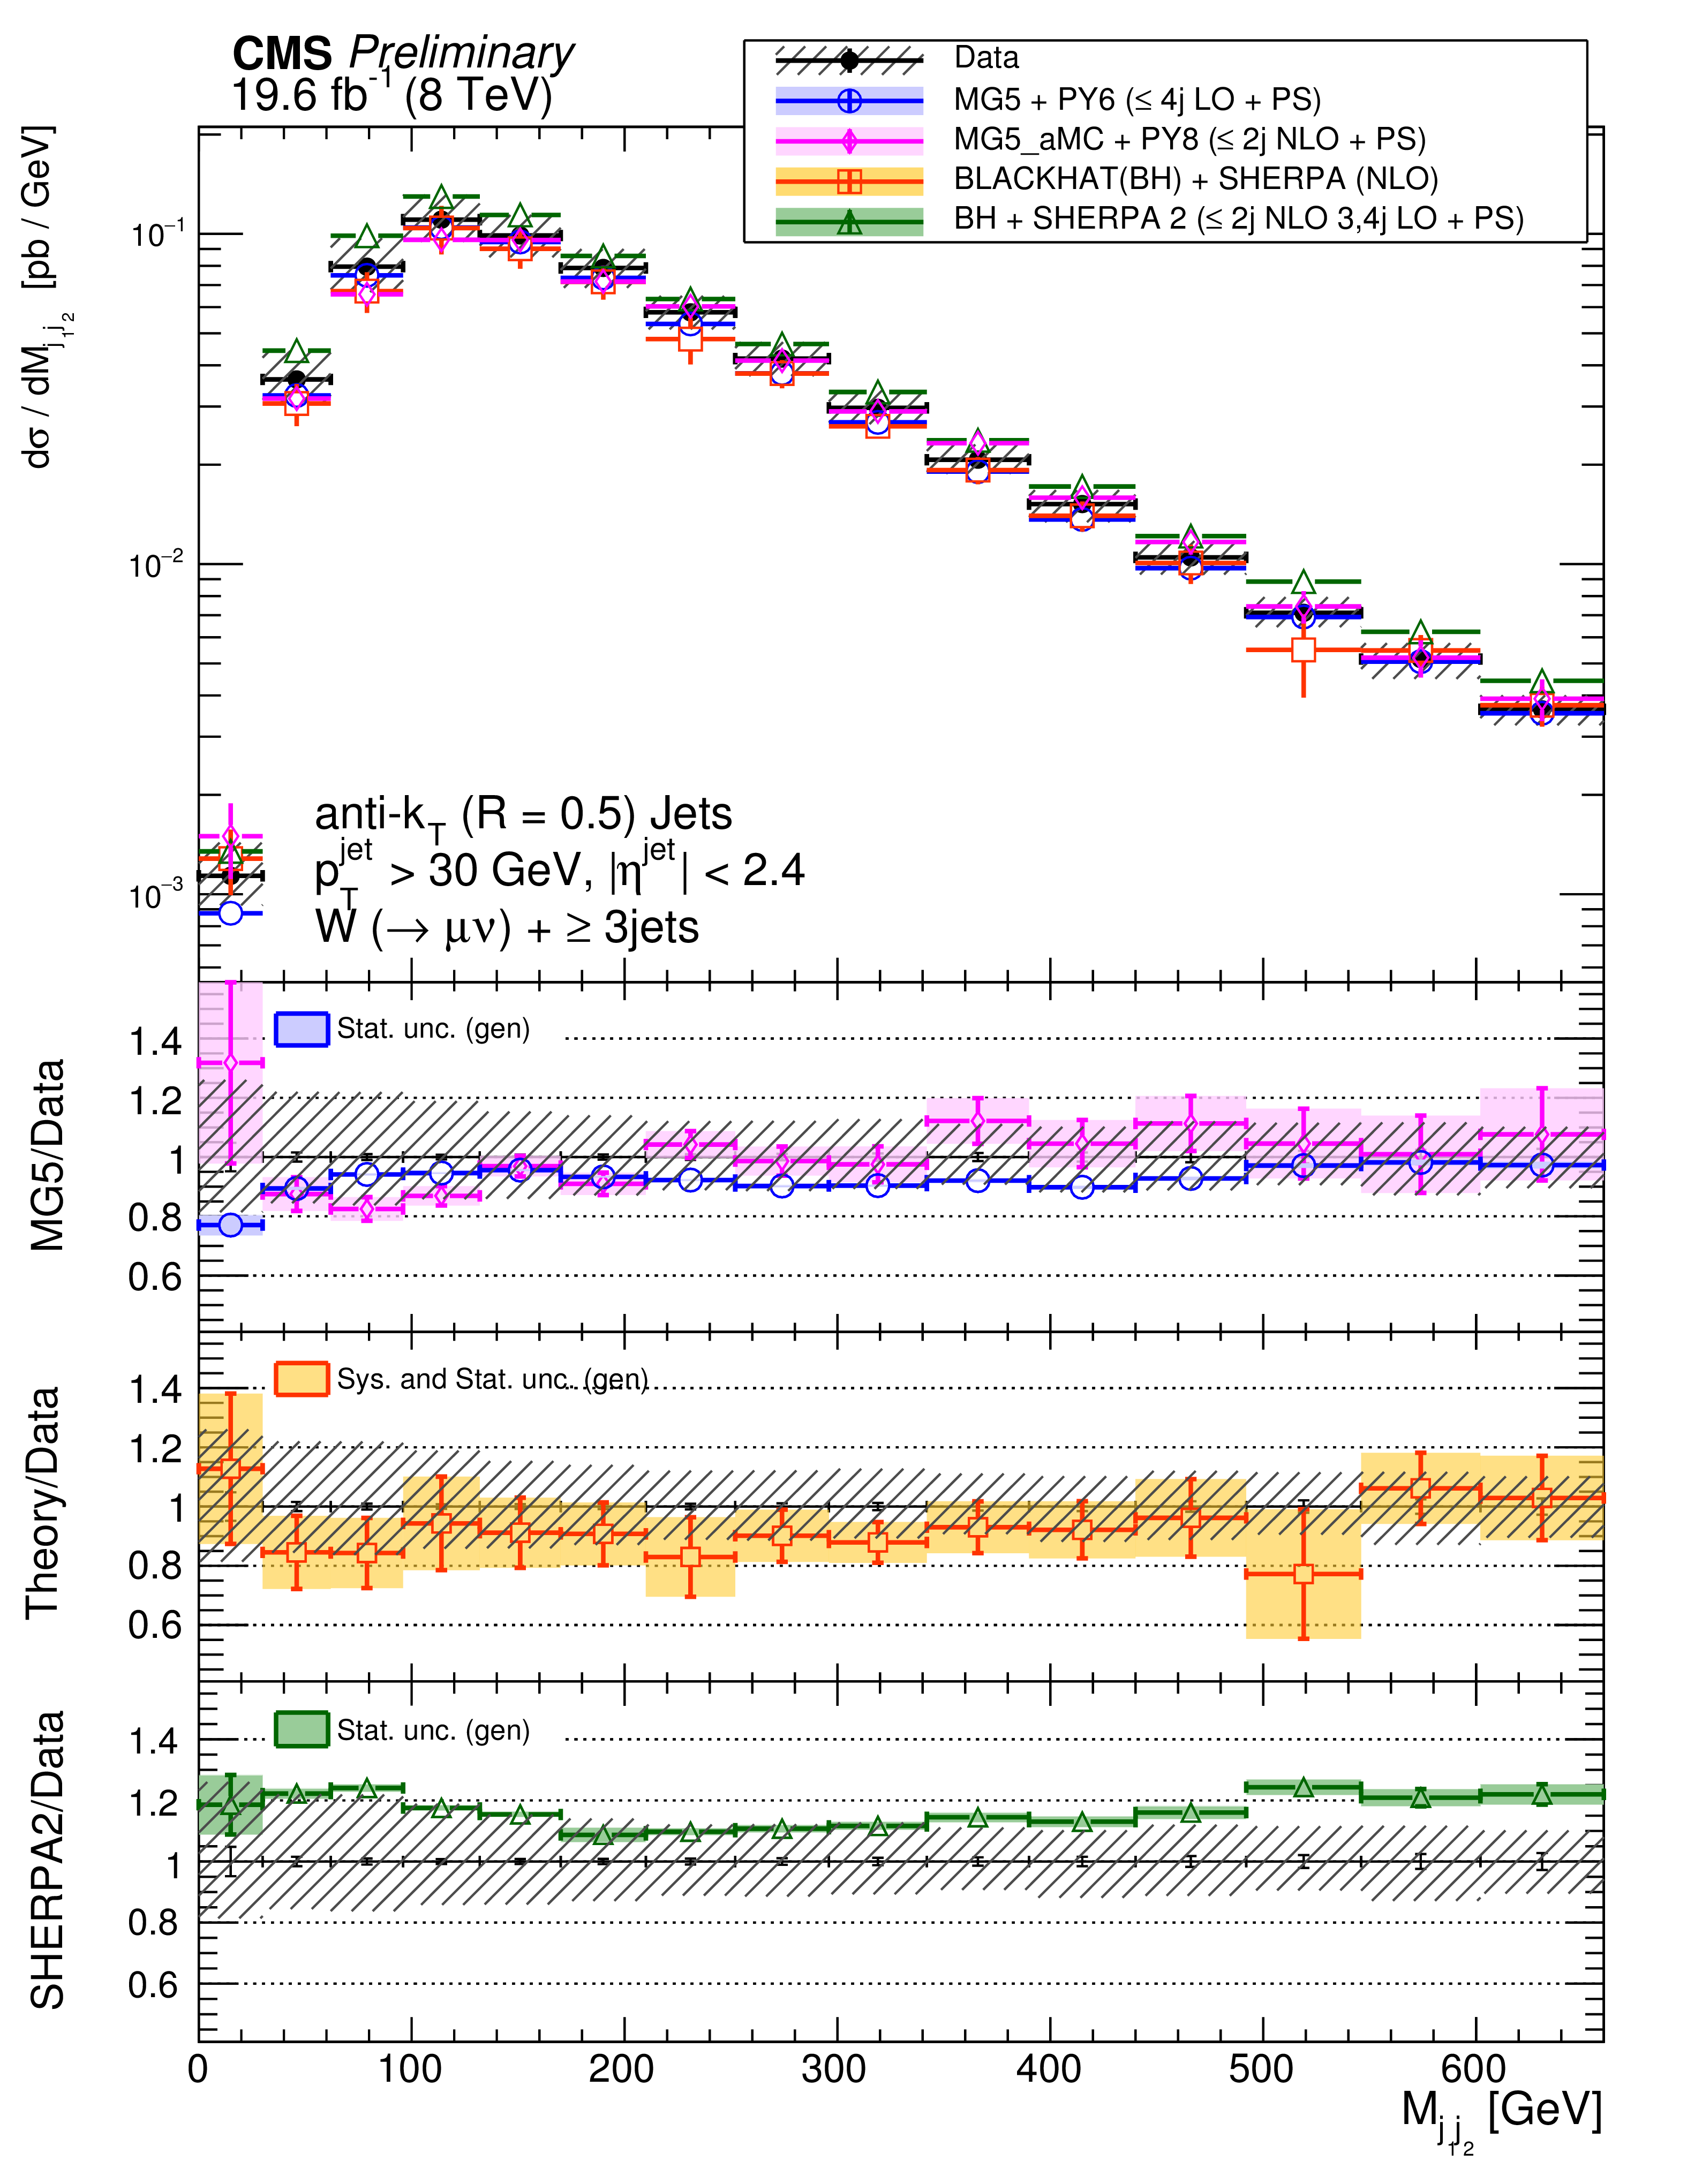
Figure 7-a:
The differential cross section measurement for the dijet invariant mass for inclusive jet multiplicities 2-4, compared to the prediction of MadGraph , MadGraph5$\_$aMC@NLO, SHERPA-2, and BLACKHAT+SHERPA (corrected for hadronization and multiple-parton interactions). Black circular markers with the grey hatched band represent the unfolded data measurement and its uncertainty. Overlaid are the predictions together with their statistical uncertainties (Theory stat.). The BLACKHAT+SHERPA uncertainty also contains theoretical systematic uncertainties (Theory syst.) described in Section 9. The lower plots show the ratio of each prediction to the unfolded data. |
png pdf |
Figure 7-b:
The differential cross section measurement for the dijet invariant mass for inclusive jet multiplicities 2-4, compared to the prediction of MadGraph , MadGraph5$\_$aMC@NLO, SHERPA-2, and BLACKHAT+SHERPA (corrected for hadronization and multiple-parton interactions). Black circular markers with the grey hatched band represent the unfolded data measurement and its uncertainty. Overlaid are the predictions together with their statistical uncertainties (Theory stat.). The BLACKHAT+SHERPA uncertainty also contains theoretical systematic uncertainties (Theory syst.) described in Section 9. The lower plots show the ratio of each prediction to the unfolded data. |

png pdf |
Figure 7-c:
The differential cross section measurement for the dijet invariant mass for inclusive jet multiplicities 2-4, compared to the prediction of MadGraph , MadGraph5$\_$aMC@NLO, SHERPA-2, and BLACKHAT+SHERPA (corrected for hadronization and multiple-parton interactions). Black circular markers with the grey hatched band represent the unfolded data measurement and its uncertainty. Overlaid are the predictions together with their statistical uncertainties (Theory stat.). The BLACKHAT+SHERPA uncertainty also contains theoretical systematic uncertainties (Theory syst.) described in Section 9. The lower plots show the ratio of each prediction to the unfolded data. |
png pdf |
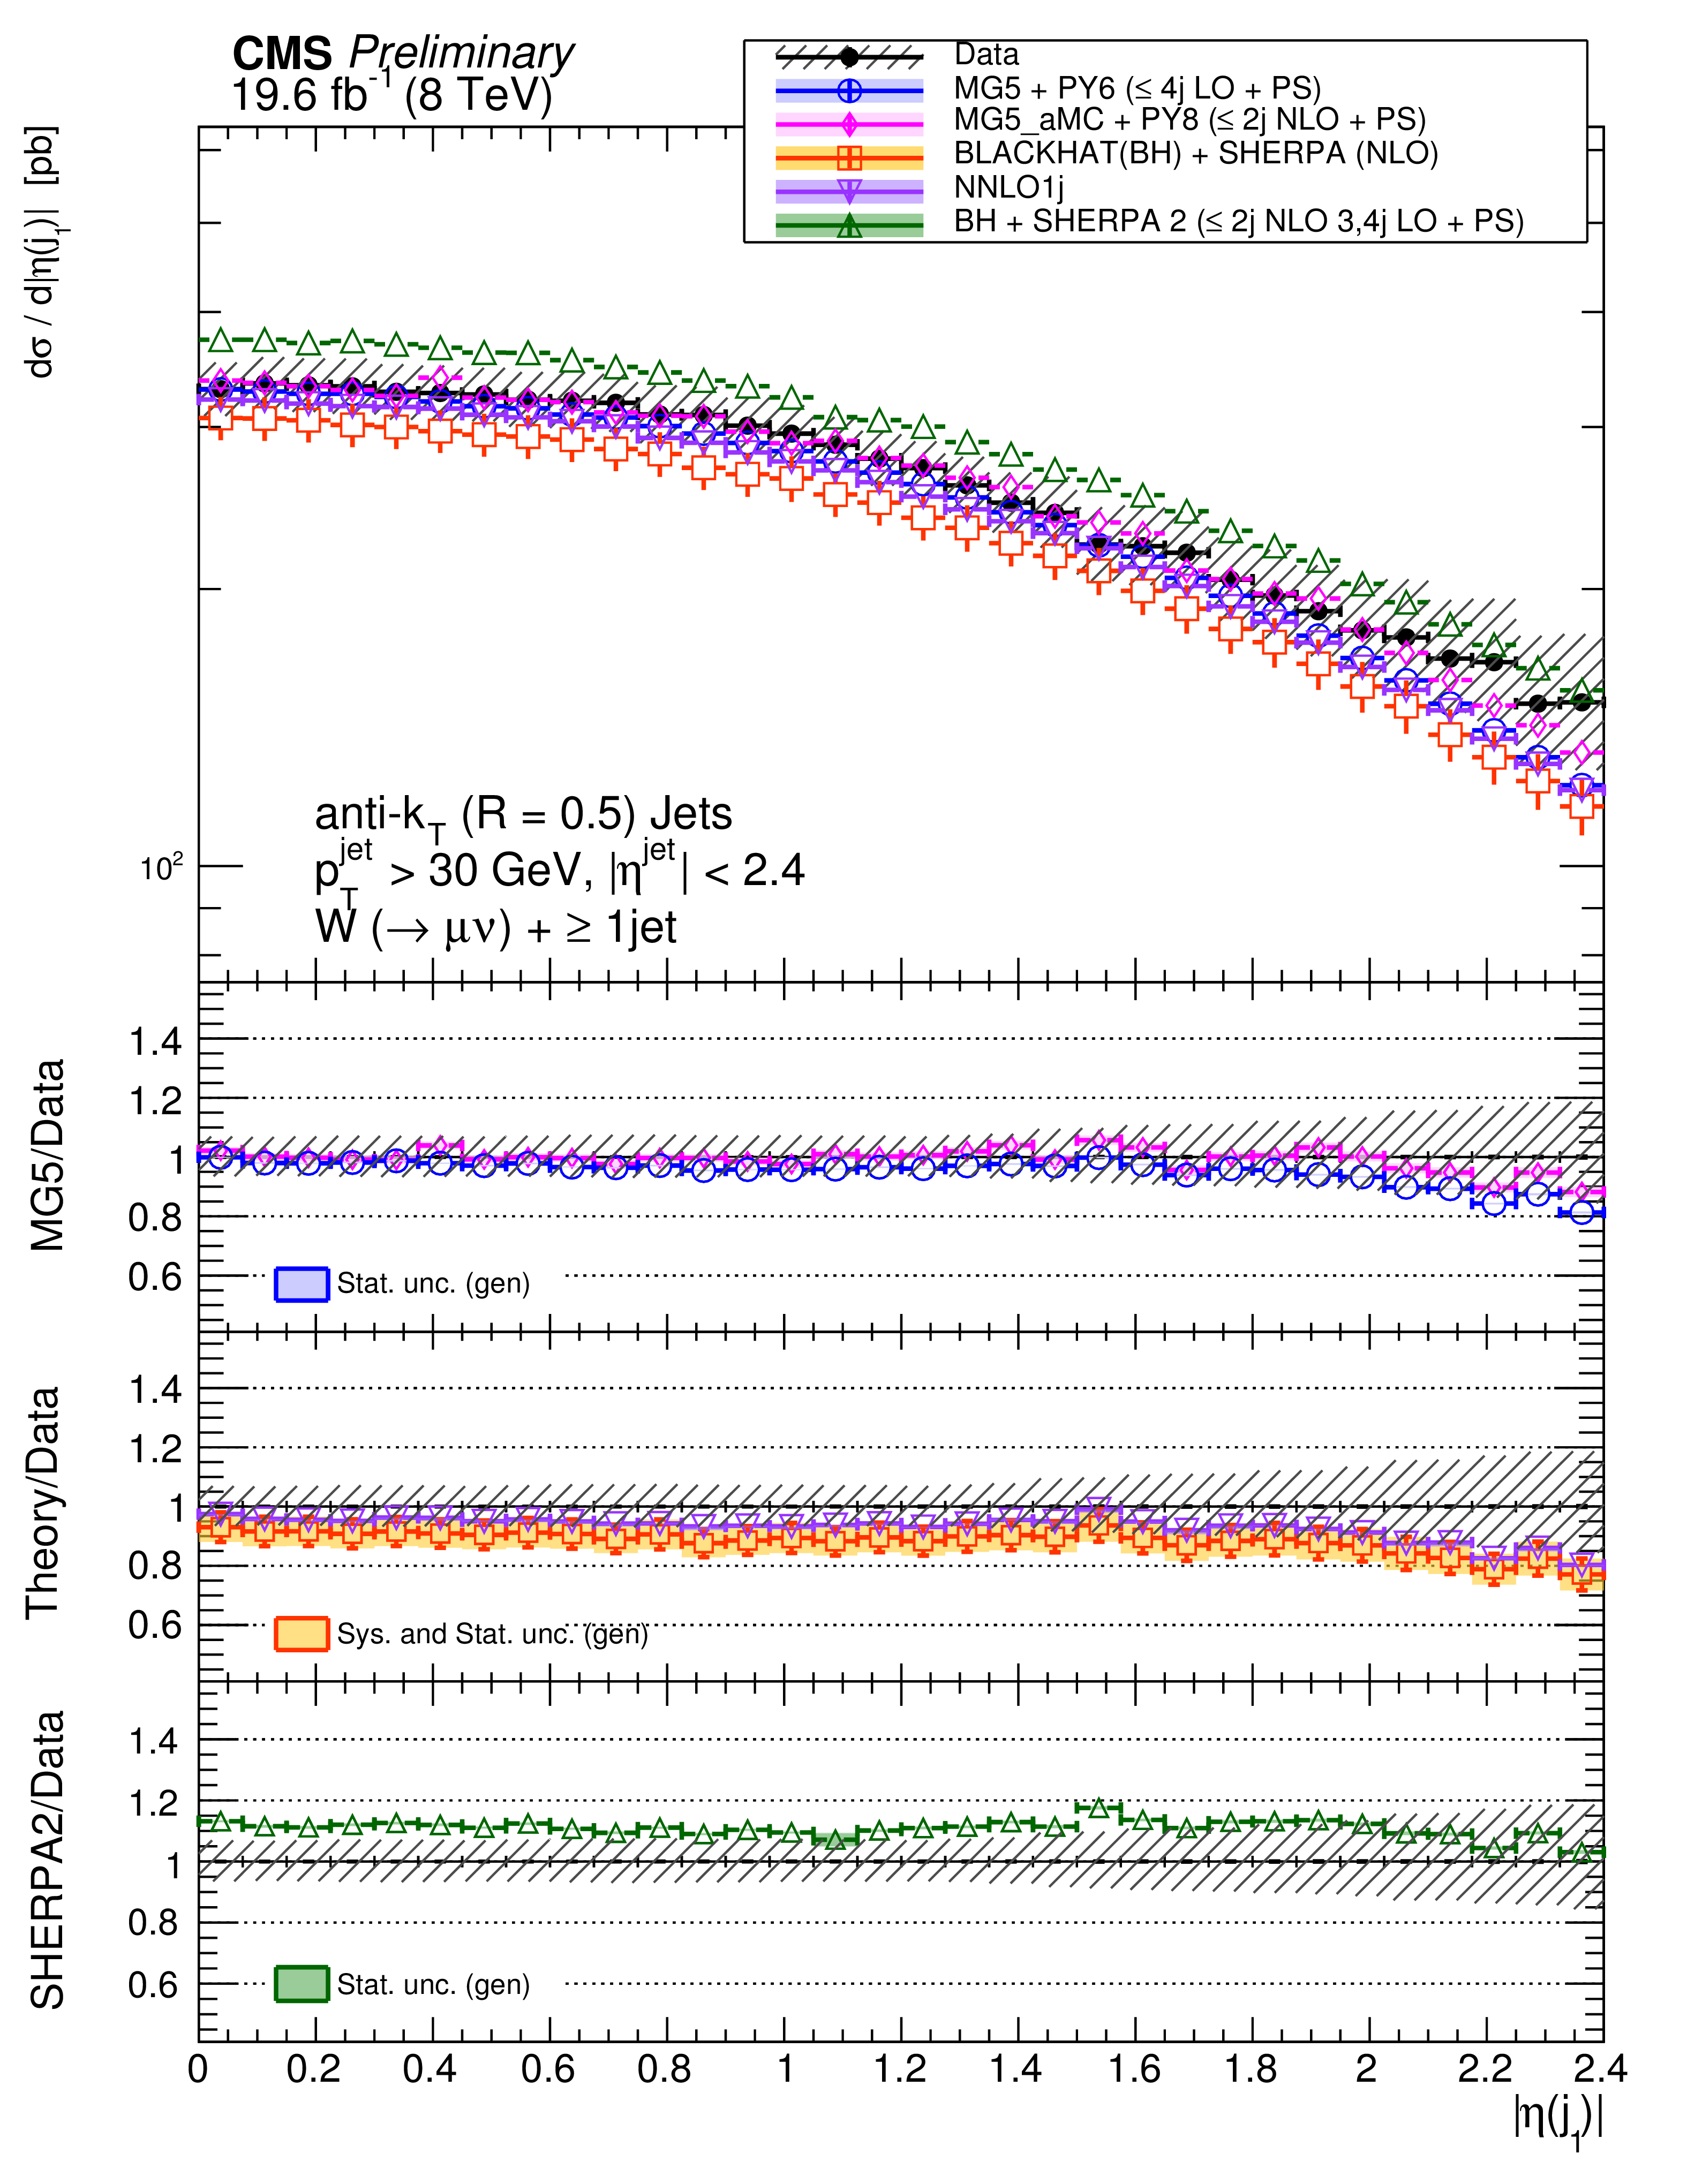
Figure 8-a:
The differential cross section measurement for the leading four jets' pseudorapidity, compared to the prediction of MadGraph , MadGraph5$\_$aMC@NLO, SHERPA-2, BLACKHAT+SHERPA , and NNLO inclusive 1 jet production (indicated as NNLO1j). BLACKHAT+SHERPA and NNLO1j are corrected for hadronisation and multiple-parton interactions effects. Black circular markers with the grey hatched band represent the unfolded data measurement and its uncertainty. Overlaid are the predictions together with their statistical uncertainties (Theory stat.). The BLACKHAT+SHERPA and the NNLO1j uncertainties also contain theoretical systematic uncertainties (Theory syst.) described in Section 9. The lower plots show the ratio of each prediction to the unfolded data. |

png pdf |
Figure 8-b:
The differential cross section measurement for the leading four jets' pseudorapidity, compared to the prediction of MadGraph , MadGraph5$\_$aMC@NLO, SHERPA-2, BLACKHAT+SHERPA , and NNLO inclusive 1 jet production (indicated as NNLO1j). BLACKHAT+SHERPA and NNLO1j are corrected for hadronisation and multiple-parton interactions effects. Black circular markers with the grey hatched band represent the unfolded data measurement and its uncertainty. Overlaid are the predictions together with their statistical uncertainties (Theory stat.). The BLACKHAT+SHERPA and the NNLO1j uncertainties also contain theoretical systematic uncertainties (Theory syst.) described in Section 9. The lower plots show the ratio of each prediction to the unfolded data. |

png pdf |
Figure 8-c:
The differential cross section measurement for the leading four jets' pseudorapidity, compared to the prediction of MadGraph , MadGraph5$\_$aMC@NLO, SHERPA-2, BLACKHAT+SHERPA , and NNLO inclusive 1 jet production (indicated as NNLO1j). BLACKHAT+SHERPA and NNLO1j are corrected for hadronisation and multiple-parton interactions effects. Black circular markers with the grey hatched band represent the unfolded data measurement and its uncertainty. Overlaid are the predictions together with their statistical uncertainties (Theory stat.). The BLACKHAT+SHERPA and the NNLO1j uncertainties also contain theoretical systematic uncertainties (Theory syst.) described in Section 9. The lower plots show the ratio of each prediction to the unfolded data. |
png pdf |
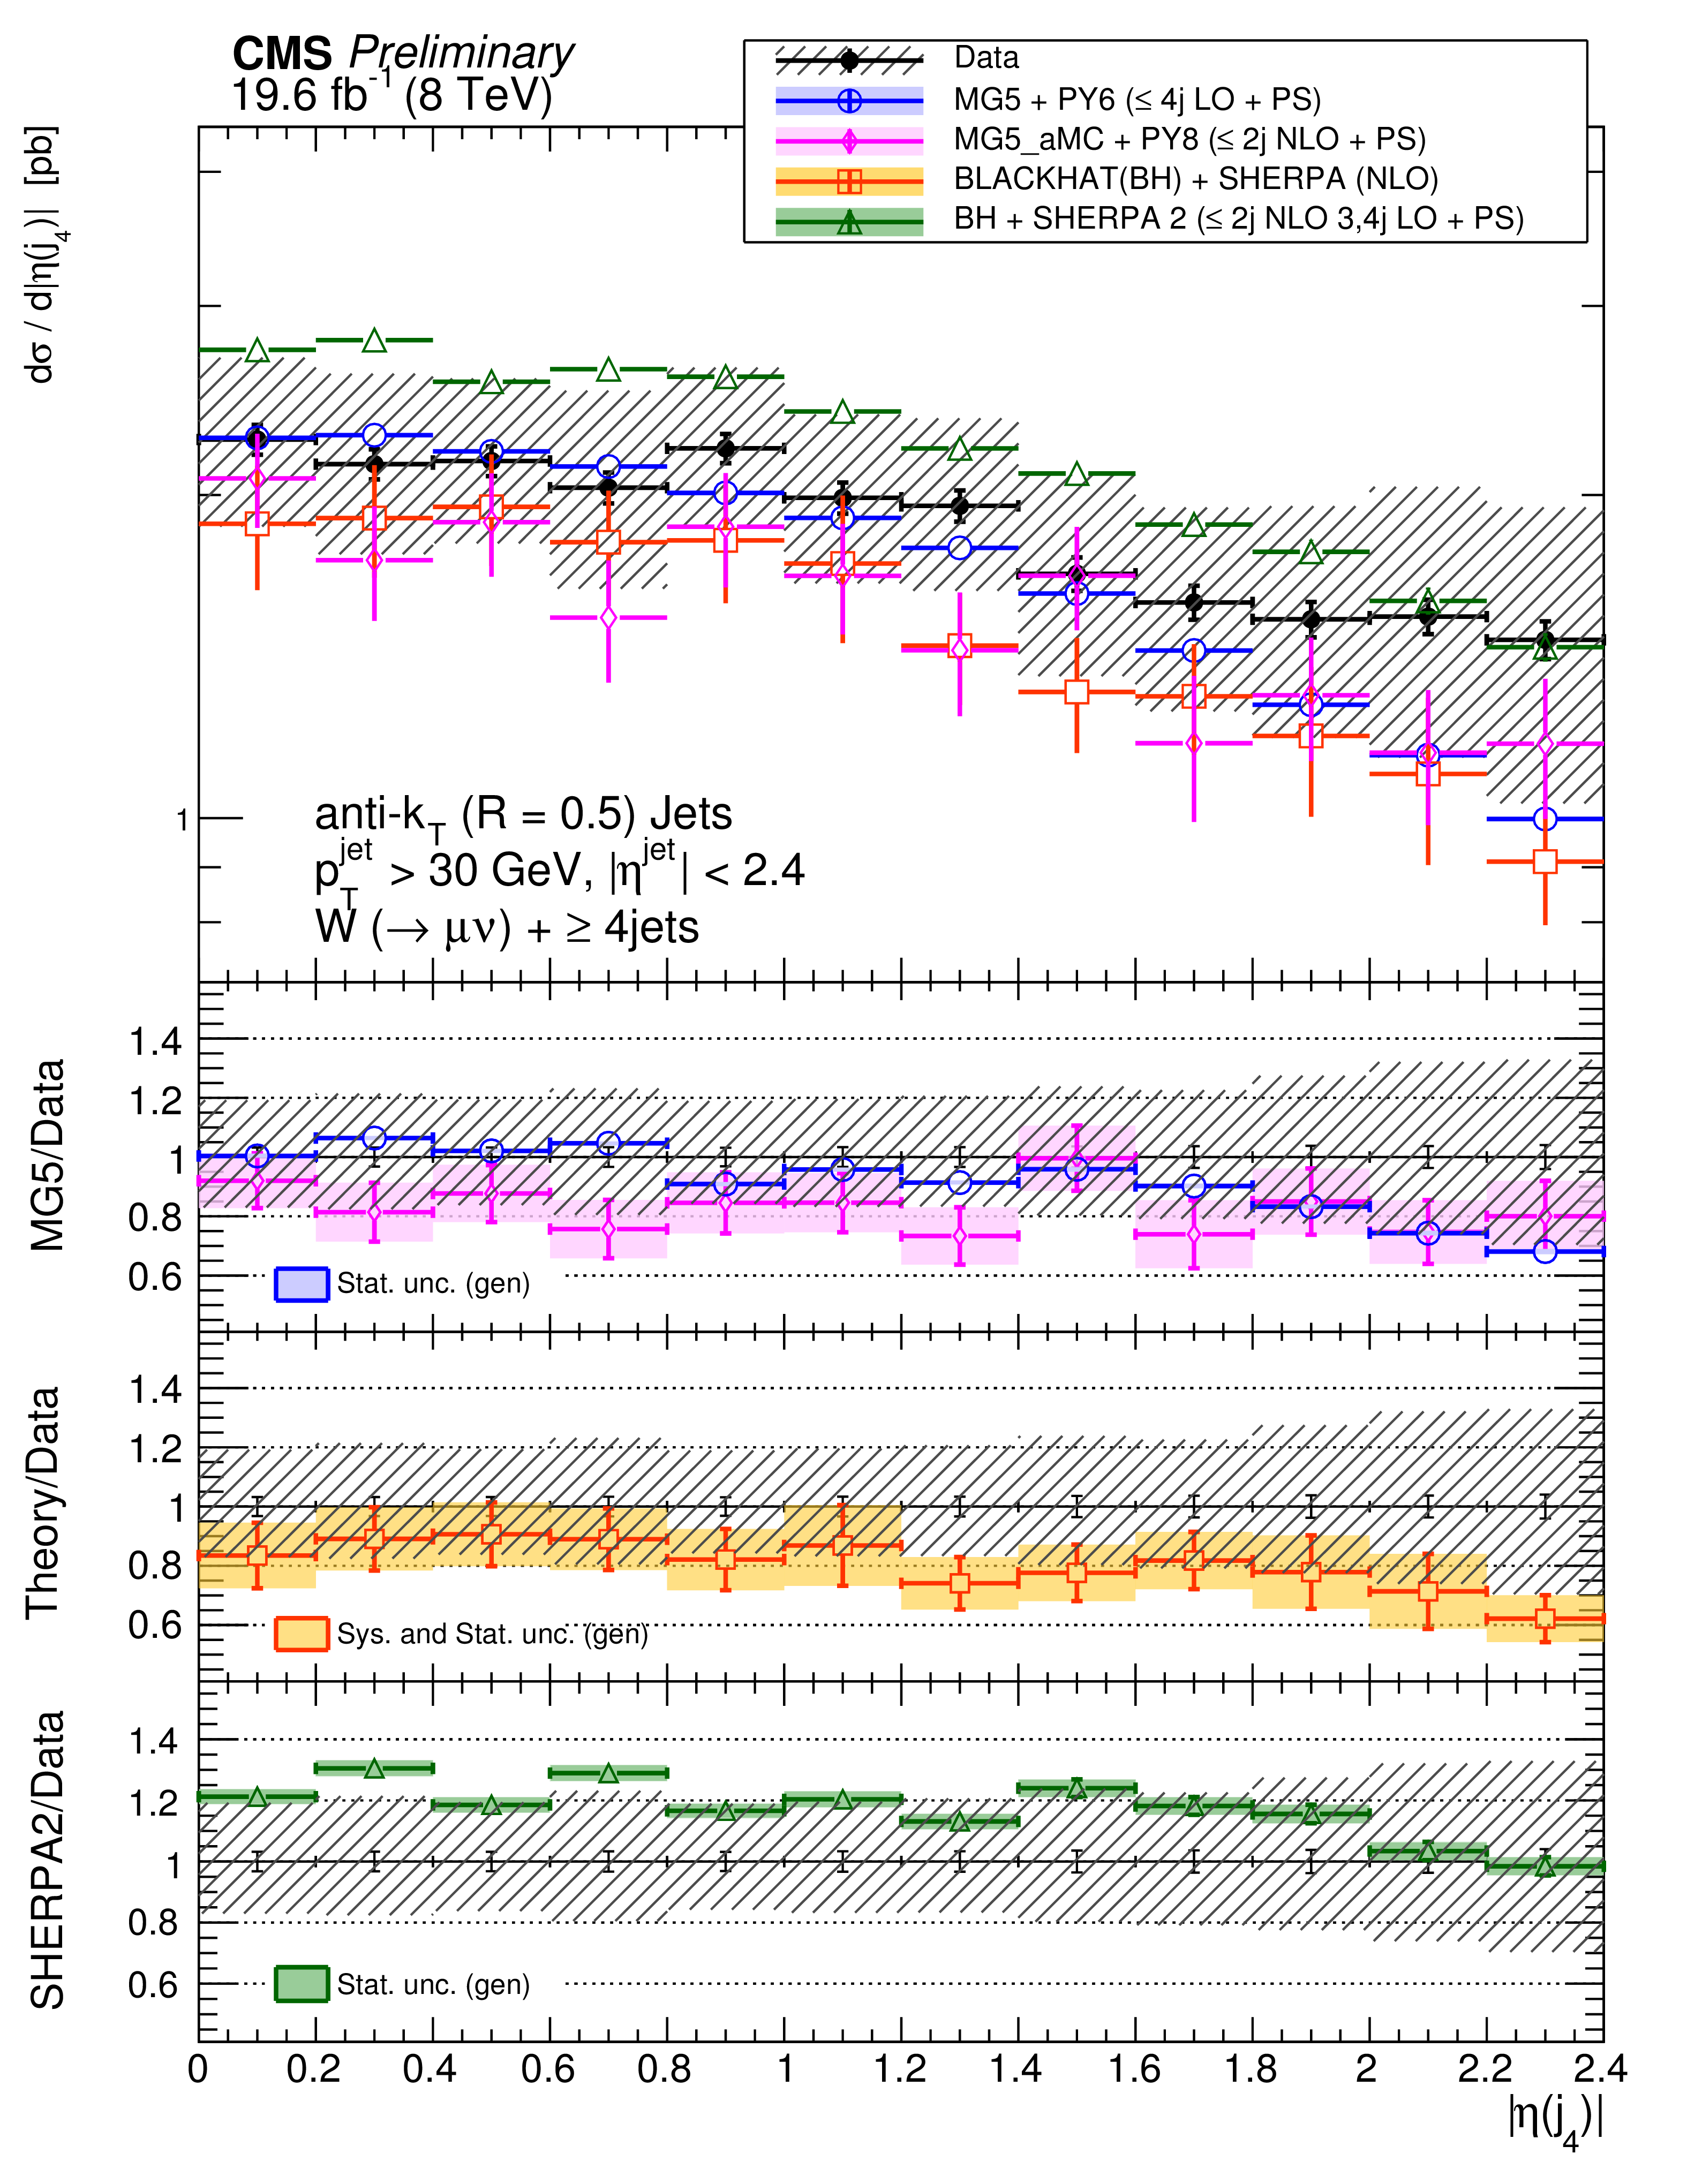
Figure 8-d:
The differential cross section measurement for the leading four jets' pseudorapidity, compared to the prediction of MadGraph , MadGraph5$\_$aMC@NLO, SHERPA-2, BLACKHAT+SHERPA , and NNLO inclusive 1 jet production (indicated as NNLO1j). BLACKHAT+SHERPA and NNLO1j are corrected for hadronisation and multiple-parton interactions effects. Black circular markers with the grey hatched band represent the unfolded data measurement and its uncertainty. Overlaid are the predictions together with their statistical uncertainties (Theory stat.). The BLACKHAT+SHERPA and the NNLO1j uncertainties also contain theoretical systematic uncertainties (Theory syst.) described in Section 9. The lower plots show the ratio of each prediction to the unfolded data. |

png pdf |
Figure 9-a:
The differential cross section measurement for $\Delta y(j_1,j_2)$ for inclusive jet multiplicities 2-4, compared to the prediction of MadGraph , MadGraph5$\_$aMC@NLO, SHERPA-2, and BLACKHAT+SHERPA (corrected for hadronization and multiple-parton interactions). Black circular markers with the grey hatched band represent the unfolded data measurement and its uncertainty. Overlaid are the predictions together with their statistical uncertainties (Theory stat.). The BLACKHAT+SHERPA uncertainty also contains theoretical systematic uncertainties (Theory syst.) described in Section 9. The lower plots show the ratio of each prediction to the unfolded data. |
png pdf |
Figure 9-b:
The differential cross section measurement for $\Delta y(j_1,j_2)$ for inclusive jet multiplicities 2-4, compared to the prediction of MadGraph , MadGraph5$\_$aMC@NLO, SHERPA-2, and BLACKHAT+SHERPA (corrected for hadronization and multiple-parton interactions). Black circular markers with the grey hatched band represent the unfolded data measurement and its uncertainty. Overlaid are the predictions together with their statistical uncertainties (Theory stat.). The BLACKHAT+SHERPA uncertainty also contains theoretical systematic uncertainties (Theory syst.) described in Section 9. The lower plots show the ratio of each prediction to the unfolded data. |
png pdf |
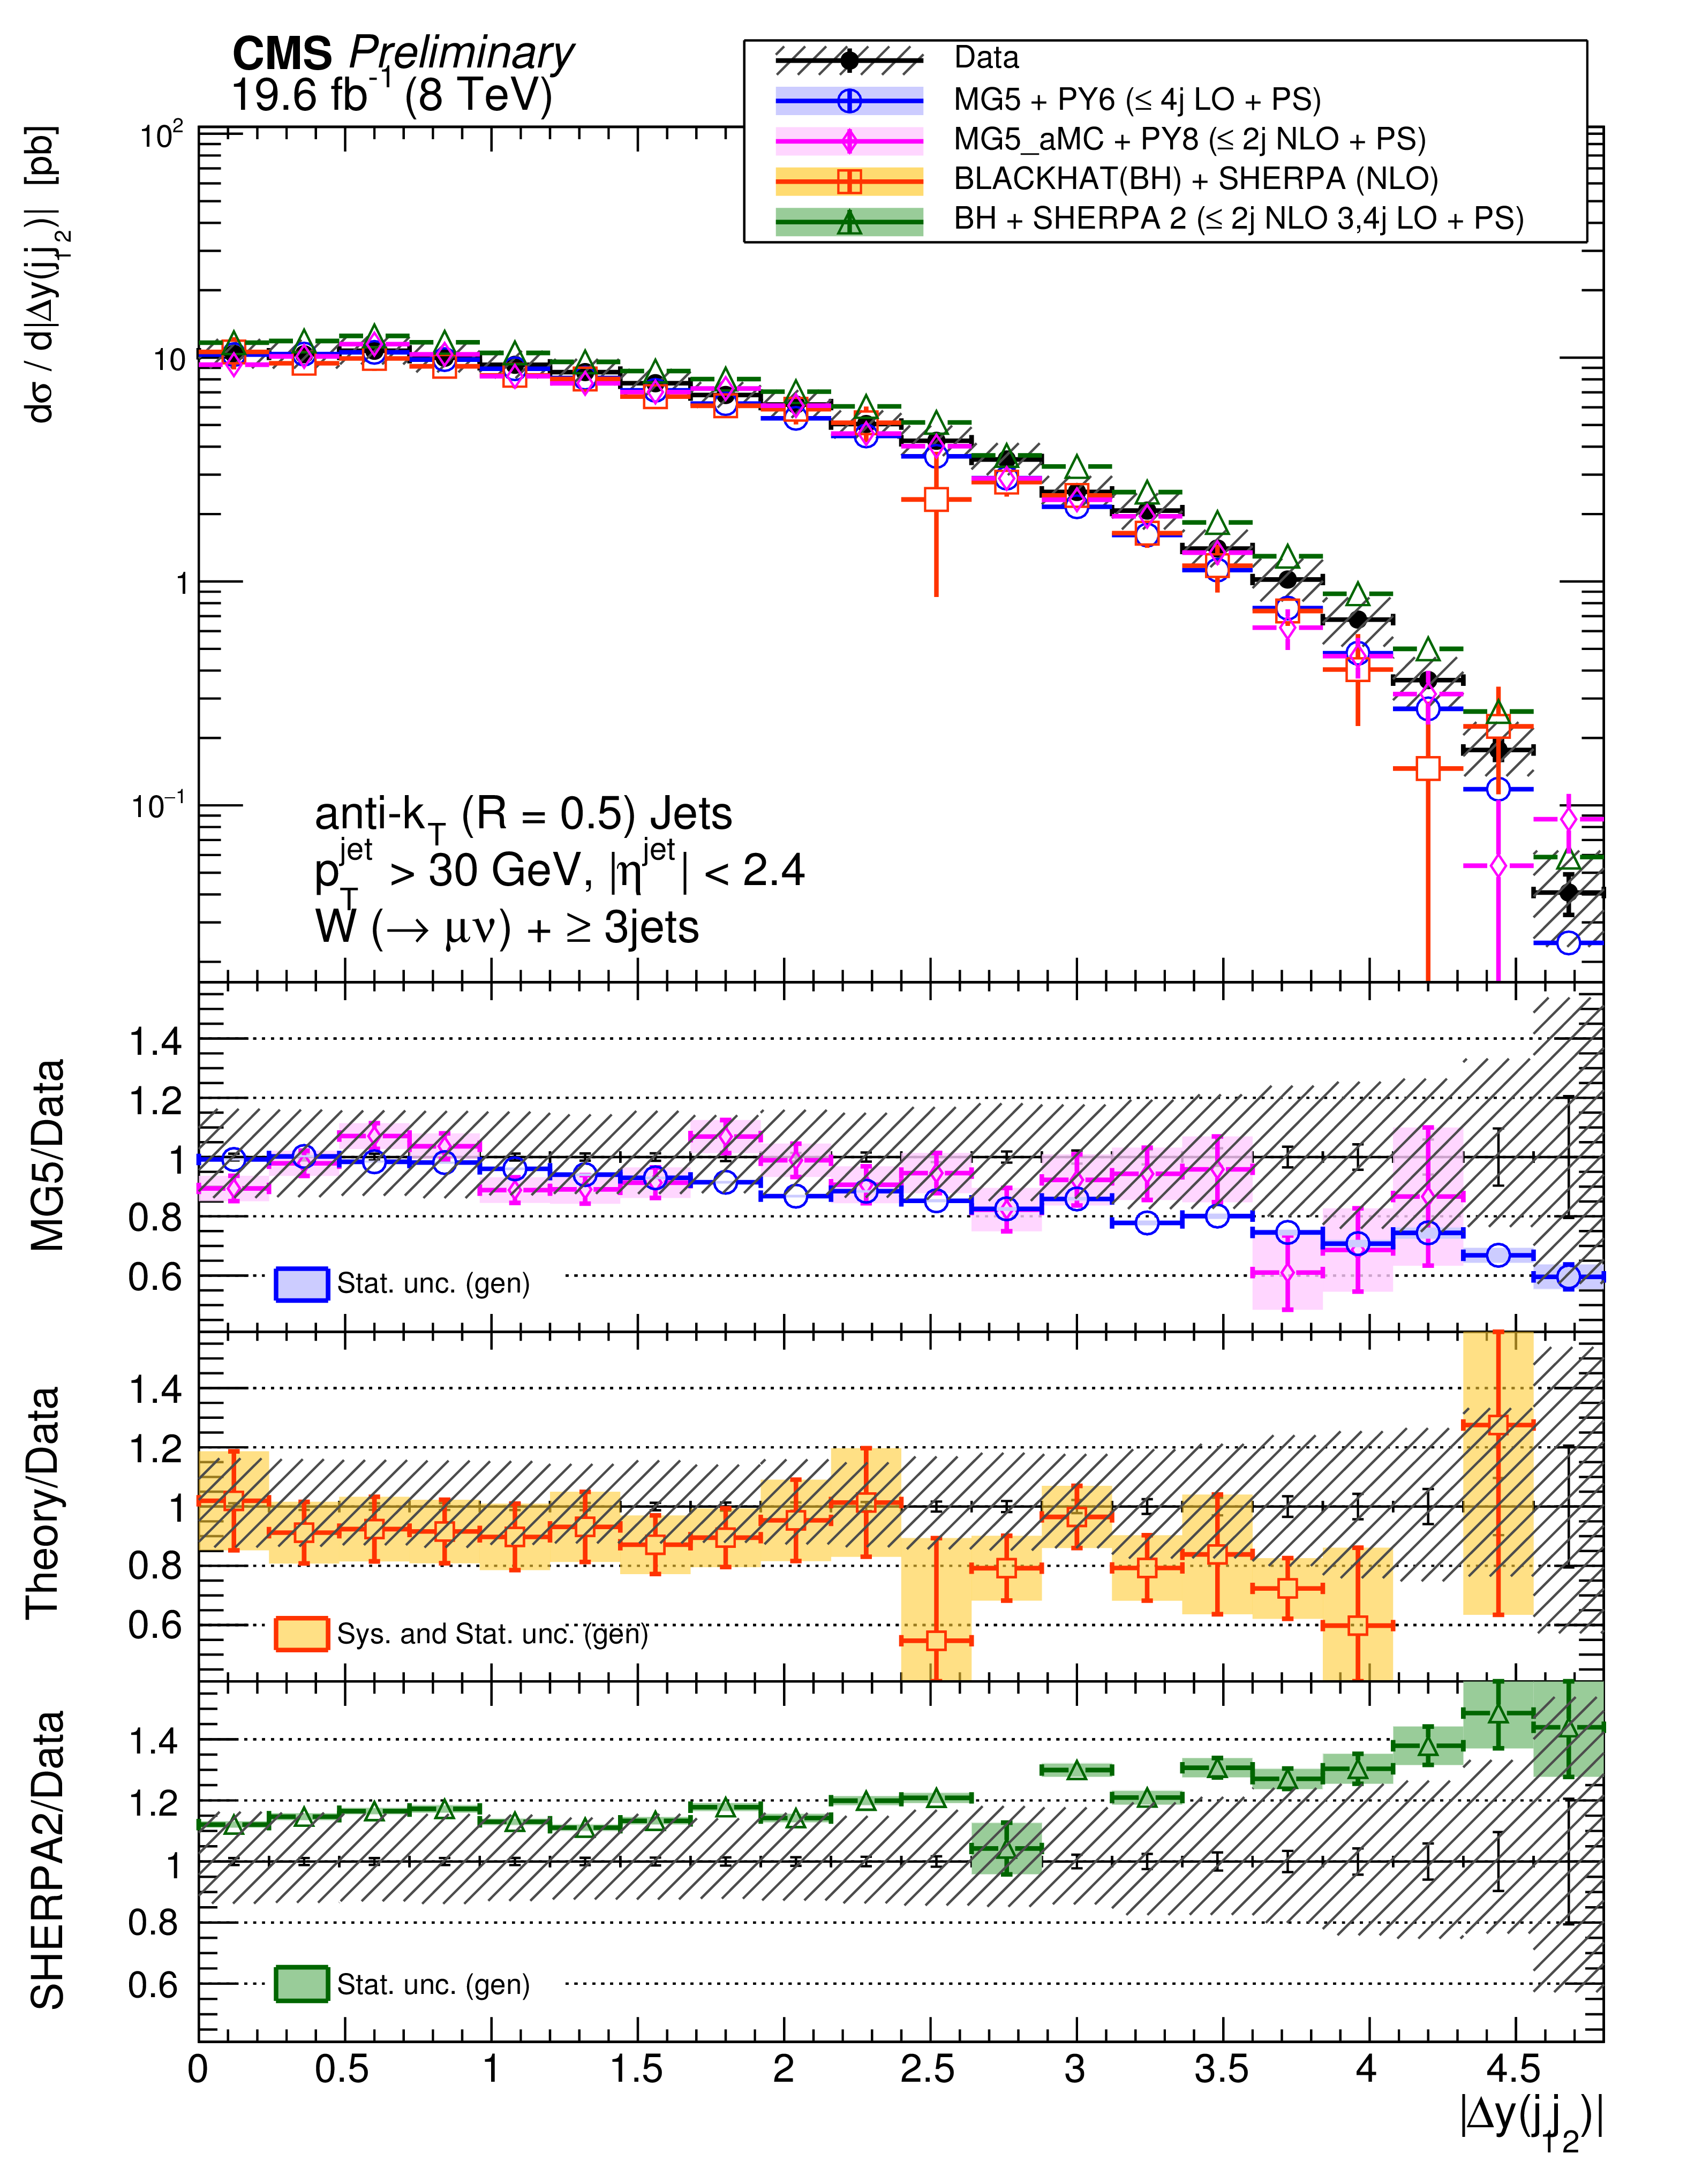
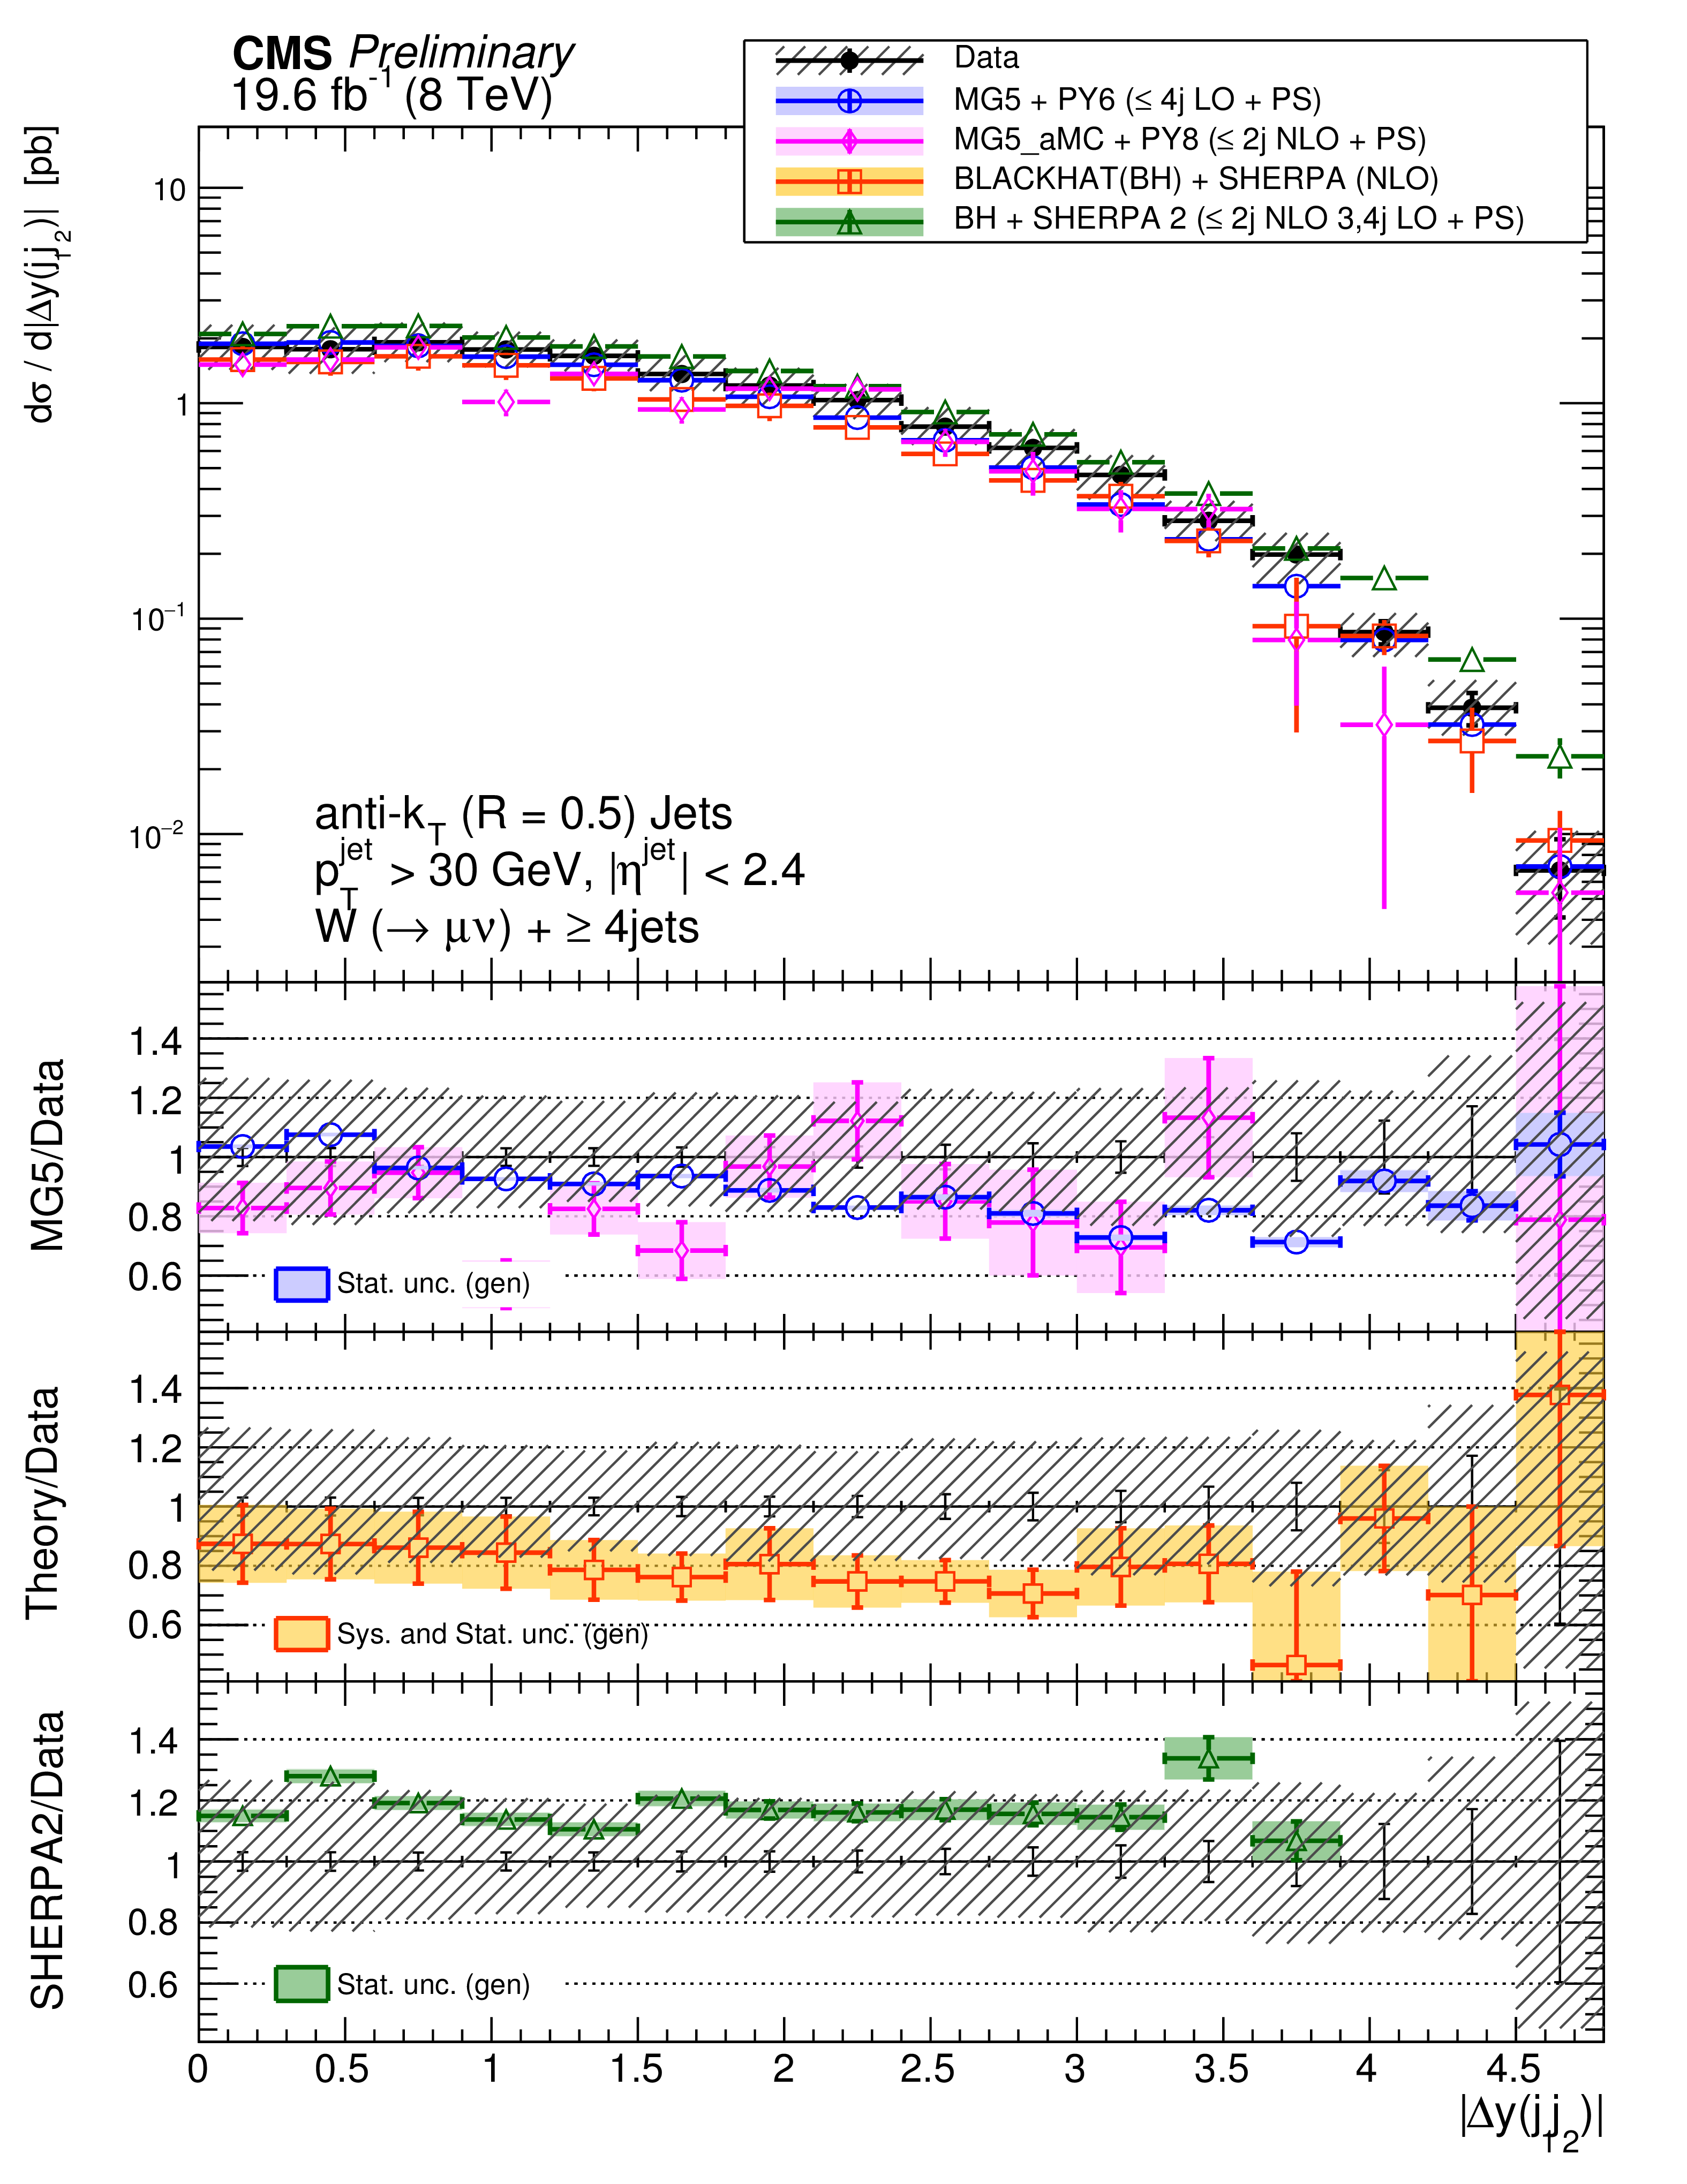
Figure 9-c:
The differential cross section measurement for $\Delta y(j_1,j_2)$ for inclusive jet multiplicities 2-4, compared to the prediction of MadGraph , MadGraph5$\_$aMC@NLO, SHERPA-2, and BLACKHAT+SHERPA (corrected for hadronization and multiple-parton interactions). Black circular markers with the grey hatched band represent the unfolded data measurement and its uncertainty. Overlaid are the predictions together with their statistical uncertainties (Theory stat.). The BLACKHAT+SHERPA uncertainty also contains theoretical systematic uncertainties (Theory syst.) described in Section 9. The lower plots show the ratio of each prediction to the unfolded data. |

png pdf |
Figure 10-a:
The differential cross section measurement for $\Delta y(j_1,j_3)$ and $\Delta y(j_2,j_3)$ for an inclusive jet multiplicity of 3, compared to the prediction of MadGraph , MadGraph5$\_$aMC@NLO, SHERPA-2, and BLACKHAT+SHERPA (corrected for hadronization and multiple-parton interactions). Black circular markers with the grey hatched band represent the unfolded data measurement and its uncertainty. Overlaid are the predictions together with their statistical uncertainties (Theory stat.). The BLACKHAT+SHERPA uncertainty also contains theoretical systematic uncertainties (Theory syst.) described in Section 9. The lower plots show the ratio of each prediction to the unfolded data. |

png pdf |
Figure 10-b:
The differential cross section measurement for $\Delta y(j_1,j_3)$ and $\Delta y(j_2,j_3)$ for an inclusive jet multiplicity of 3, compared to the prediction of MadGraph , MadGraph5$\_$aMC@NLO, SHERPA-2, and BLACKHAT+SHERPA (corrected for hadronization and multiple-parton interactions). Black circular markers with the grey hatched band represent the unfolded data measurement and its uncertainty. Overlaid are the predictions together with their statistical uncertainties (Theory stat.). The BLACKHAT+SHERPA uncertainty also contains theoretical systematic uncertainties (Theory syst.) described in Section 9. The lower plots show the ratio of each prediction to the unfolded data. |

png pdf |
Figure 11-a:
The differential cross section measurement for $\Delta y(j_F,j_B)$ for inclusive jet multiplicities 2-4, compared to the prediction of MadGraph , MadGraph5$\_$aMC@NLO, SHERPA-2, and BLACKHAT+SHERPA (corrected for hadronization and multiple-parton interactions). Black circular markers with the grey hatched band represent the unfolded data measurement and its uncertainty. Overlaid are the predictions together with their statistical uncertainties (Theory stat.). The BLACKHAT+SHERPA uncertainty also contains theoretical systematic uncertainties (Theory syst.) described in Section 9. The lower plots show the ratio of each prediction to the unfolded data. |

png pdf |
Figure 11-b:
The differential cross section measurement for $\Delta y(j_F,j_B)$ for inclusive jet multiplicities 2-4, compared to the prediction of MadGraph , MadGraph5$\_$aMC@NLO, SHERPA-2, and BLACKHAT+SHERPA (corrected for hadronization and multiple-parton interactions). Black circular markers with the grey hatched band represent the unfolded data measurement and its uncertainty. Overlaid are the predictions together with their statistical uncertainties (Theory stat.). The BLACKHAT+SHERPA uncertainty also contains theoretical systematic uncertainties (Theory syst.) described in Section 9. The lower plots show the ratio of each prediction to the unfolded data. |

png pdf |
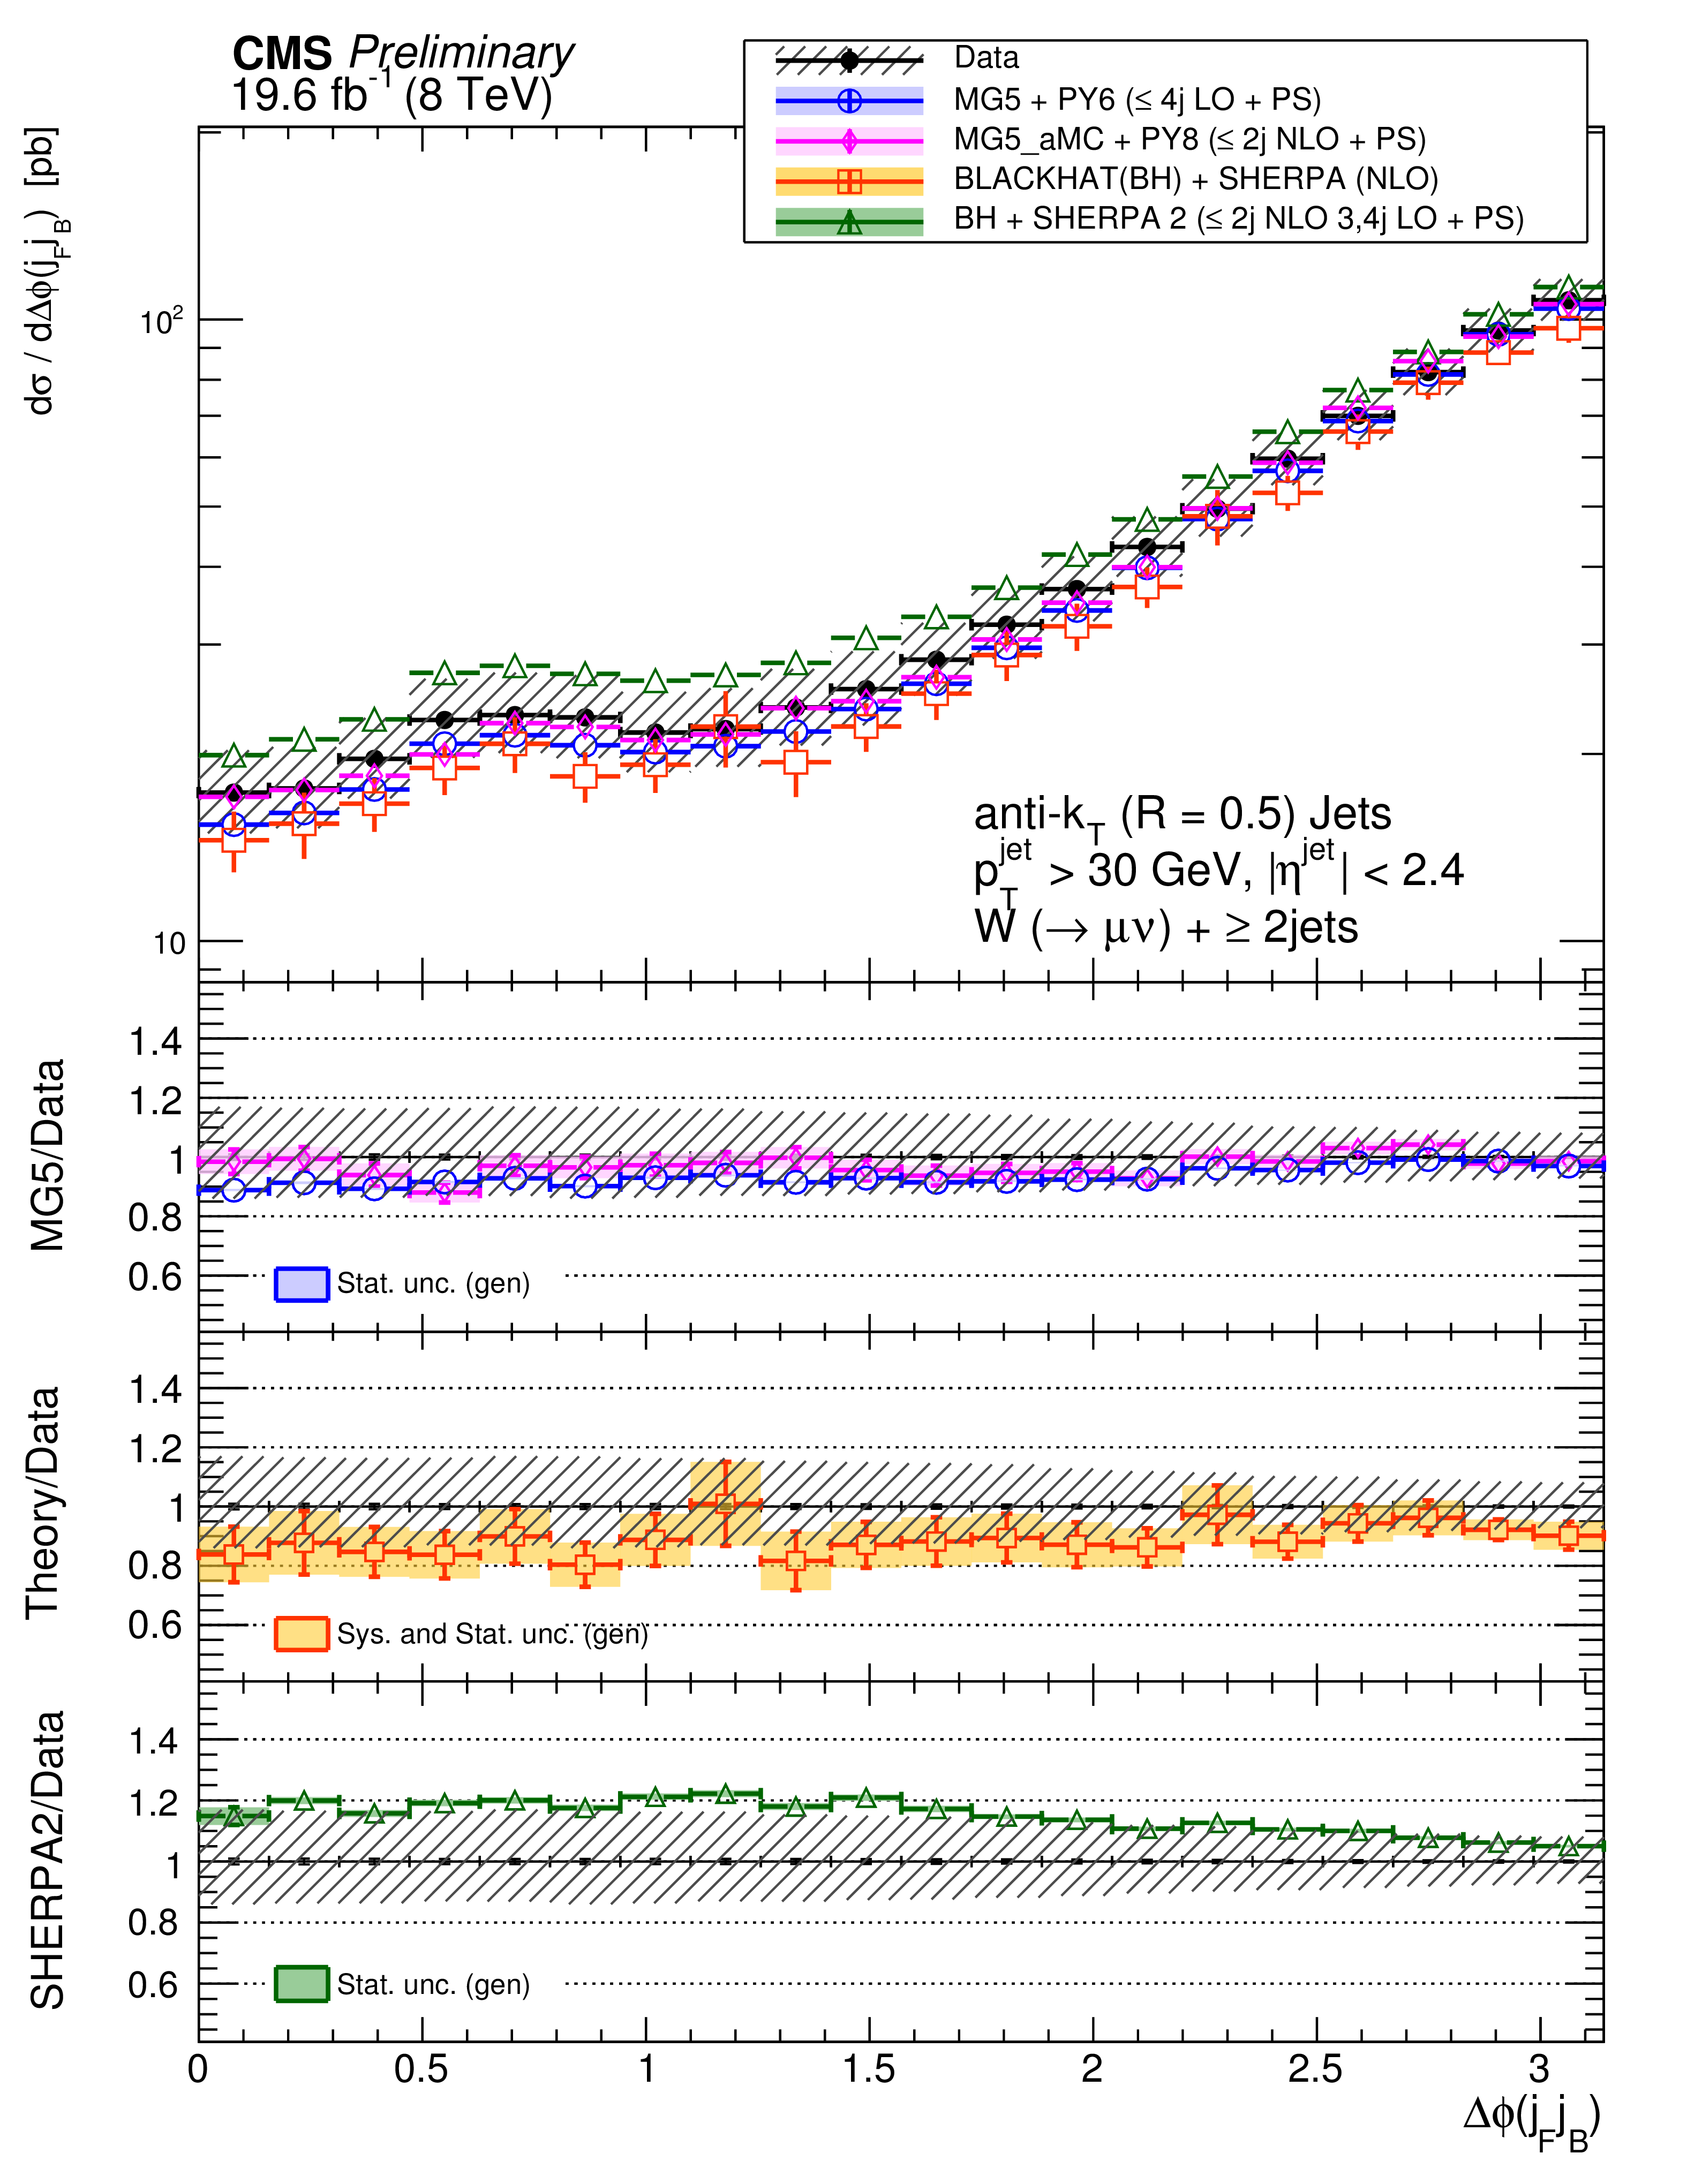
Figure 11-c:
The differential cross section measurement for $\Delta y(j_F,j_B)$ for inclusive jet multiplicities 2-4, compared to the prediction of MadGraph , MadGraph5$\_$aMC@NLO, SHERPA-2, and BLACKHAT+SHERPA (corrected for hadronization and multiple-parton interactions). Black circular markers with the grey hatched band represent the unfolded data measurement and its uncertainty. Overlaid are the predictions together with their statistical uncertainties (Theory stat.). The BLACKHAT+SHERPA uncertainty also contains theoretical systematic uncertainties (Theory syst.) described in Section 9. The lower plots show the ratio of each prediction to the unfolded data. |

png pdf |
Figure 12-a:
The differential cross section measurement for $\Delta \phi (j_1,j_2)$ and $\Delta \phi (j_F,j_B)$ for inclusive jet multiplicity of 2, compared to the prediction of MadGraph , MadGraph5$\_$aMC@NLO, SHERPA-2, and BLACKHAT+SHERPA (corrected for hadronization and multiple-parton interactions). Black circular markers with the grey hatched band represent the unfolded data measurement and its uncertainty. Overlaid are the predictions together with their statistical uncertainties (Theory stat.). The BLACKHAT+SHERPA uncertainty also contains theoretical systematic uncertainties (Theory syst.) described in Section 9. The lower plots show the ratio of each prediction to the unfolded data. |
png pdf |
Figure 12-b:
The differential cross section measurement for $\Delta \phi (j_1,j_2)$ and $\Delta \phi (j_F,j_B)$ for inclusive jet multiplicity of 2, compared to the prediction of MadGraph , MadGraph5$\_$aMC@NLO, SHERPA-2, and BLACKHAT+SHERPA (corrected for hadronization and multiple-parton interactions). Black circular markers with the grey hatched band represent the unfolded data measurement and its uncertainty. Overlaid are the predictions together with their statistical uncertainties (Theory stat.). The BLACKHAT+SHERPA uncertainty also contains theoretical systematic uncertainties (Theory syst.) described in Section 9. The lower plots show the ratio of each prediction to the unfolded data. |
png pdf |
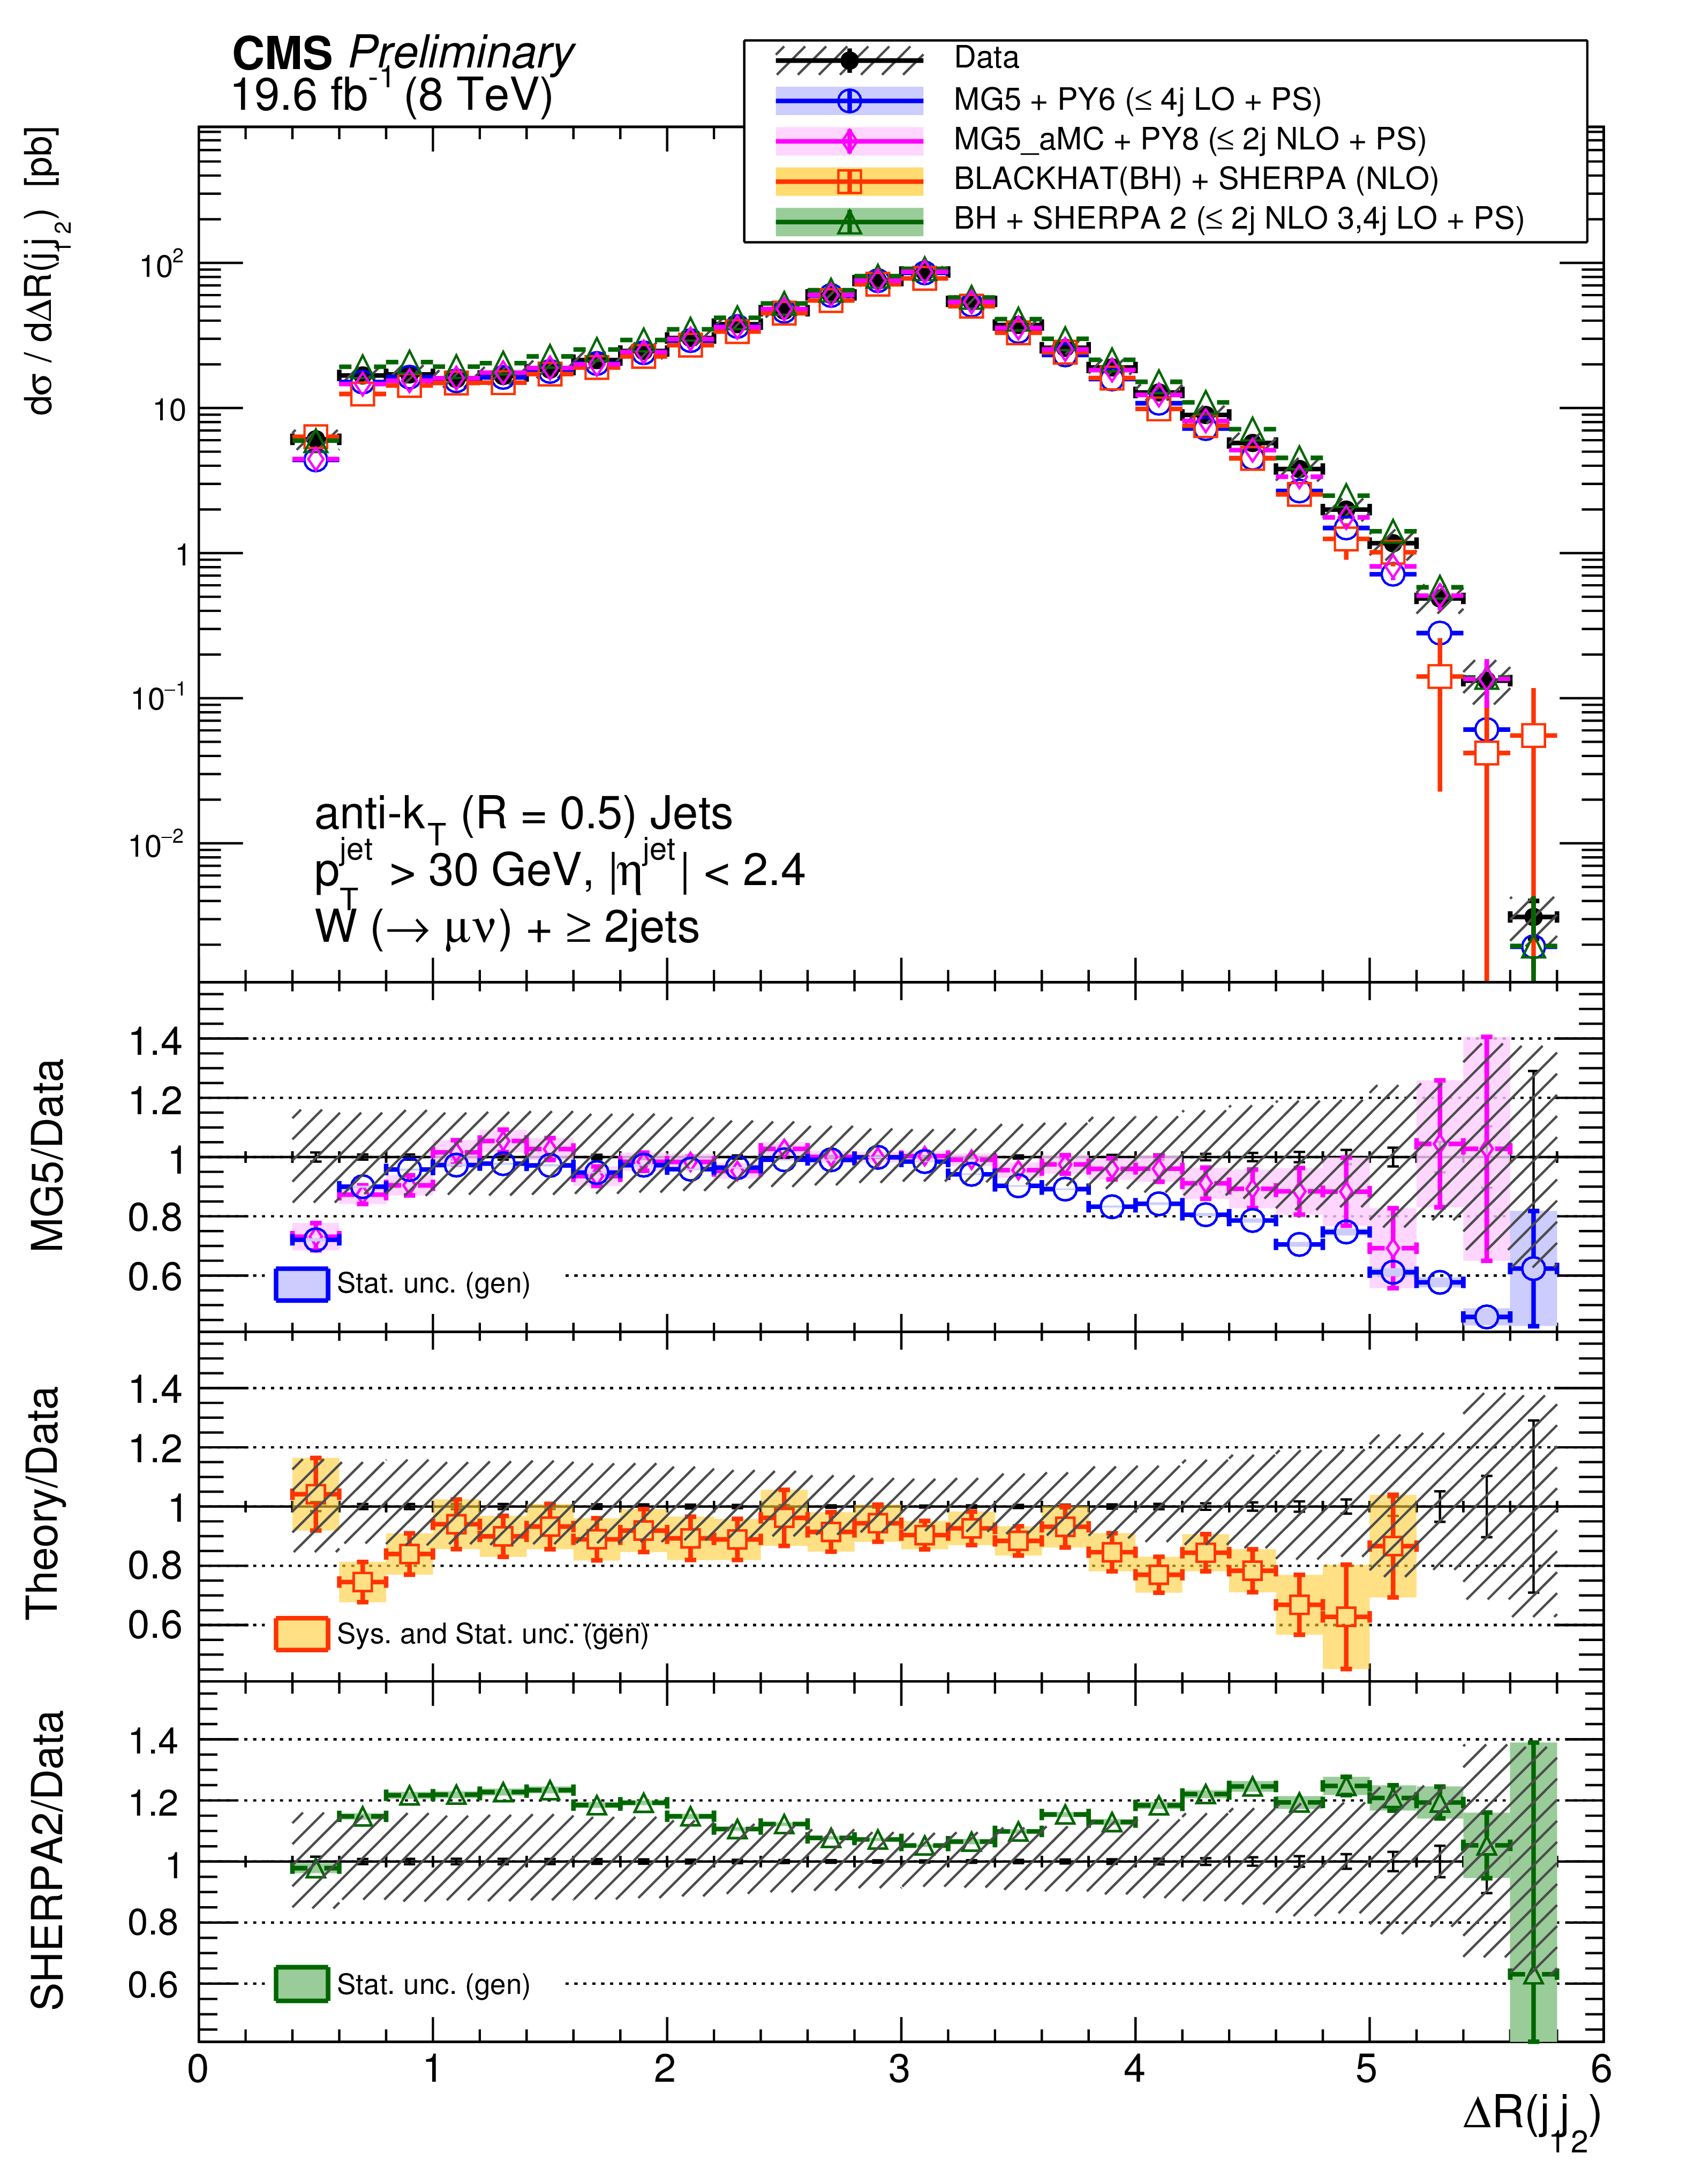
Figure 13:
The differential cross section measurement for $\Delta R(j_{1},j_{2})$ for an inclusive jet multiplicity of 2, compared to the prediction of MadGraph , MadGraph5$\_$aMC@NLO, SHERPA-2, and BLACKHAT+SHERPA (corrected for hadronization and multiple-parton interactions). Black circular markers with the grey hatched band represent the unfolded data measurement and its uncertainty. Overlaid are the predictions together with their statistical uncertainties (Theory stat.). The BLACKHAT+SHERPA uncertainty also contains theoretical systematic uncertainties (Theory syst.) described in Section 9. The lower plots show the ratio of each prediction to the unfolded data. |

png pdf |
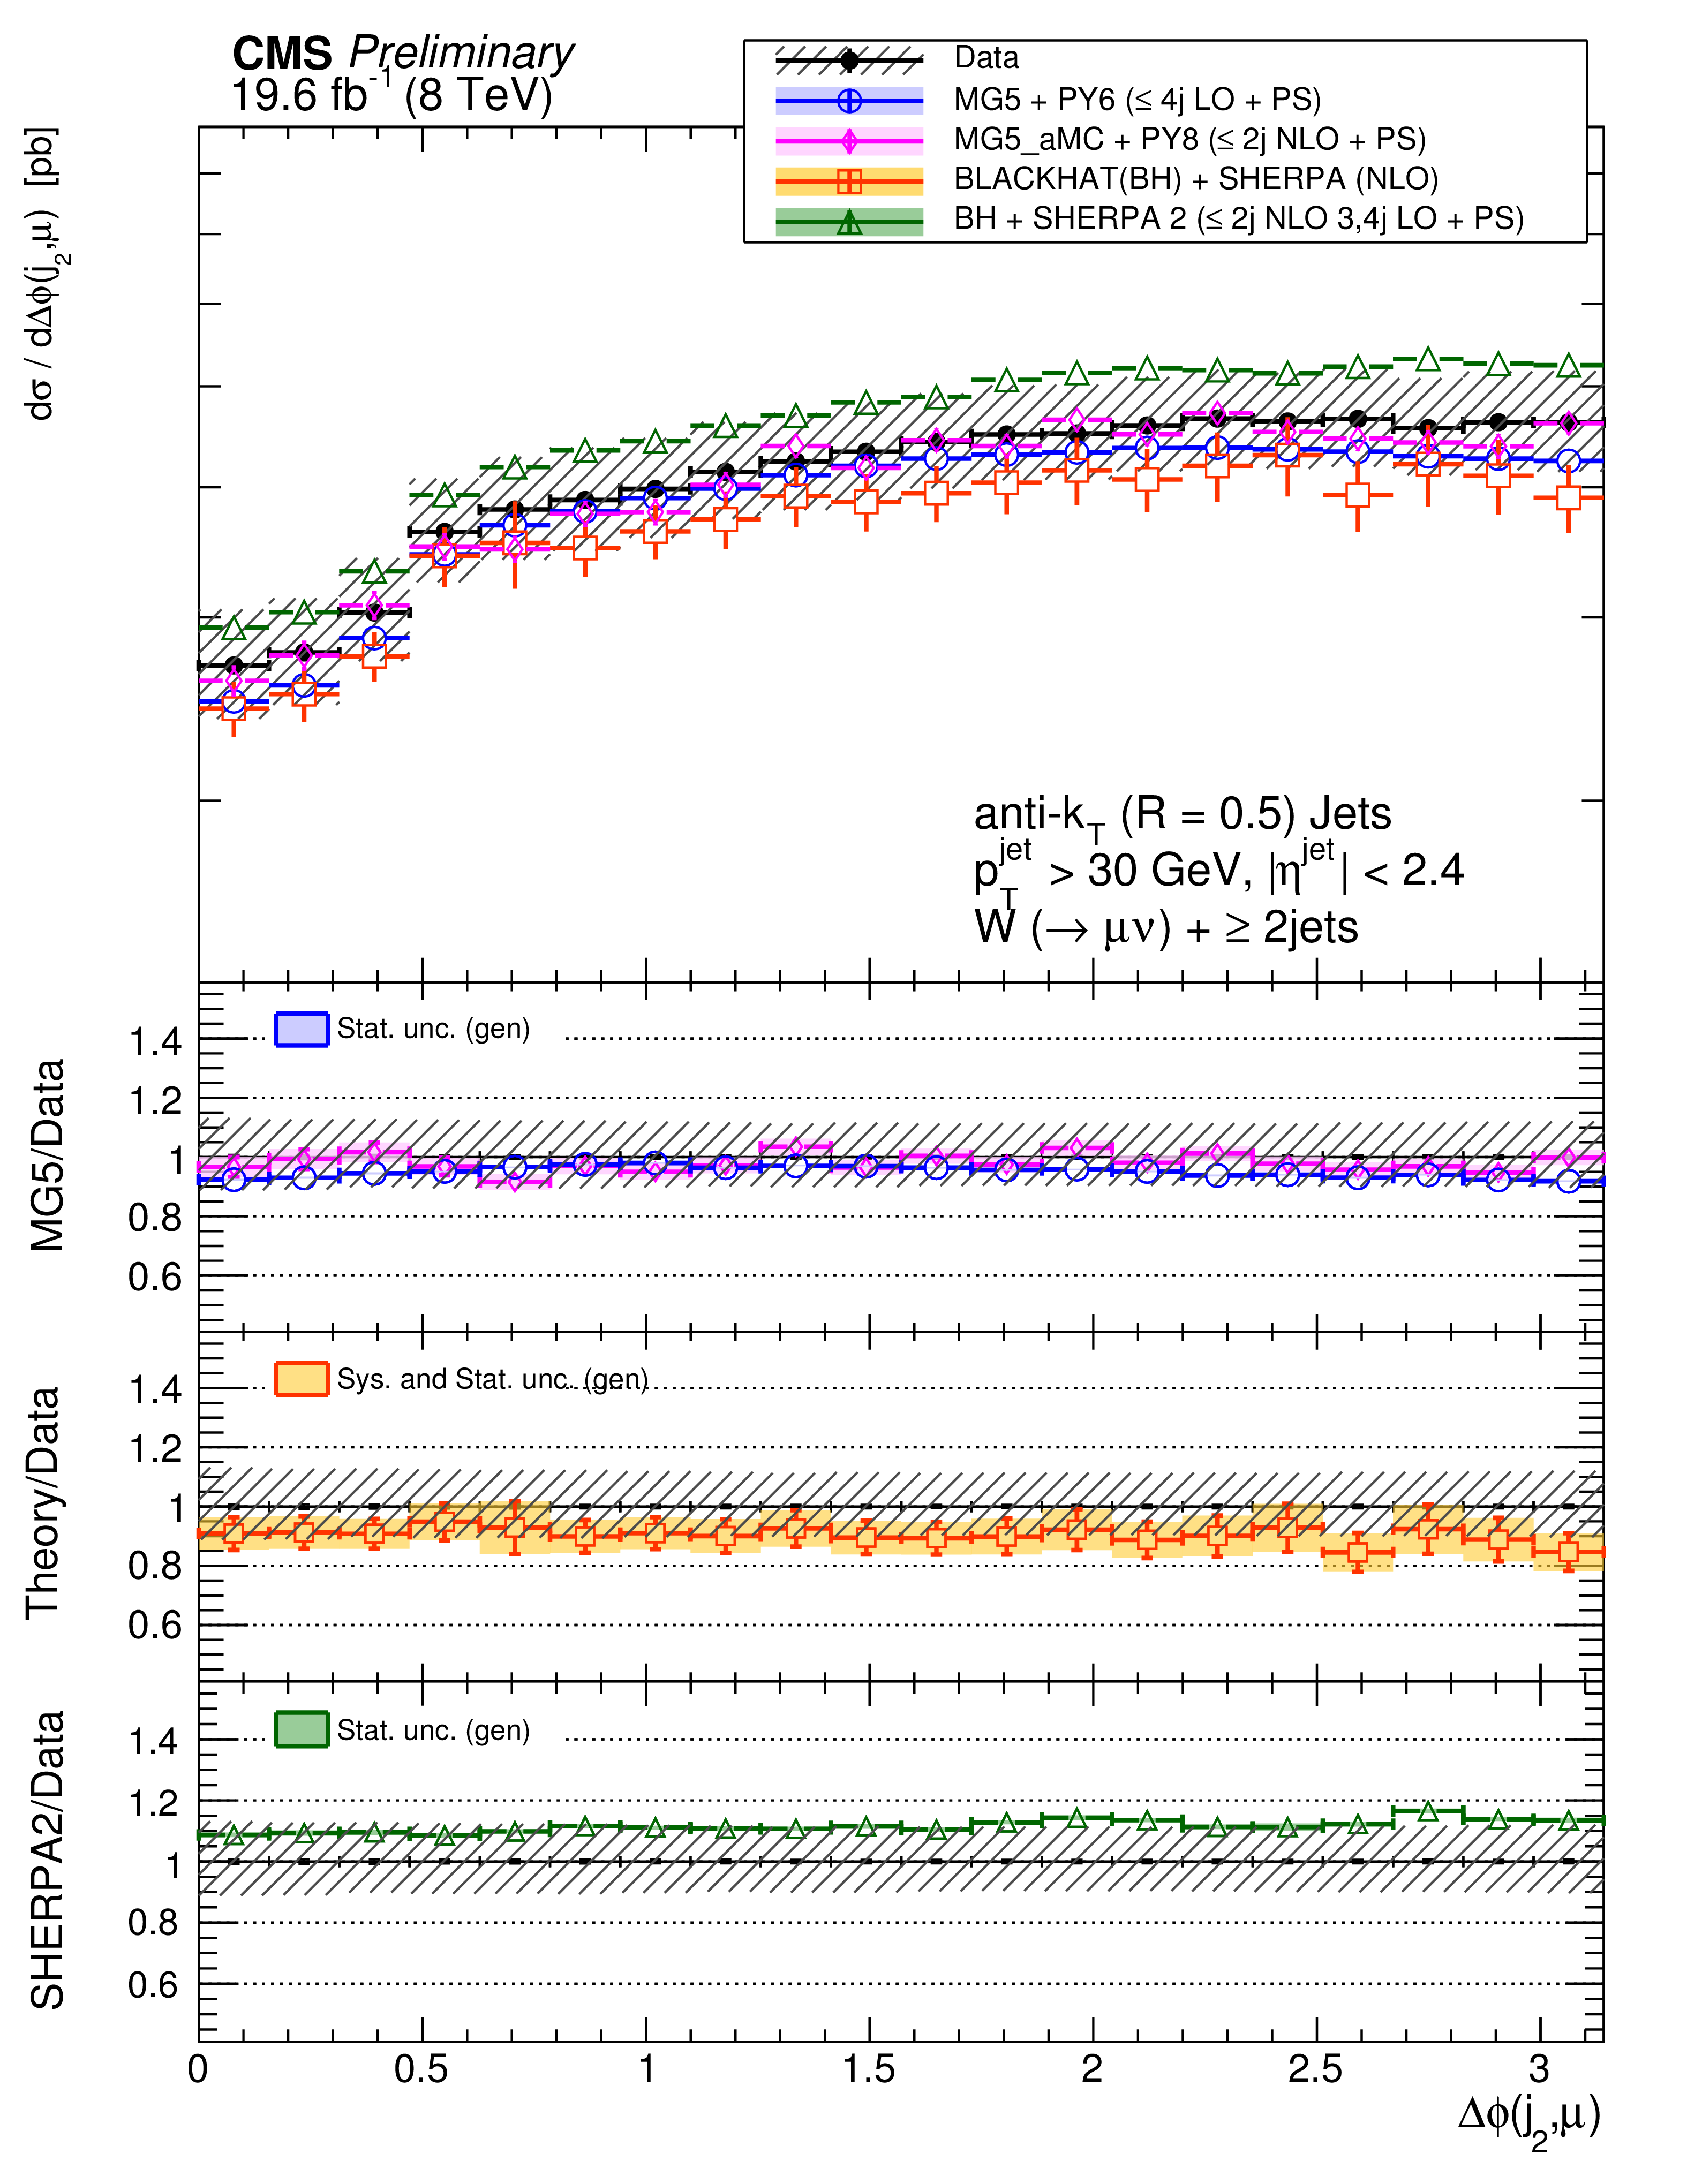
Figure 14-a:
The differential cross section measurement for $\Delta \phi (j_{n},\mu )$ for inclusive jet multiplicities of n = 1-4, compared to the prediction of MadGraph ,MadGraph5$\_$aMC@NLO, SHERPA-2, and BLACKHAT+SHERPA (corrected for hadronization and multiple-parton interactions). Black circular markers with the grey hatched band represent the unfolded data measurement and its uncertainty. Overlaid are the predictions together with their statistical uncertainties (Theory stat.). The BLACKHAT+SHERPA uncertainty also contains theoretical systematic uncertainties (Theory syst.) described in Section 9. The lower plots show the ratio of each prediction to the unfolded data. |
png pdf |
Figure 14-b:
The differential cross section measurement for $\Delta \phi (j_{n},\mu )$ for inclusive jet multiplicities of n = 1-4, compared to the prediction of MadGraph ,MadGraph5$\_$aMC@NLO, SHERPA-2, and BLACKHAT+SHERPA (corrected for hadronization and multiple-parton interactions). Black circular markers with the grey hatched band represent the unfolded data measurement and its uncertainty. Overlaid are the predictions together with their statistical uncertainties (Theory stat.). The BLACKHAT+SHERPA uncertainty also contains theoretical systematic uncertainties (Theory syst.) described in Section 9. The lower plots show the ratio of each prediction to the unfolded data. |

png pdf |
Figure 14-c:
The differential cross section measurement for $\Delta \phi (j_{n},\mu )$ for inclusive jet multiplicities of n = 1-4, compared to the prediction of MadGraph ,MadGraph5$\_$aMC@NLO, SHERPA-2, and BLACKHAT+SHERPA (corrected for hadronization and multiple-parton interactions). Black circular markers with the grey hatched band represent the unfolded data measurement and its uncertainty. Overlaid are the predictions together with their statistical uncertainties (Theory stat.). The BLACKHAT+SHERPA uncertainty also contains theoretical systematic uncertainties (Theory syst.) described in Section 9. The lower plots show the ratio of each prediction to the unfolded data. |

png pdf |
Figure 14-d:
The differential cross section measurement for $\Delta \phi (j_{n},\mu )$ for inclusive jet multiplicities of n = 1-4, compared to the prediction of MadGraph ,MadGraph5$\_$aMC@NLO, SHERPA-2, and BLACKHAT+SHERPA (corrected for hadronization and multiple-parton interactions). Black circular markers with the grey hatched band represent the unfolded data measurement and its uncertainty. Overlaid are the predictions together with their statistical uncertainties (Theory stat.). The BLACKHAT+SHERPA uncertainty also contains theoretical systematic uncertainties (Theory syst.) described in Section 9. The lower plots show the ratio of each prediction to the unfolded data. |
png pdf |
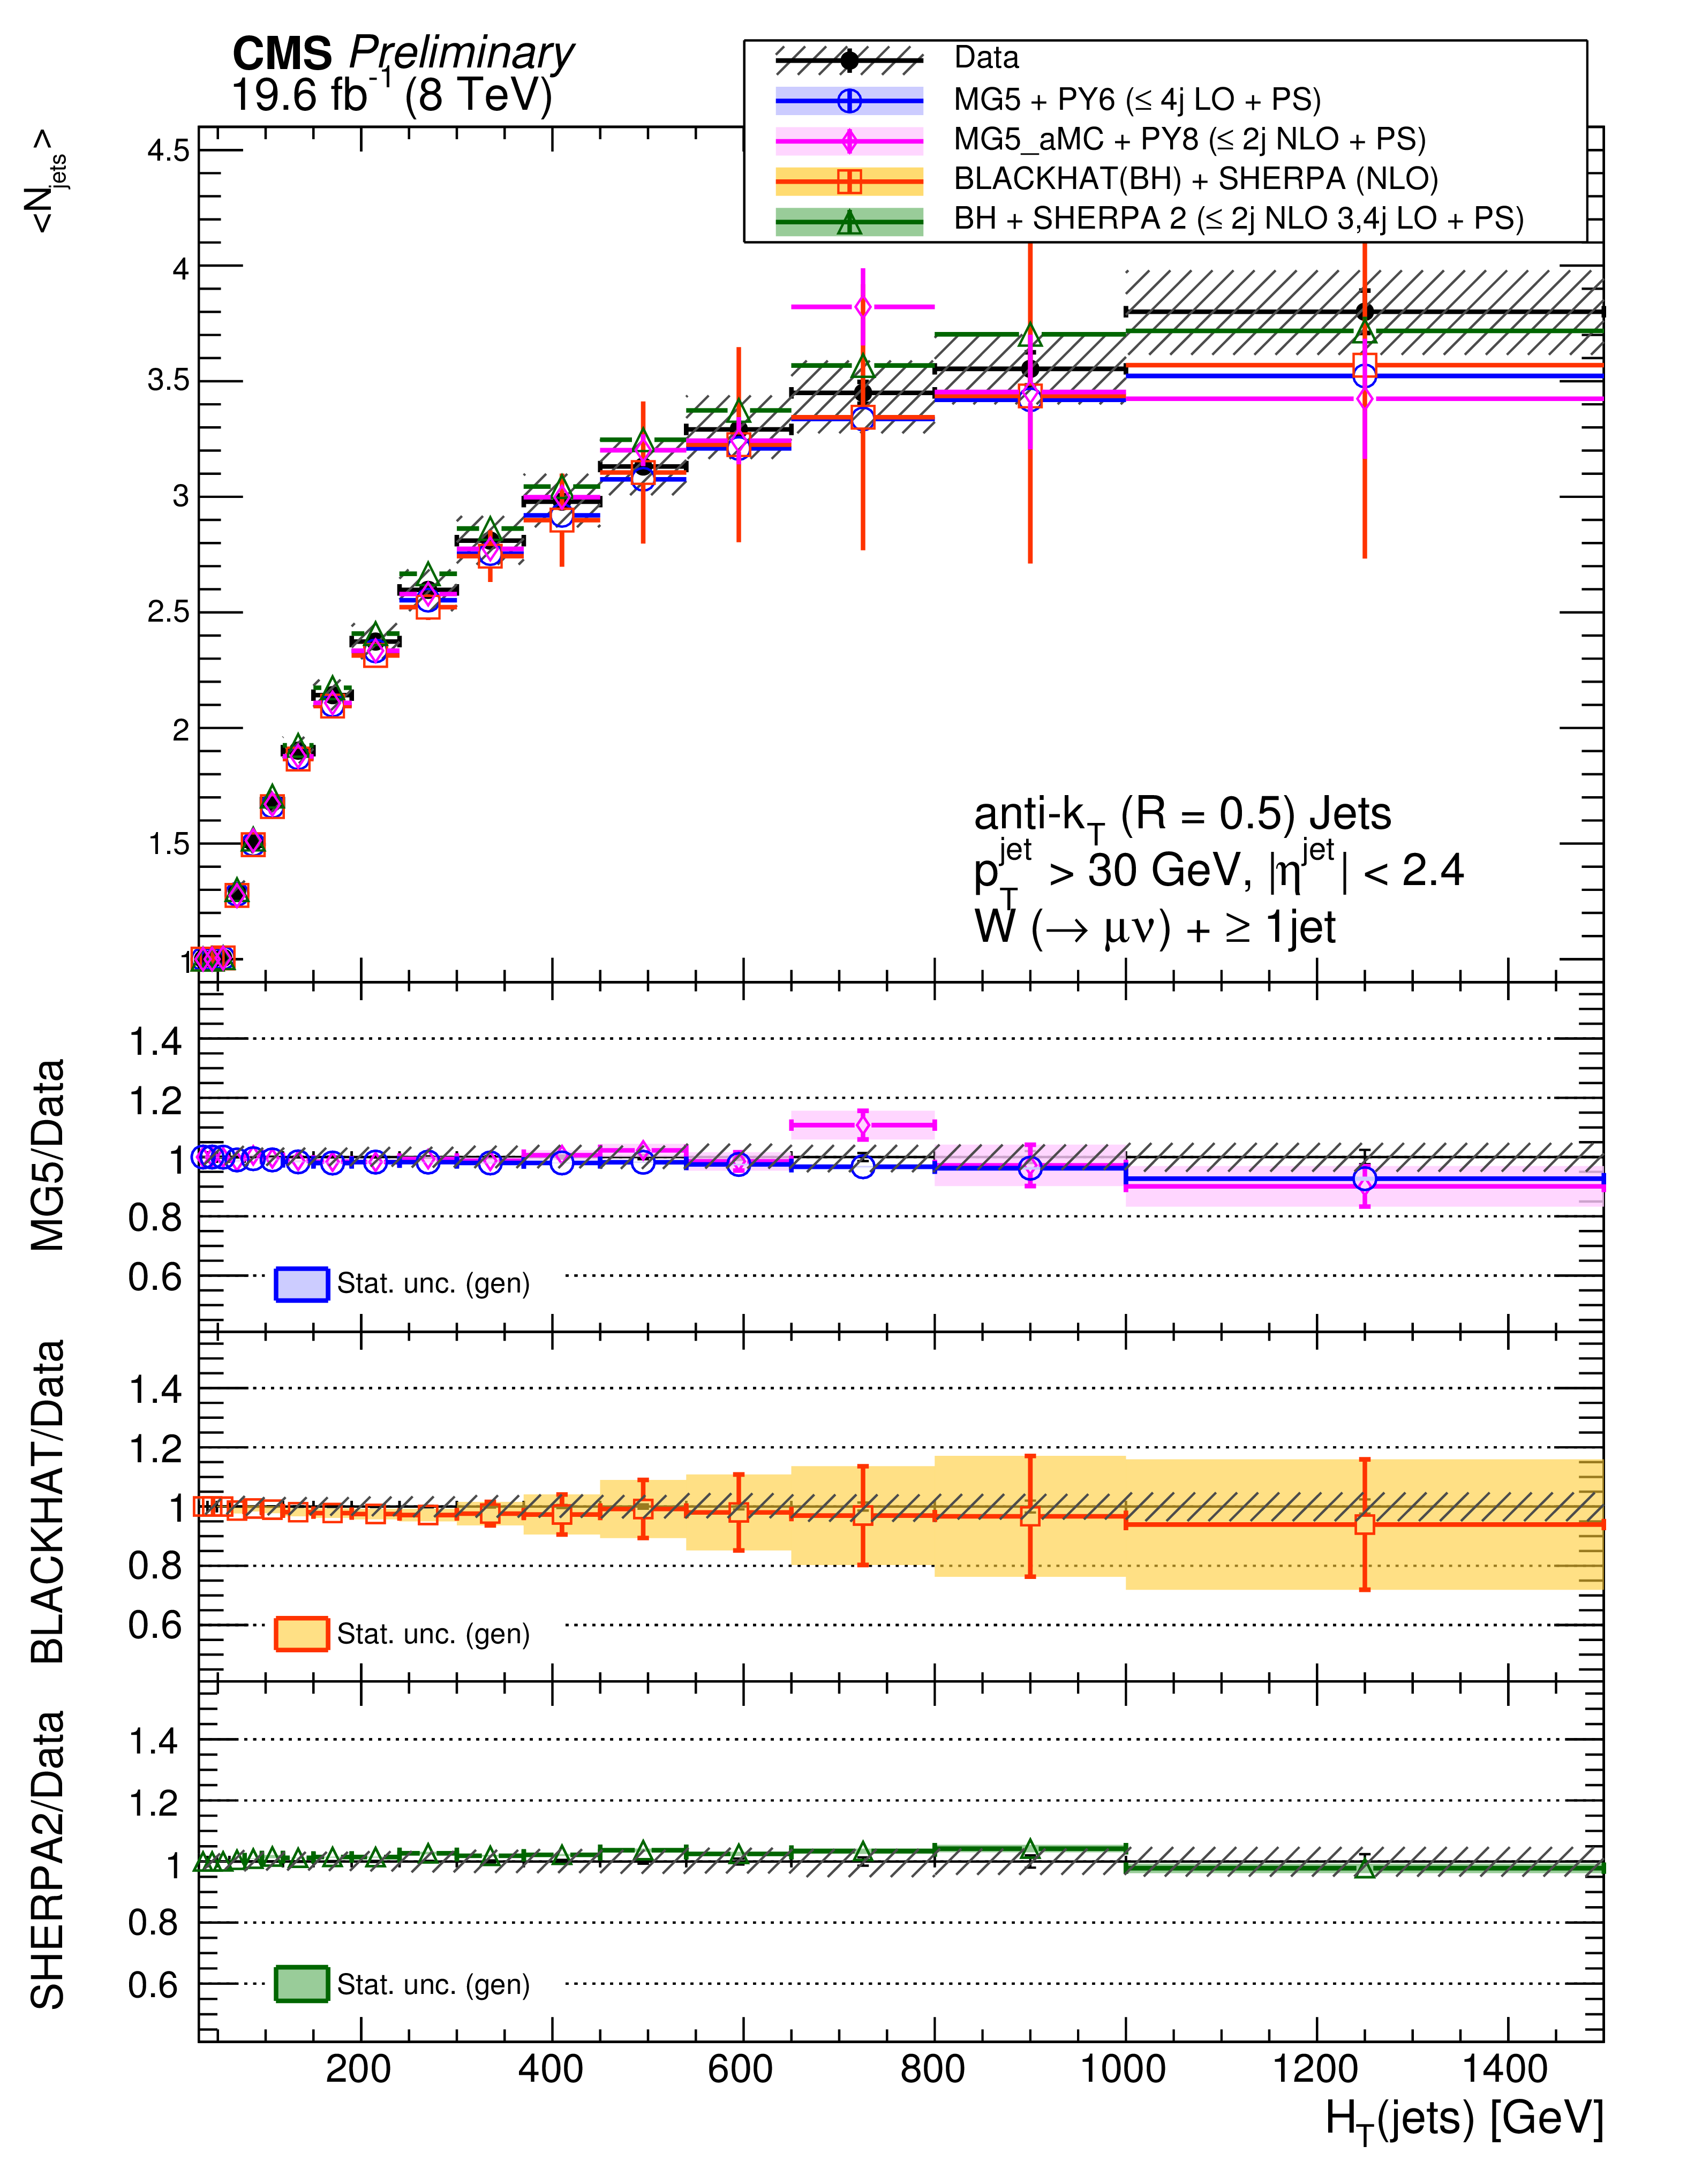
Figure 15-a:
The measurement of the mean number of jets as a function of $ {H_{\mathrm {T}}} $ for inclusive jet multiplicities 1-2, and as a function of $\Delta y(j_1,j_2)$, and of $\Delta y(j_F,j_B)$ for an inclusive jet multiplicity of 2, compared to the prediction of MadGraph , SHERPA-2, and BLACKHAT+SHERPA (corrected for hadronization and multiple-parton interactions). Black circular markers with the grey hatched band represent the unfolded data measurement and its uncertainty. Overlaid are the predictions together with their statistical uncertainties (Theory stat.). The BLACKHAT+SHERPA uncertainty also contains theoretical systematic uncertainties (Theory syst.) described in Section 9. The lower plots show the ratio of each prediction to the unfolded data. |

png pdf |
Figure 15-b:
The measurement of the mean number of jets as a function of $ {H_{\mathrm {T}}} $ for inclusive jet multiplicities 1-2, and as a function of $\Delta y(j_1,j_2)$, and of $\Delta y(j_F,j_B)$ for an inclusive jet multiplicity of 2, compared to the prediction of MadGraph , SHERPA-2, and BLACKHAT+SHERPA (corrected for hadronization and multiple-parton interactions). Black circular markers with the grey hatched band represent the unfolded data measurement and its uncertainty. Overlaid are the predictions together with their statistical uncertainties (Theory stat.). The BLACKHAT+SHERPA uncertainty also contains theoretical systematic uncertainties (Theory syst.) described in Section 9. The lower plots show the ratio of each prediction to the unfolded data. |

png pdf |
Figure 15-c:
The measurement of the mean number of jets as a function of $ {H_{\mathrm {T}}} $ for inclusive jet multiplicities 1-2, and as a function of $\Delta y(j_1,j_2)$, and of $\Delta y(j_F,j_B)$ for an inclusive jet multiplicity of 2, compared to the prediction of MadGraph , SHERPA-2, and BLACKHAT+SHERPA (corrected for hadronization and multiple-parton interactions). Black circular markers with the grey hatched band represent the unfolded data measurement and its uncertainty. Overlaid are the predictions together with their statistical uncertainties (Theory stat.). The BLACKHAT+SHERPA uncertainty also contains theoretical systematic uncertainties (Theory syst.) described in Section 9. The lower plots show the ratio of each prediction to the unfolded data. |

png pdf |
Figure 15-d:
The measurement of the mean number of jets as a function of $ {H_{\mathrm {T}}} $ for inclusive jet multiplicities 1-2, and as a function of $\Delta y(j_1,j_2)$, and of $\Delta y(j_F,j_B)$ for an inclusive jet multiplicity of 2, compared to the prediction of MadGraph , SHERPA-2, and BLACKHAT+SHERPA (corrected for hadronization and multiple-parton interactions). Black circular markers with the grey hatched band represent the unfolded data measurement and its uncertainty. Overlaid are the predictions together with their statistical uncertainties (Theory stat.). The BLACKHAT+SHERPA uncertainty also contains theoretical systematic uncertainties (Theory syst.) described in Section 9. The lower plots show the ratio of each prediction to the unfolded data. |
| Tables | |
png pdf |
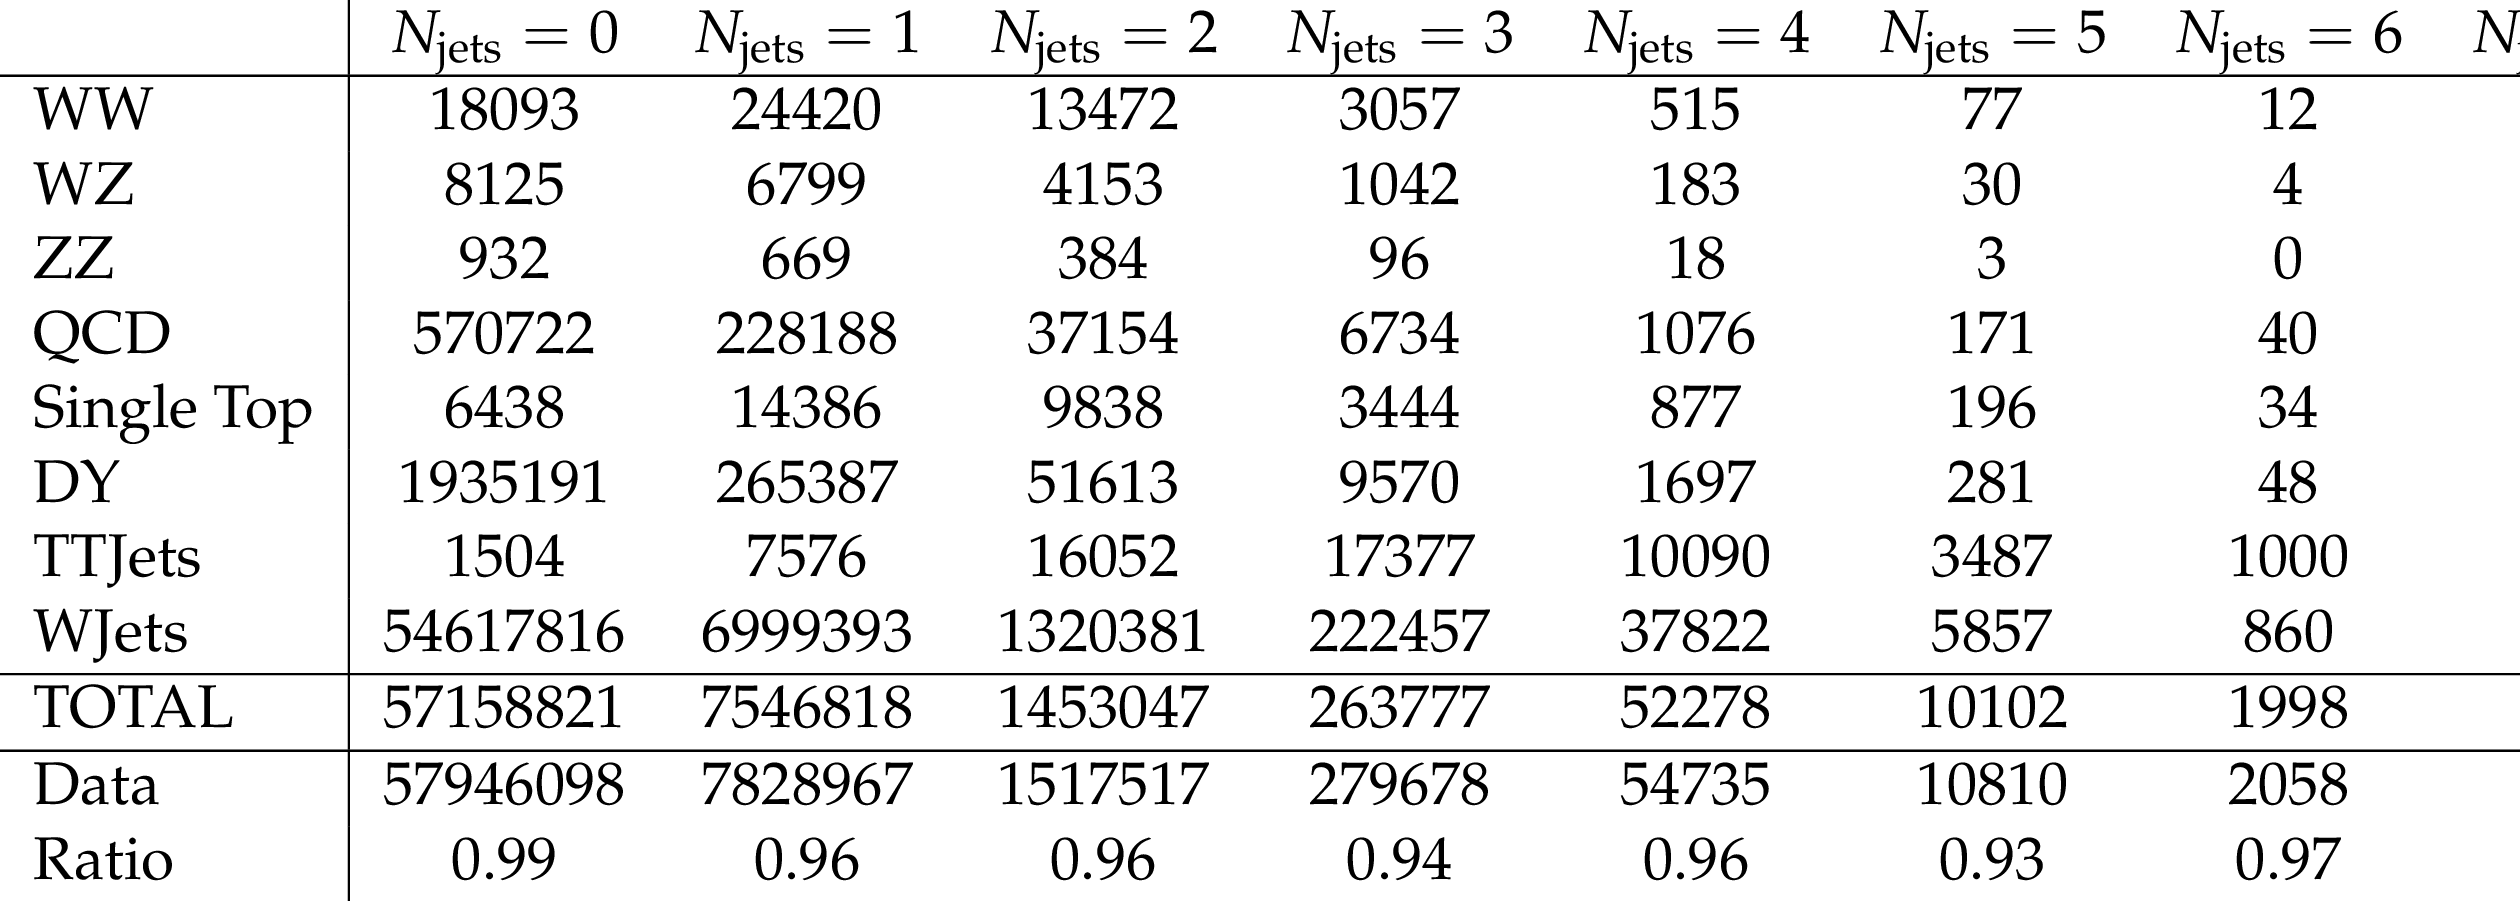
Table 1:
Number of events in data and simulation as a function of exclusive jet multiplicity. |
| Summary |
|
Measurements of the cross sections and differential cross sections for a $\mathrm{ W }$ boson produced in association with jets in pp collisions at a centre-of-mass energy of 8 TeV were presented. The data correspond to an integrated luminosity of 19.6 fb$^{-1}$ and were collected with the CMS detector during the 2012 proton-proton run of the LHC. Cross sections determined using the muon decay mode of the W boson were presented as functions of the jet multiplicity, the $p_{\mathrm{T}}$ and pseudorapidities of the four leading jets, the $H_{\mathrm{T}}$ for jet multiplicities up to four, and the dijet $p_{\mathrm{T}}$ and invariant mass. Cross sections were also presented as a function of several angular correlation variables: rapidity separation, azimuthal angle separation and $\Delta R$ separation among $p_{\mathrm{T}}$-ordered and rapidity-ordered jets, and azimuthal angle separation between the muon and the leading jet. The distribution of the mean number of jets as a function of $H_{\mathrm{T}}$ and rapidity differences among jets were examined. The results were corrected for all detector effects by means of regularised unfolding and compared with particle-level simulated predictions at LO (MADGRAPH+PYTHIA), NLO (SHERPA-2, MadGraph5$\_$aMC@NLO, and BLACKHAT+ sherpa) and NNLO. The predictions generally describe the jet multiplicity within the uncertainties, with increasing deviations observed in SHERPA-2 for jet multiplicities beyond four, where four corresponds to the number of partons included at CMS in the matrix element calculation for those generators. The cross sections as a function of the $p_{\mathrm{T}}$ of the leading, second-, and third-leading jets are overestimated by MADGRAPH+PYTHIA in a region of intermediate $p_{\mathrm{T}}$, and by SHERPA-2 at low-$p_{\mathrm{T}}$. The cross sections as a function of $p_{\mathrm{T}}$ predicted by BLACKHAT+ sherpa agree with the measurements within uncertainties. The predictions from MadGraph5$\_$aMC@NLO are very similar to the predictions of MADGRAPH+PYTHIA for most distributions. The predictions from BLACKHAT+ sherpa underestimate the measurement of the cross section as a function of $H_{\mathrm{T}}$ for $N_\text{jet} \geq 1$, since the contribution from $\mathrm{ W }$+$\geq$3 jets is missing from an NLO prediction of $\mathrm{ W }$+$\geq$1 jet. The cross sections as a function of $H_{\mathrm{T}}$ predicted by SHERPA-2 overestimate the measurement of the cross section, particularly at high $H_{\mathrm{T}}$. The jet $| \eta |$ distribution shows some deviations for large values of $| \eta |$ and the angular correlation distributions in rapidity difference show deviations for large opening angles. The distribution of the azimuthal angle between the muon and the leading jet is not well modelled by BLACKHAT+ sherpa for jet multiplicity of 1. The correlation distributions in azimuthal angle among jets agree with data, as do the mean number of jets distributions, both as a function of angular correlation variables and of $H_{\mathrm{T}}$. The NNLO predictions of $\mathrm{ W }$+1 jet were compared with the results of the leading jet $p_{\mathrm{T}}$, $H_{\mathrm{T}}$, and $| \eta |$. They agree within uncertainties. |
|
|
Compact Muon Solenoid LHC, CERN |
|

|

|

|

|

|