

Compact Muon Solenoid
LHC, CERN
| CMS-PAS-SMP-15-010 | ||
| Measurement of the differential cross section of Z boson production in association with jets in proton-proton collisions at $\sqrt{s} =$ 13 TeV | ||
| CMS Collaboration | ||
| December 2015 | ||
| Abstract: Differential cross section measurements of the $ \mathrm{Z}(\rightarrow \mu\mu)$ boson production in association with jets are presented, using 13 TeV proton-proton collisions data recorded by the CMS detector at the LHC, corresponding to an integrated luminosity of 2.5 fb$^{-1}$. The cross sections are presented as a function of jet multiplicity, the jet transverse momenta, and the jet rapidity for different jet multiplicities. The cross section measurements are then compared with the predictions from a multileg next-to-leading-order Monte Carlo generator. | ||
| Links: CDS record (PDF) ; inSPIRE record ; CADI line (restricted) ; | ||
| Figures | |
png pdf |
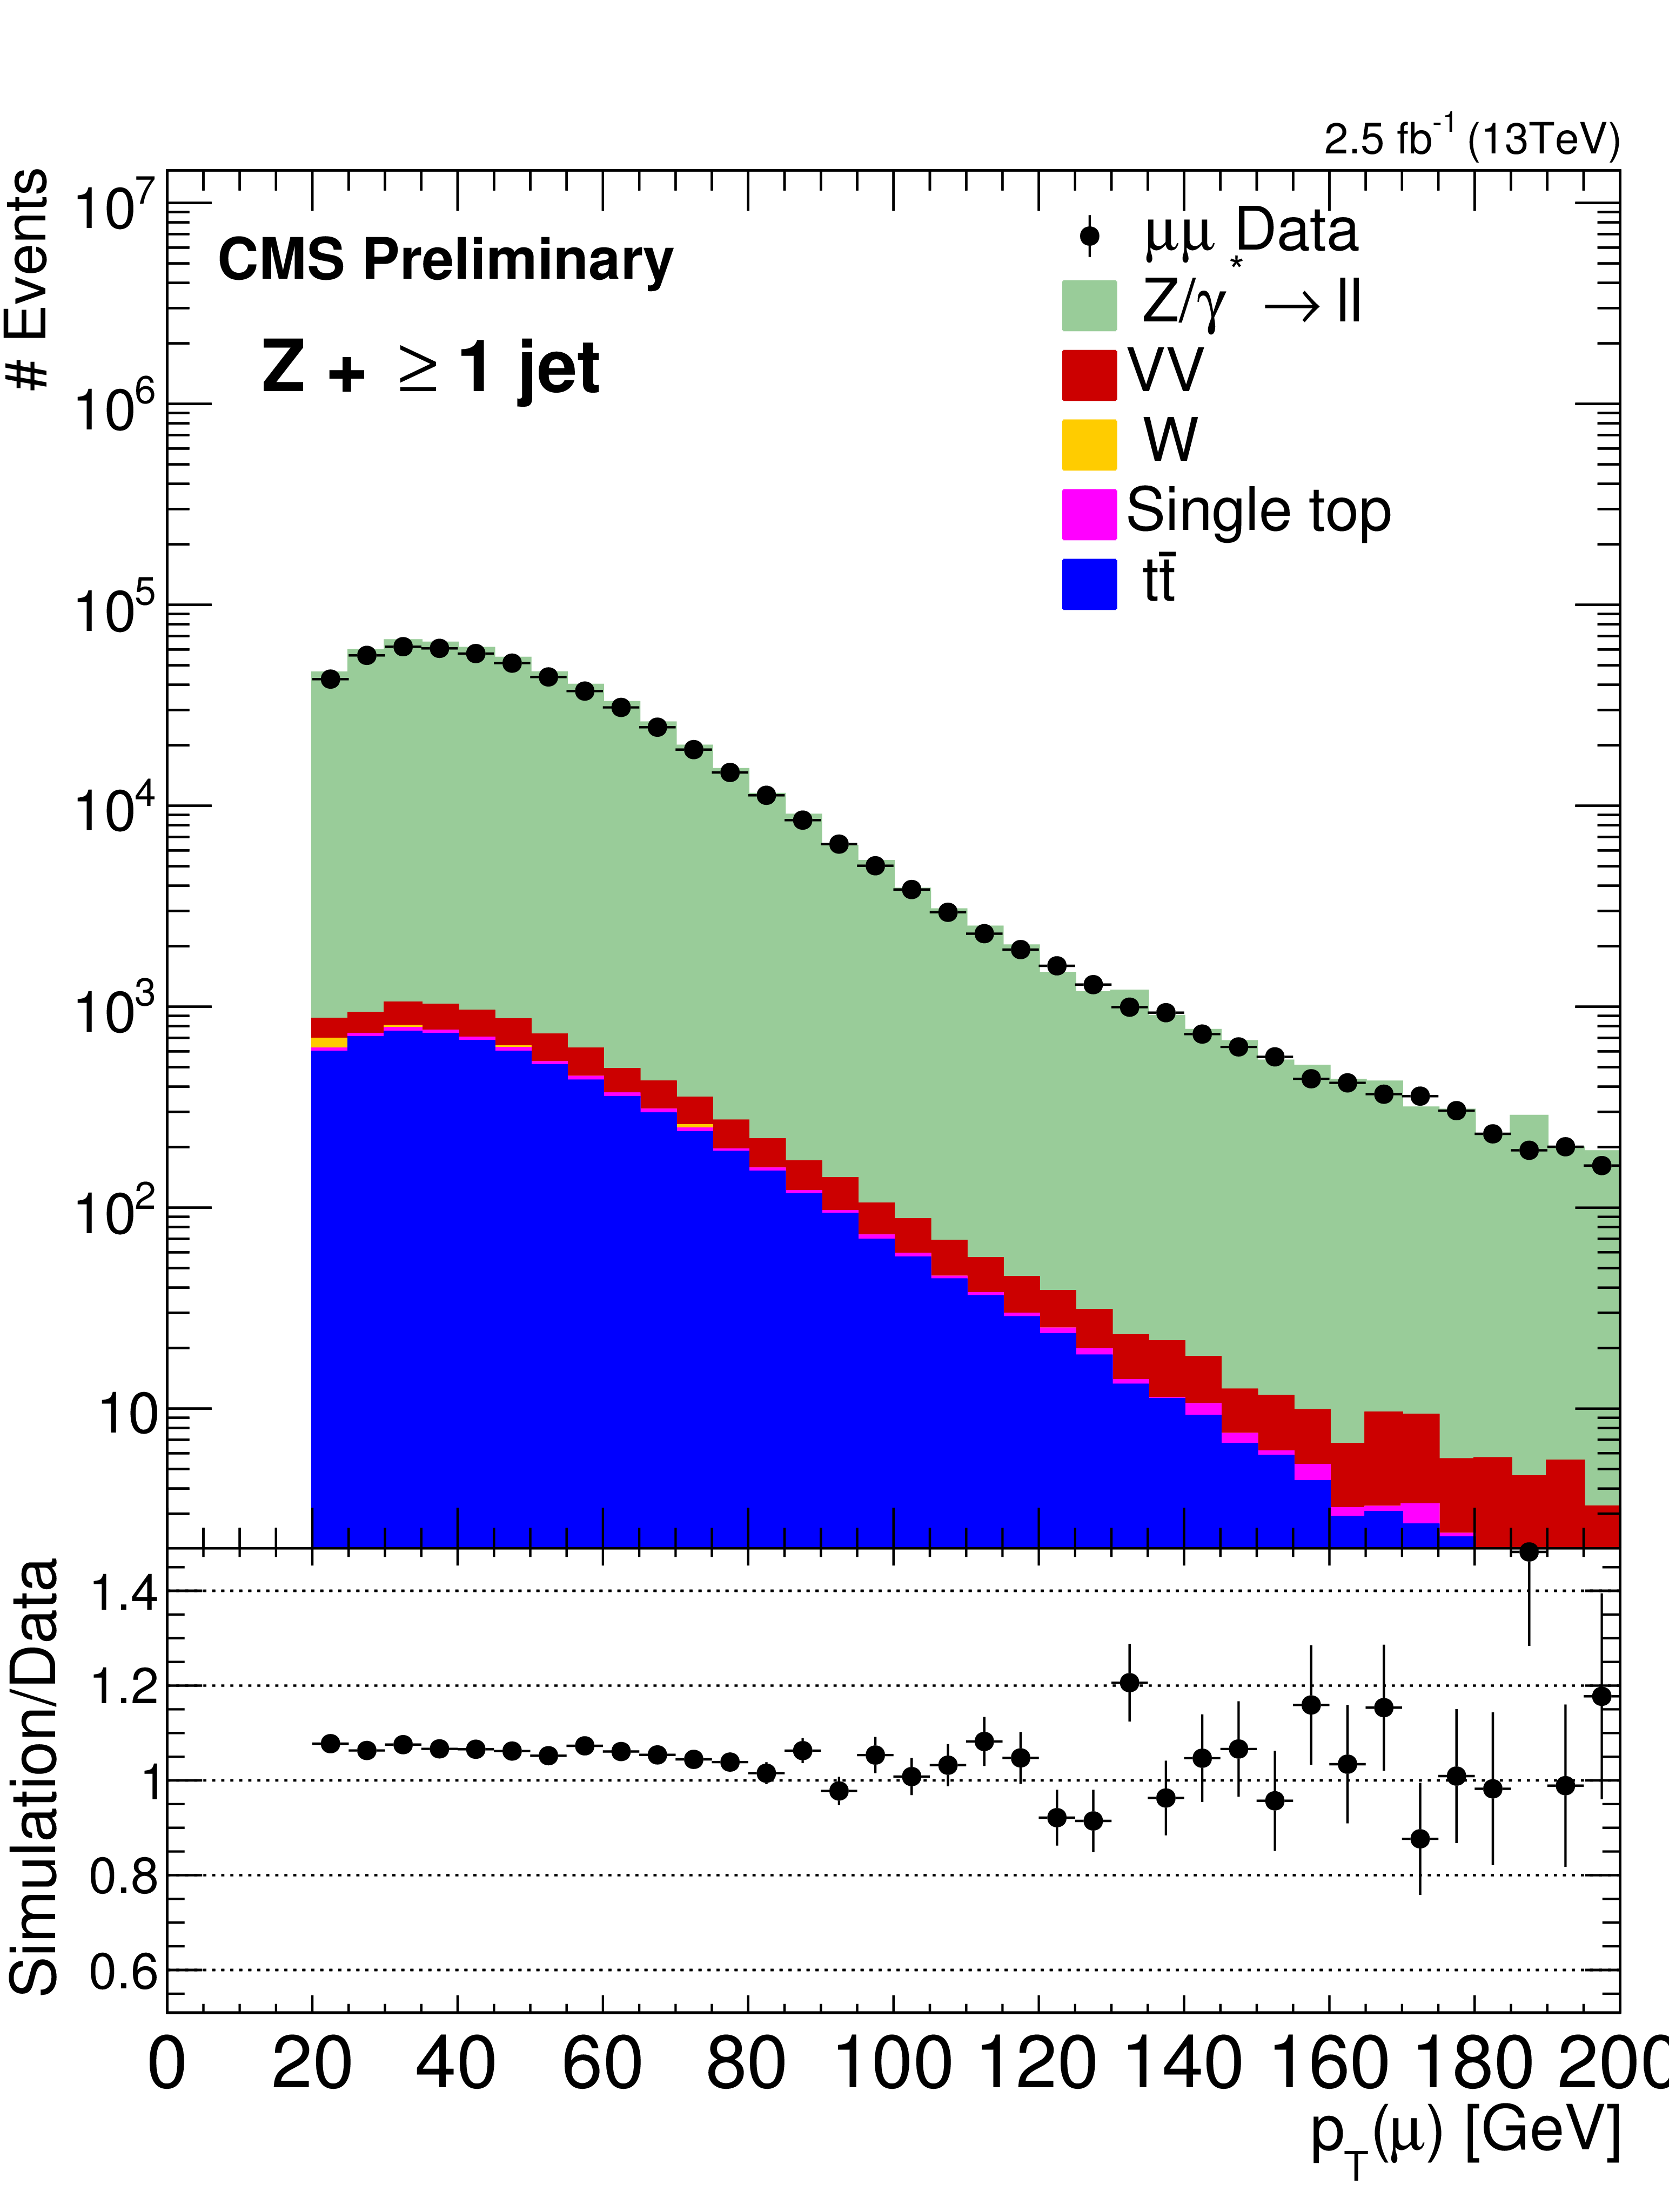
Figure 1-a:
Reconstructed data and simulated signal and backgrounds distributions of muon transverse momenta, $ {p_{\mathrm {T}}} (\mu )$, and pseudo-rapidity, $\eta (\mu )$ for $\mathrm{ Z } \ + \ge 1 \text { jet}$ events passing the measurement selection. The error bars on the data points correspond to the statistical errors (in the case of the ratio plots, they correspond to the statistical errors coming from both the data and the simulation). |
png pdf |
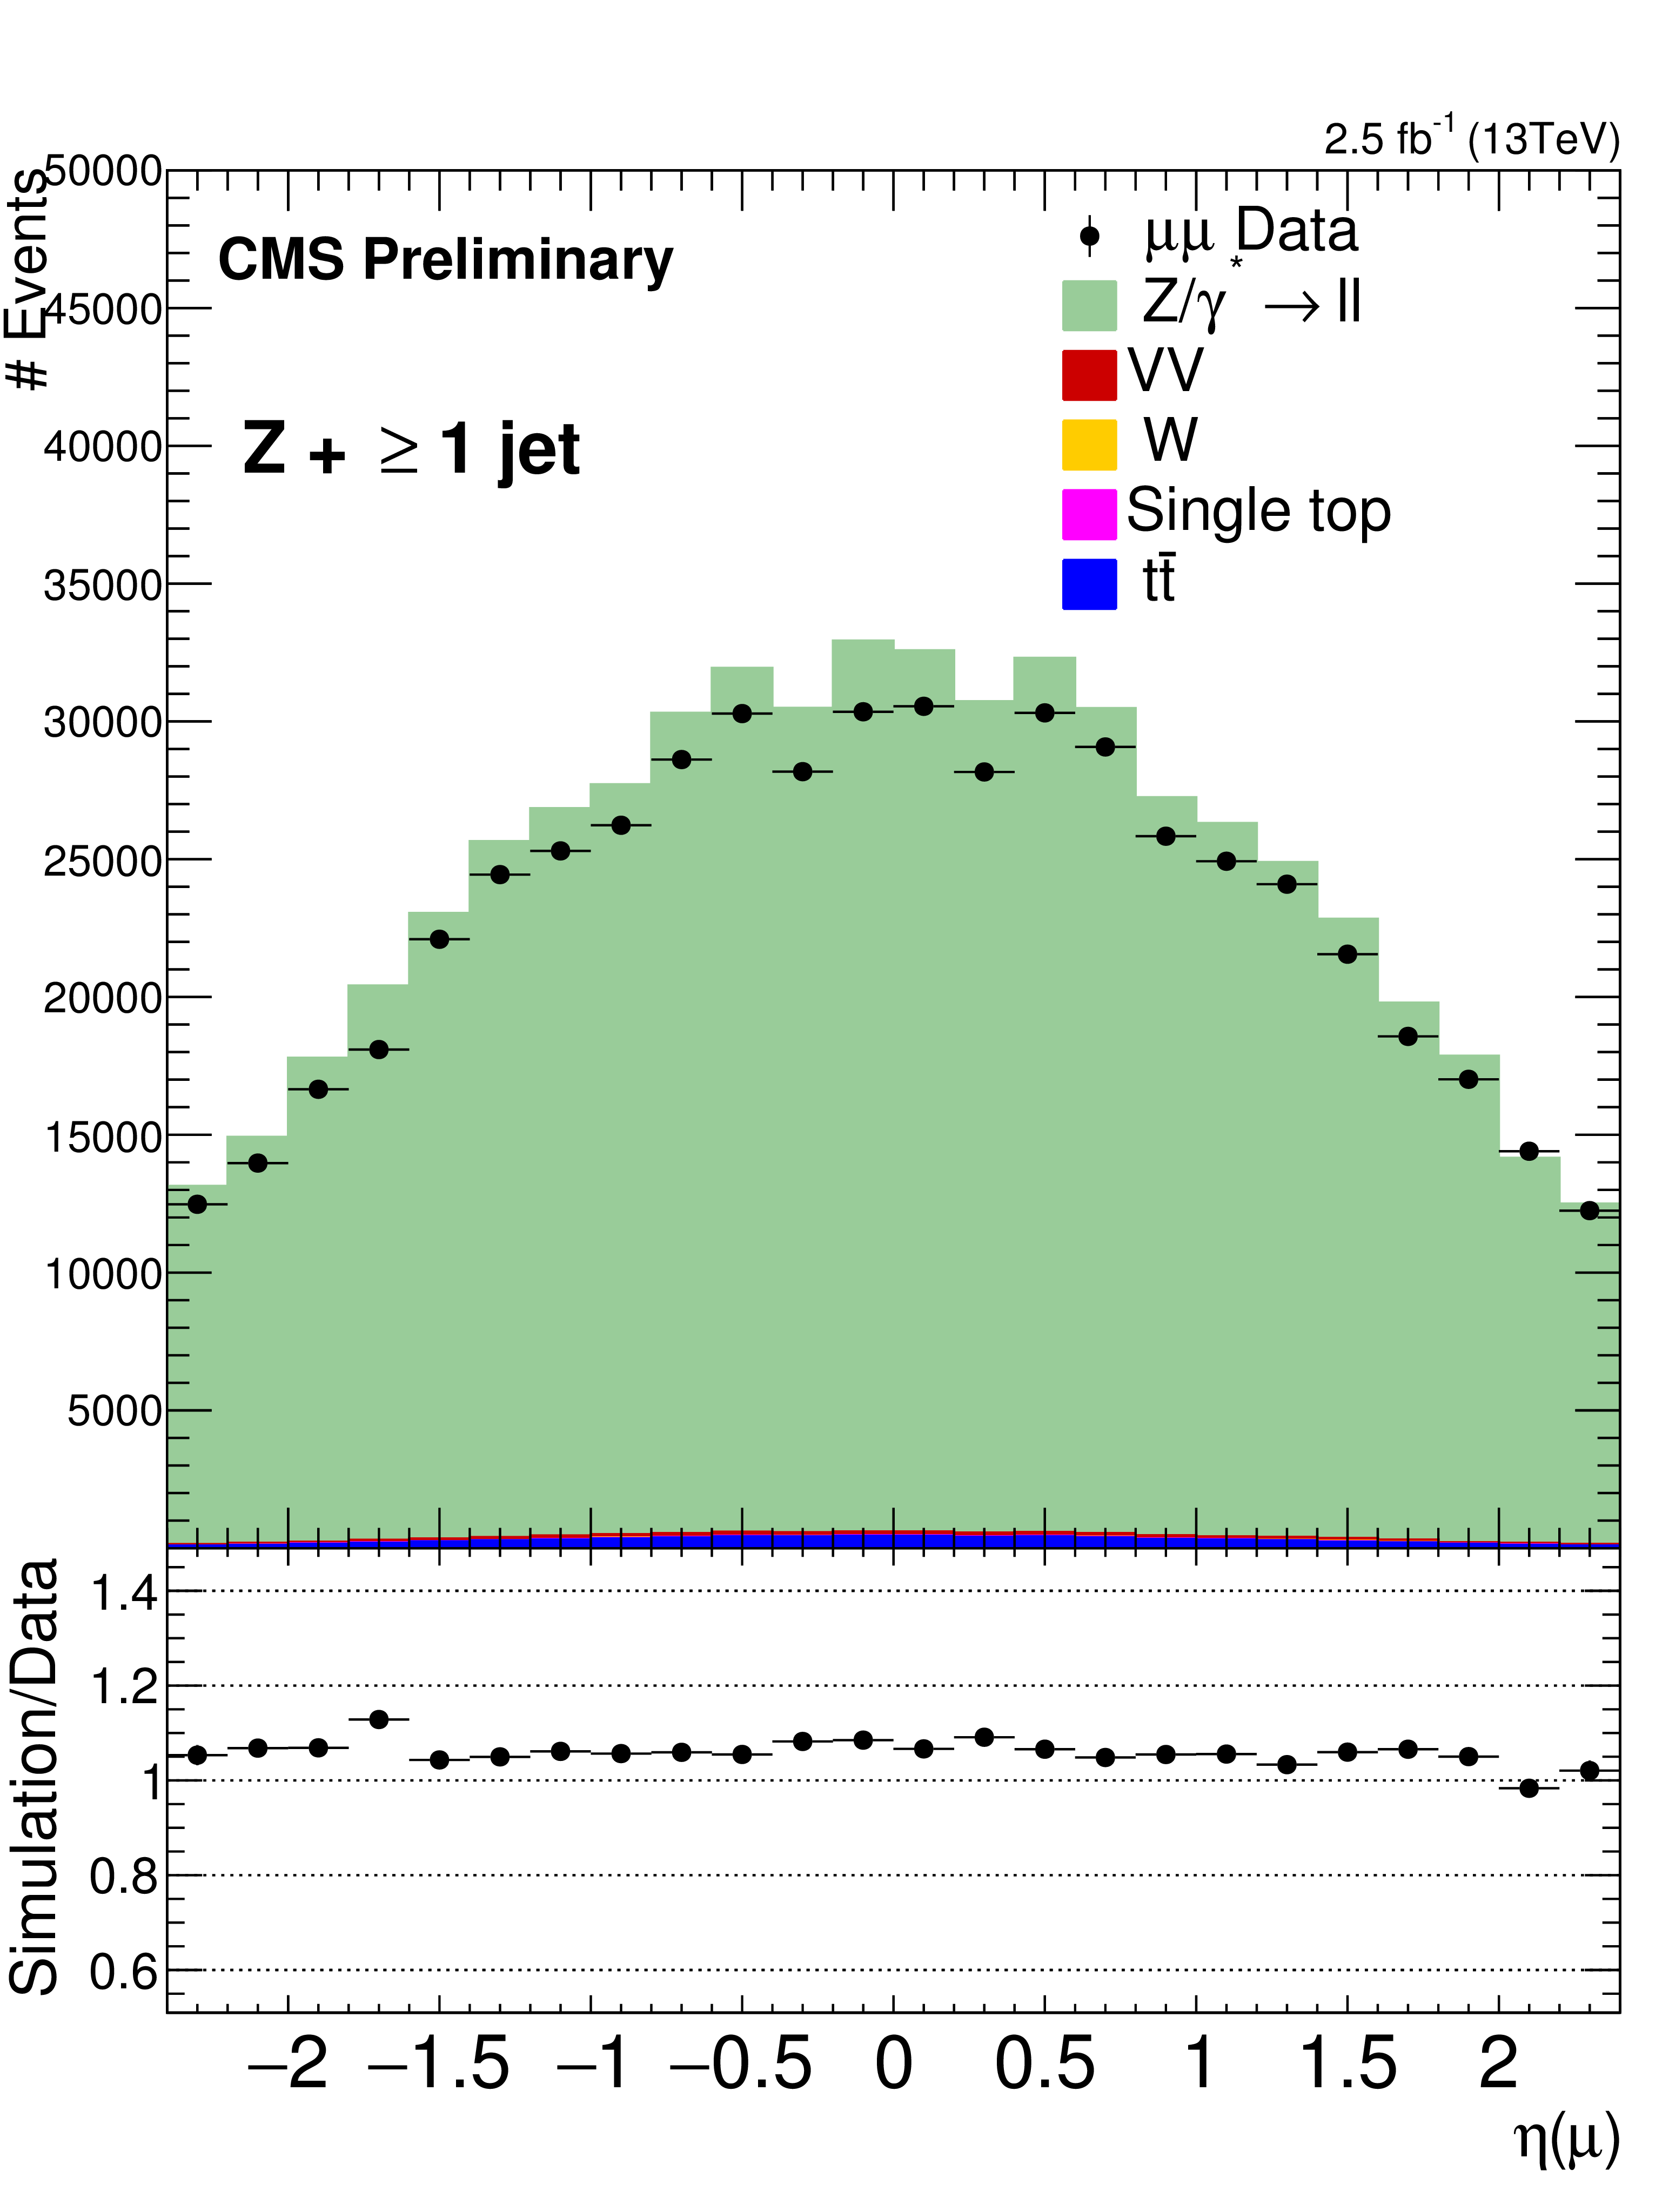
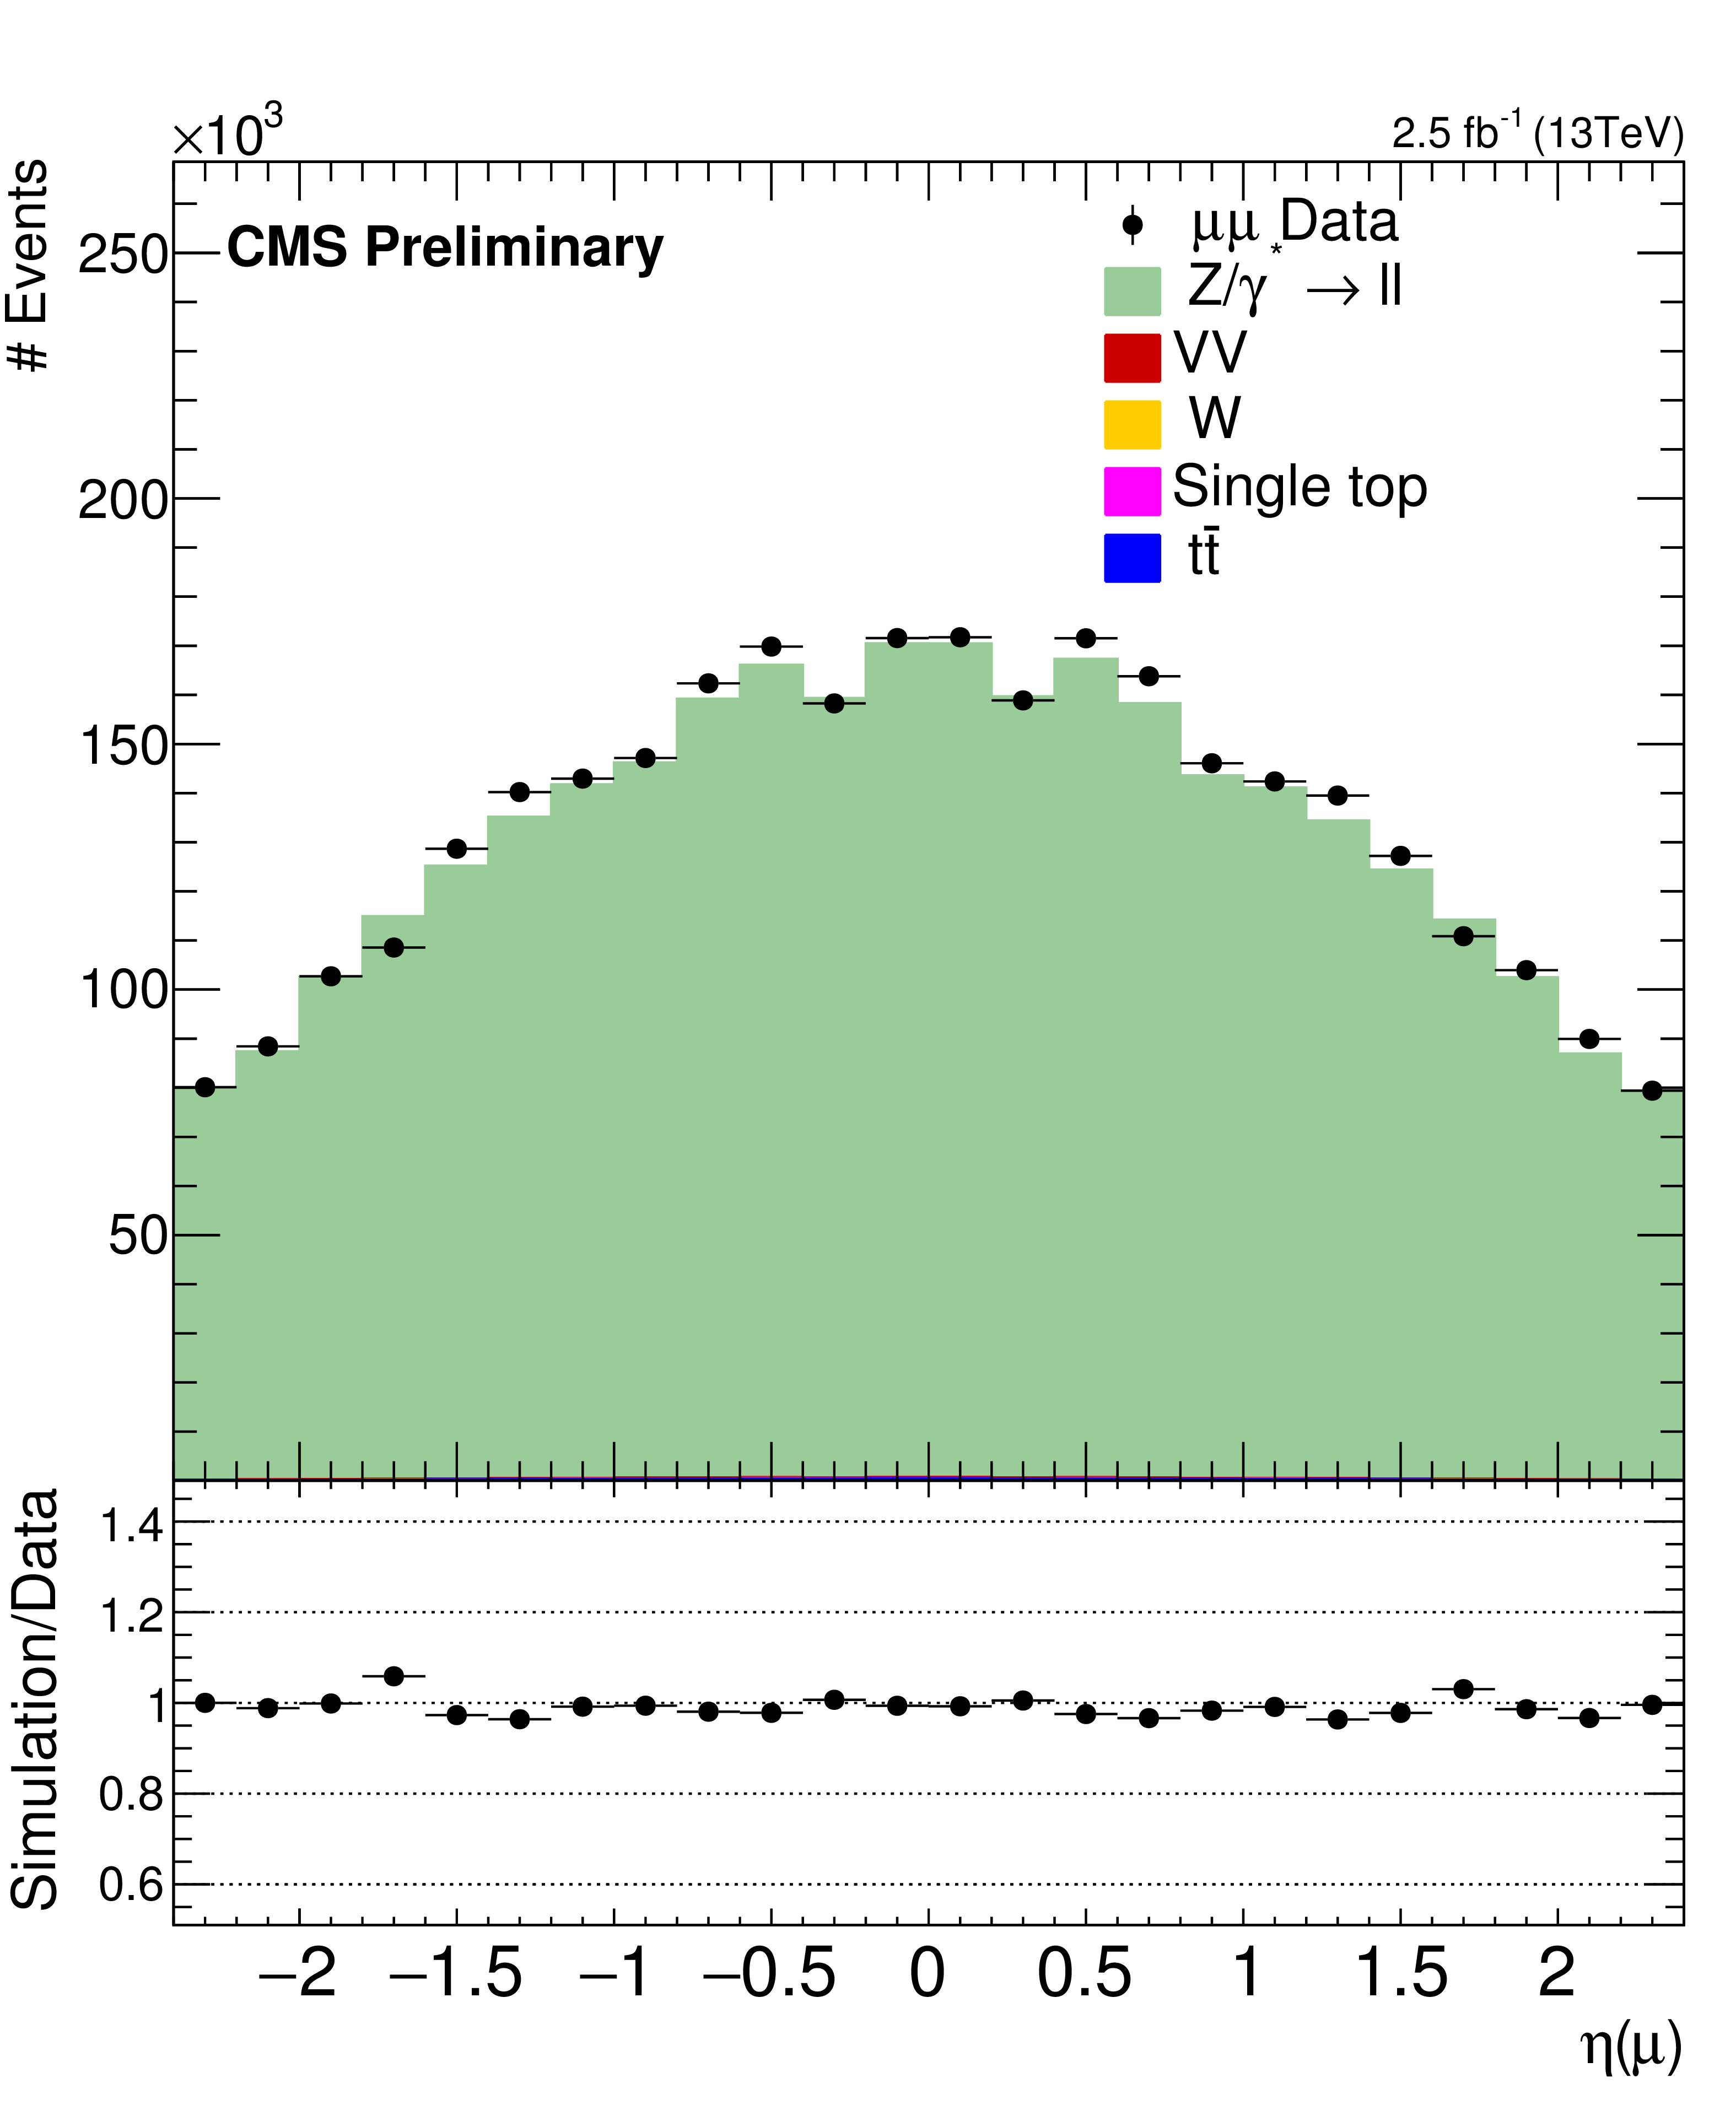
Figure 1-b:
Reconstructed data and simulated signal and backgrounds distributions of muon transverse momenta, $ {p_{\mathrm {T}}} (\mu )$, and pseudo-rapidity, $\eta (\mu )$ for $\mathrm{ Z } \ + \ge 1 \text { jet}$ events passing the measurement selection. The error bars on the data points correspond to the statistical errors (in the case of the ratio plots, they correspond to the statistical errors coming from both the data and the simulation). |
png pdf |
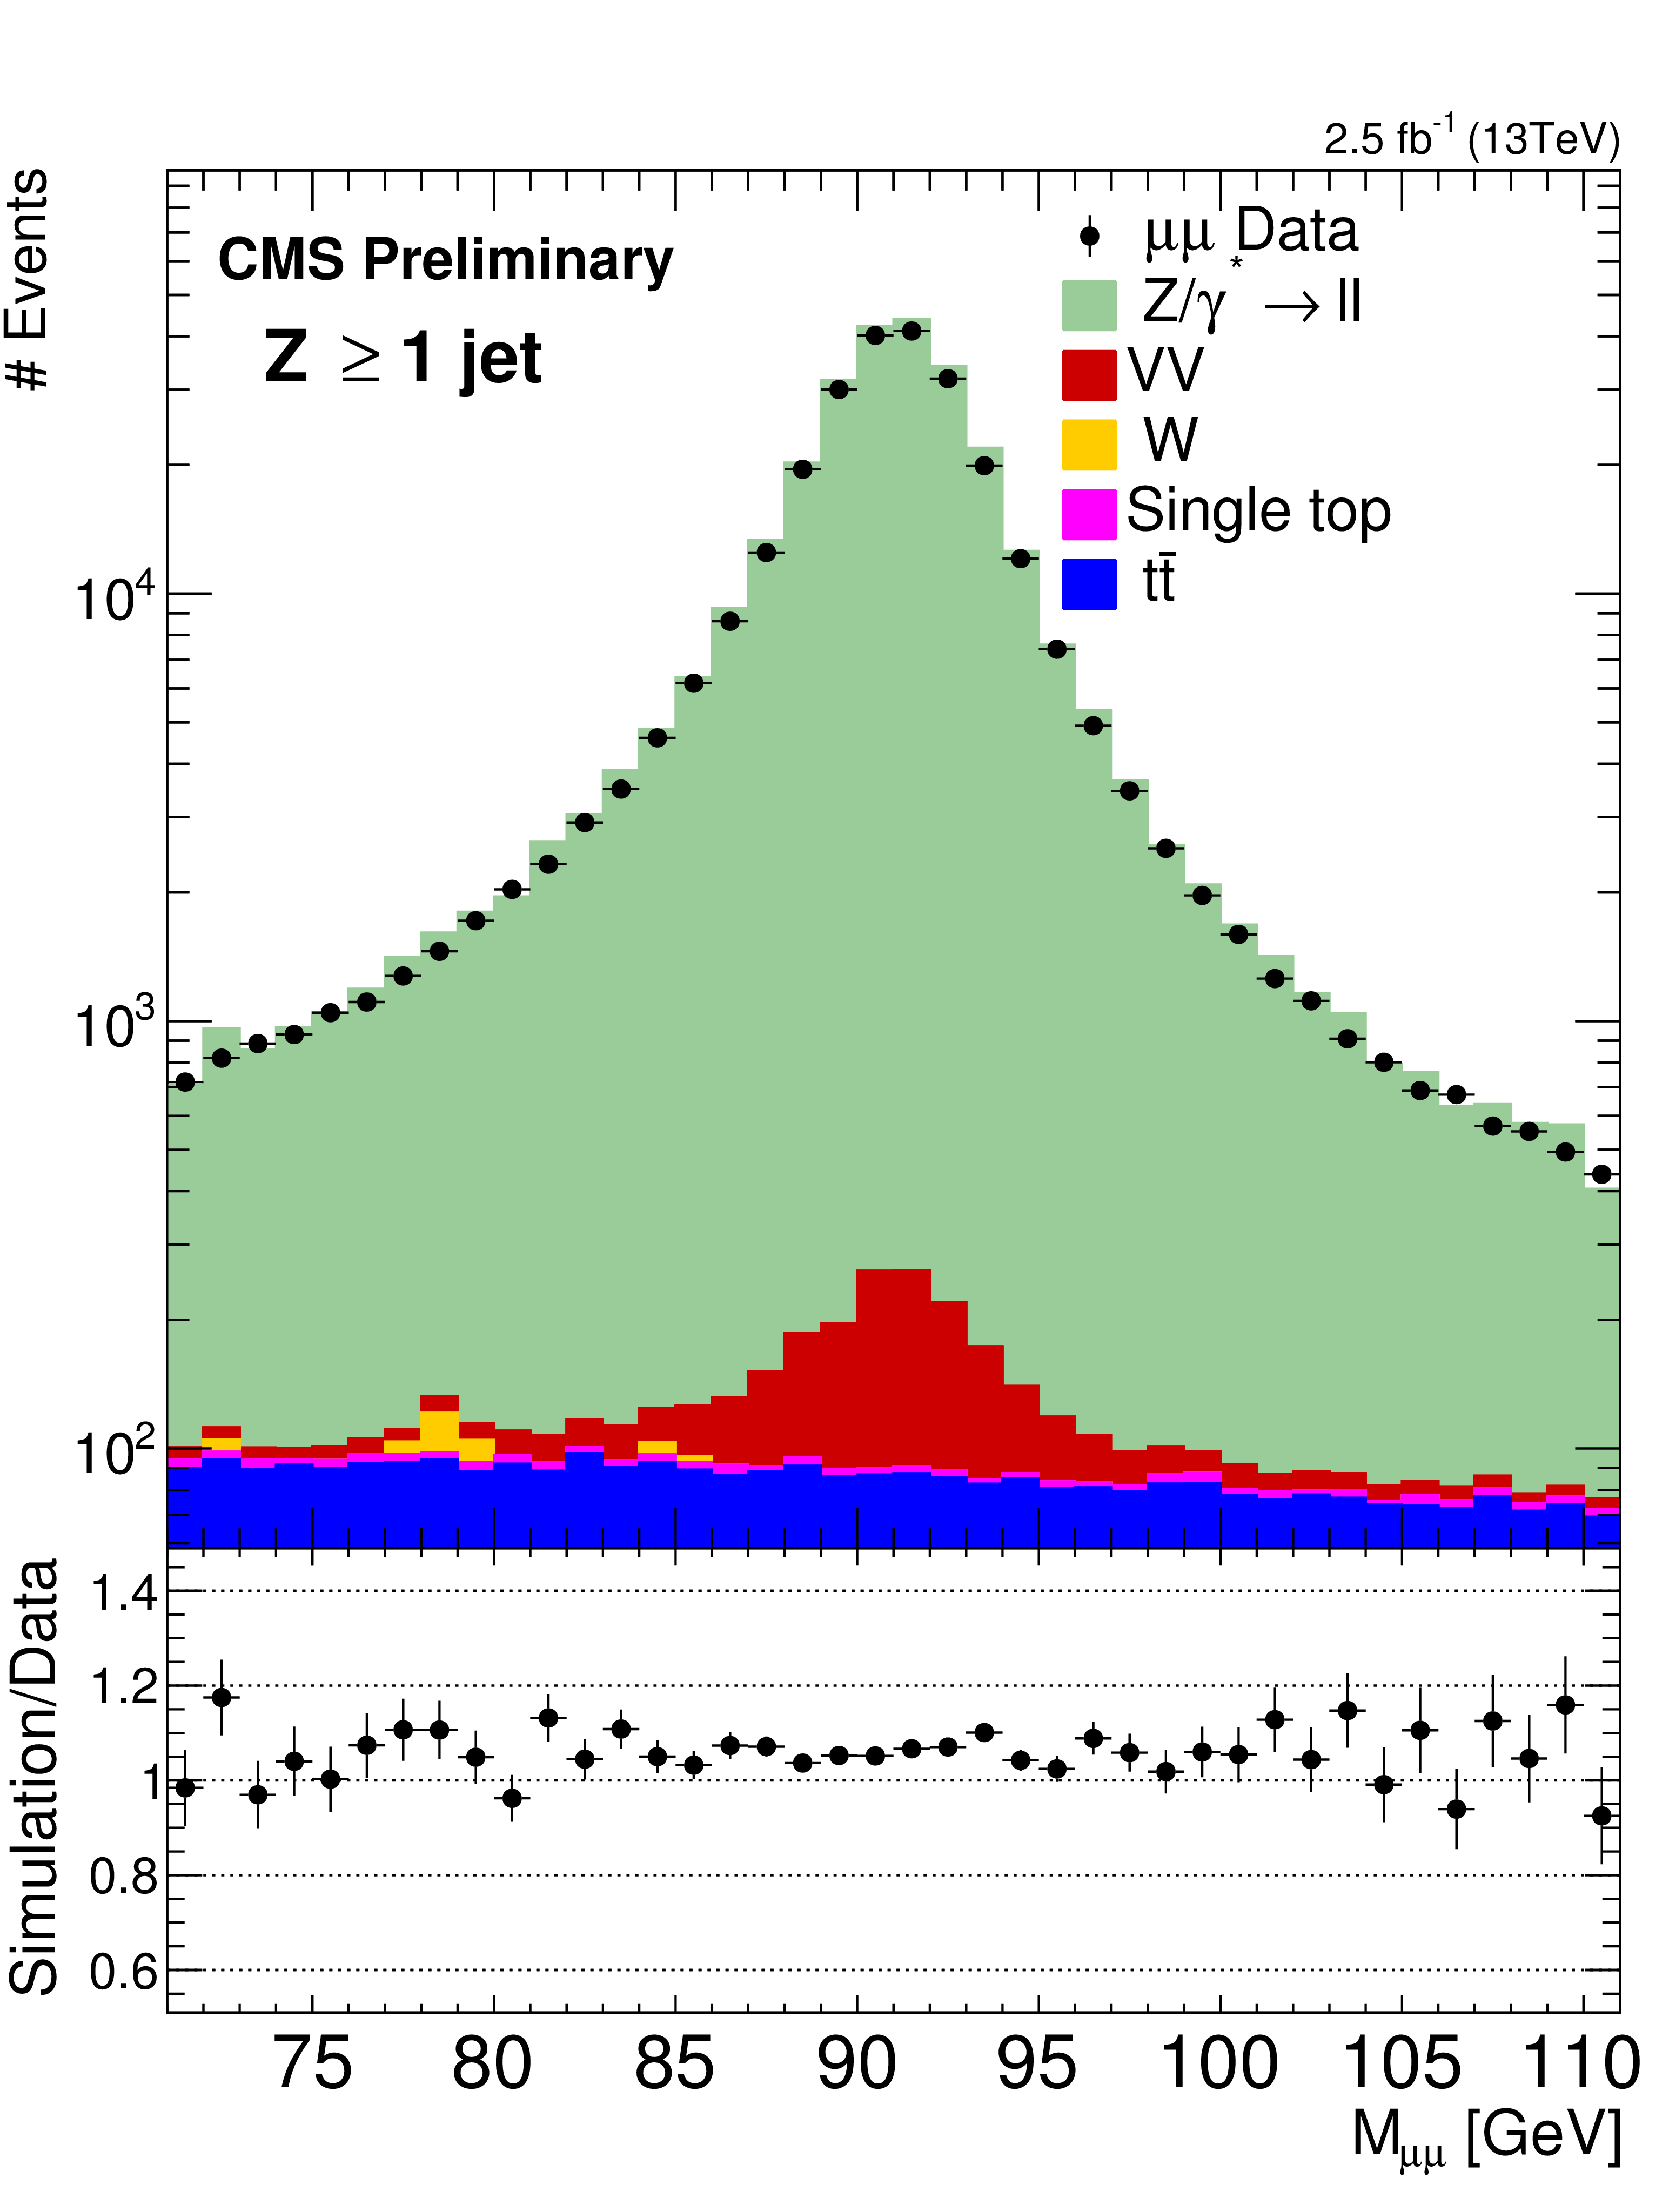
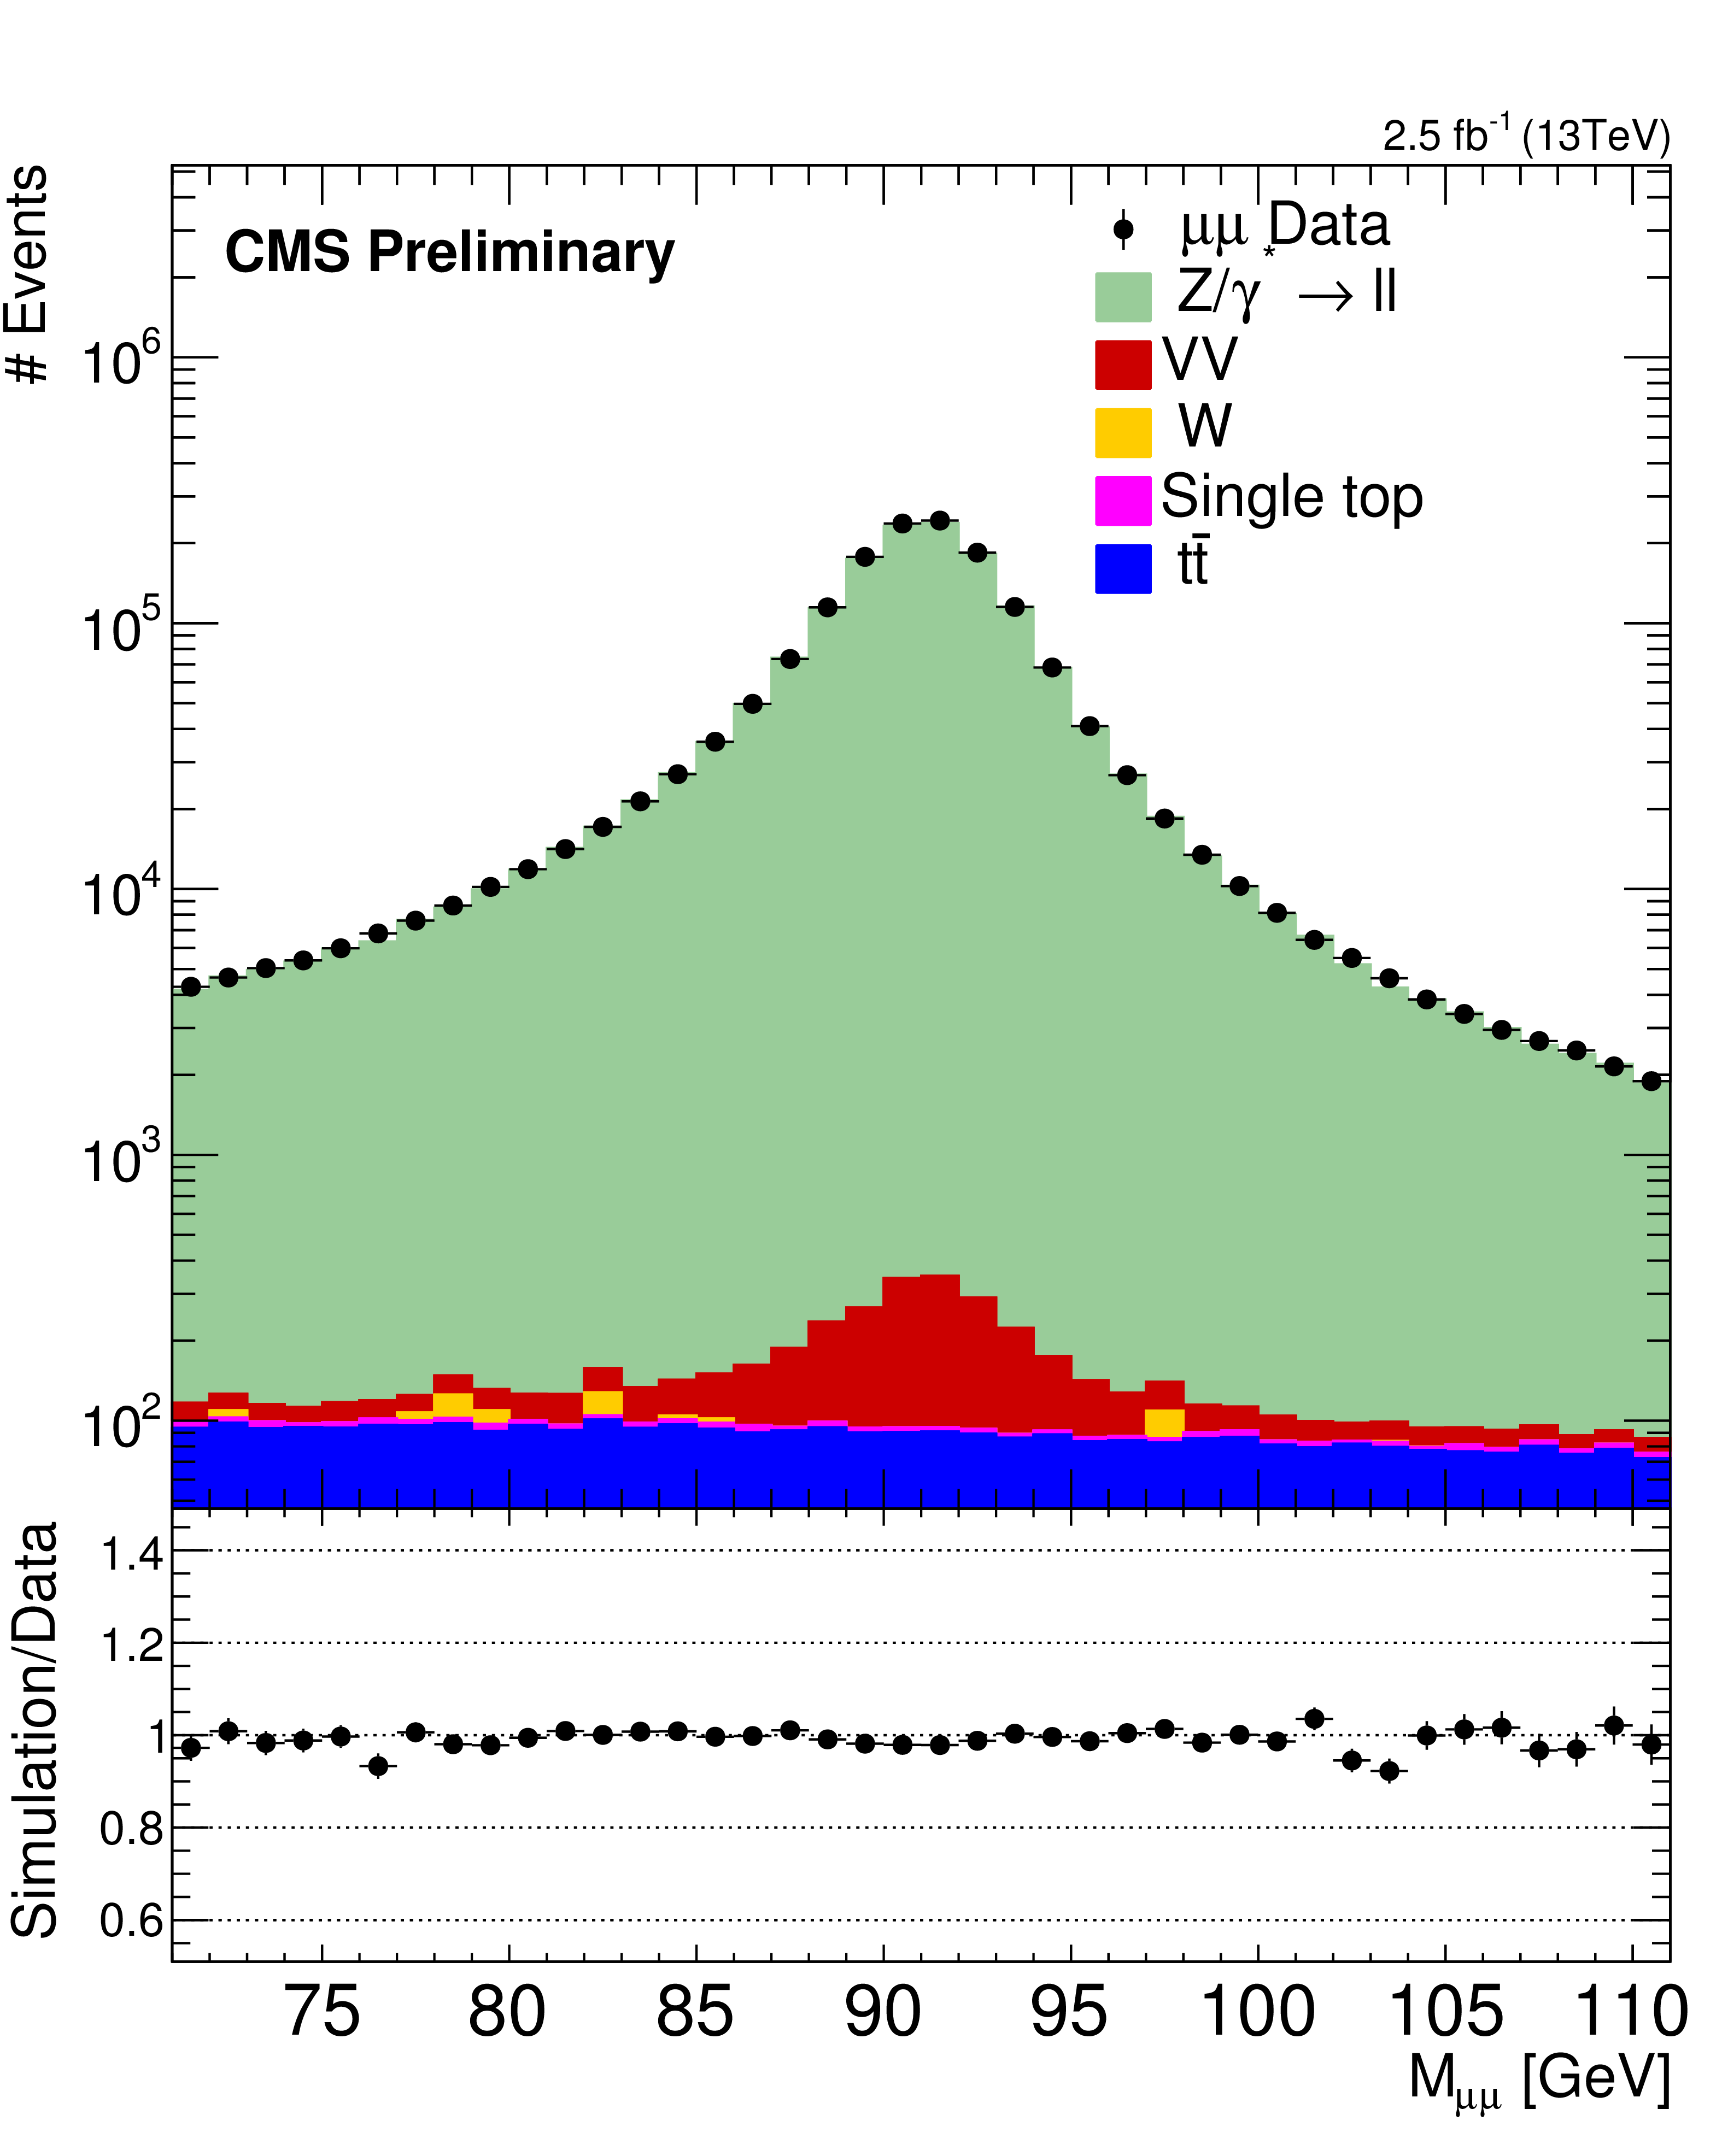
Figure 2-a:
Reconstructed data and simulated signal and backgrounds distributions of the Z candidate invariant mass and rapidity for $\mathrm{ Z } \ + \ge 1 \text { jet}$ events passing the measurement selection. The error bars on the data points correspond to the statistical errors (in the case of the ratio plots, they correspond to the statistical errors coming from both the data and the simulation). |
png pdf |
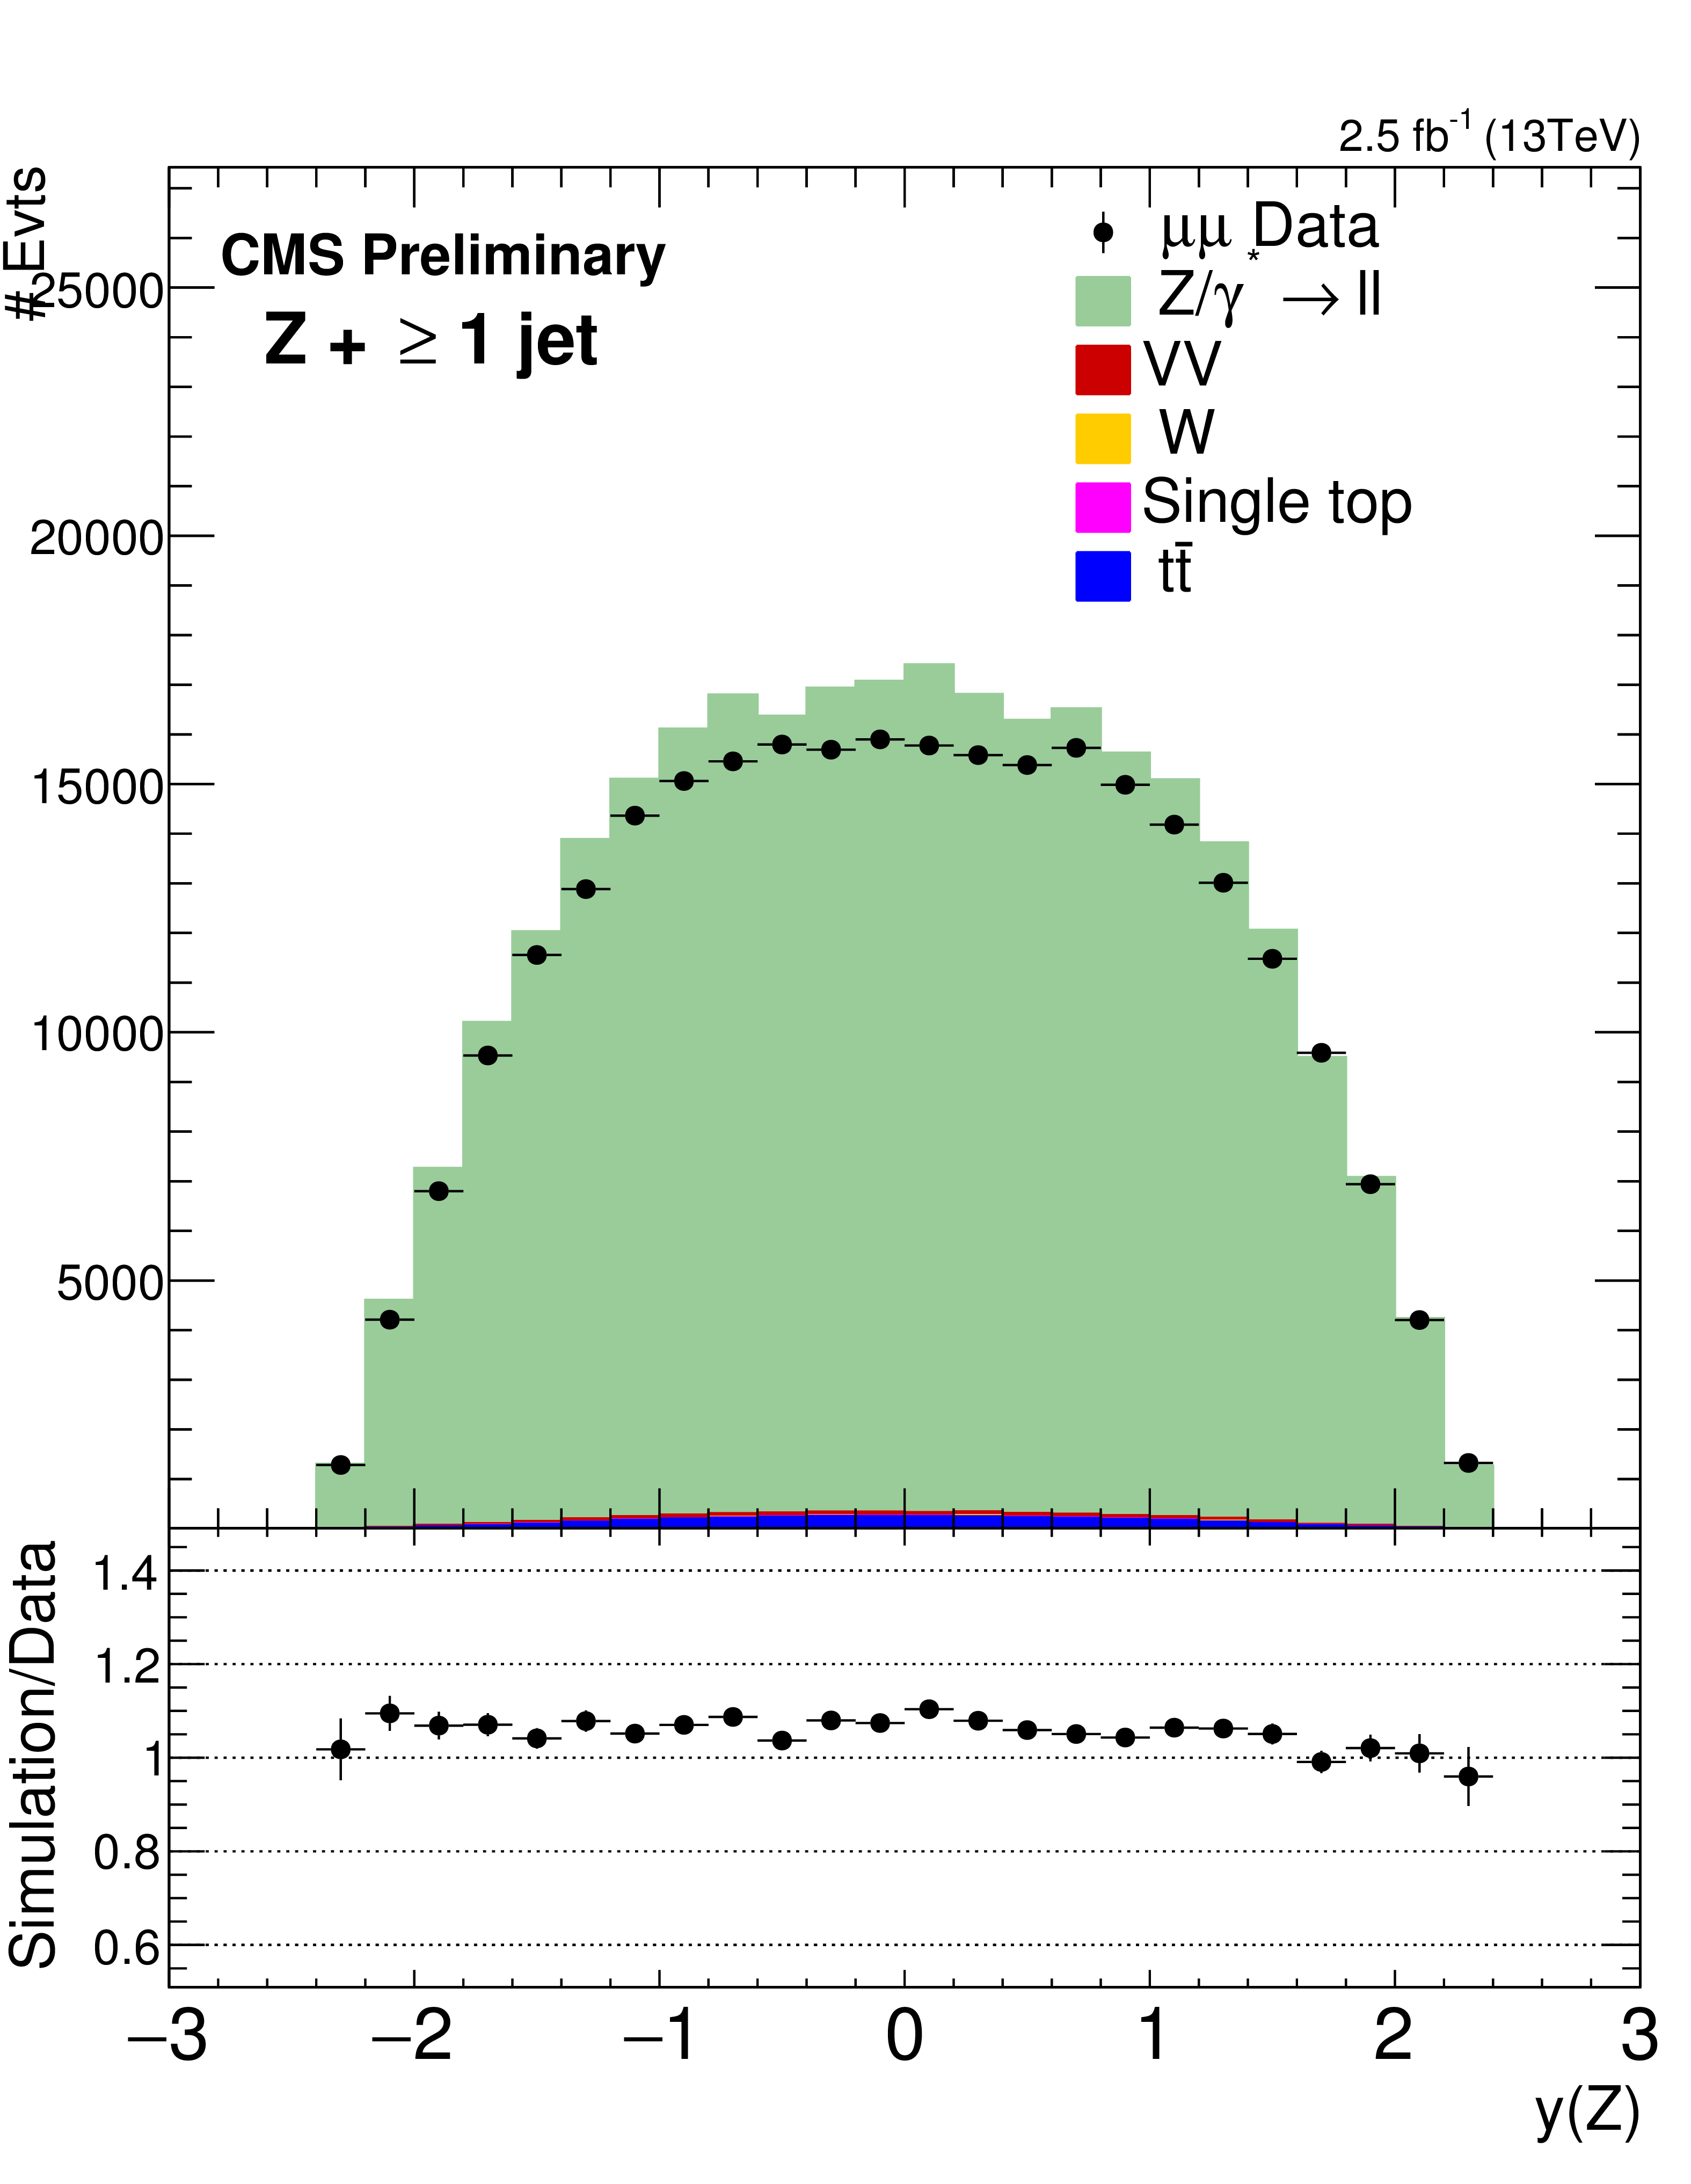
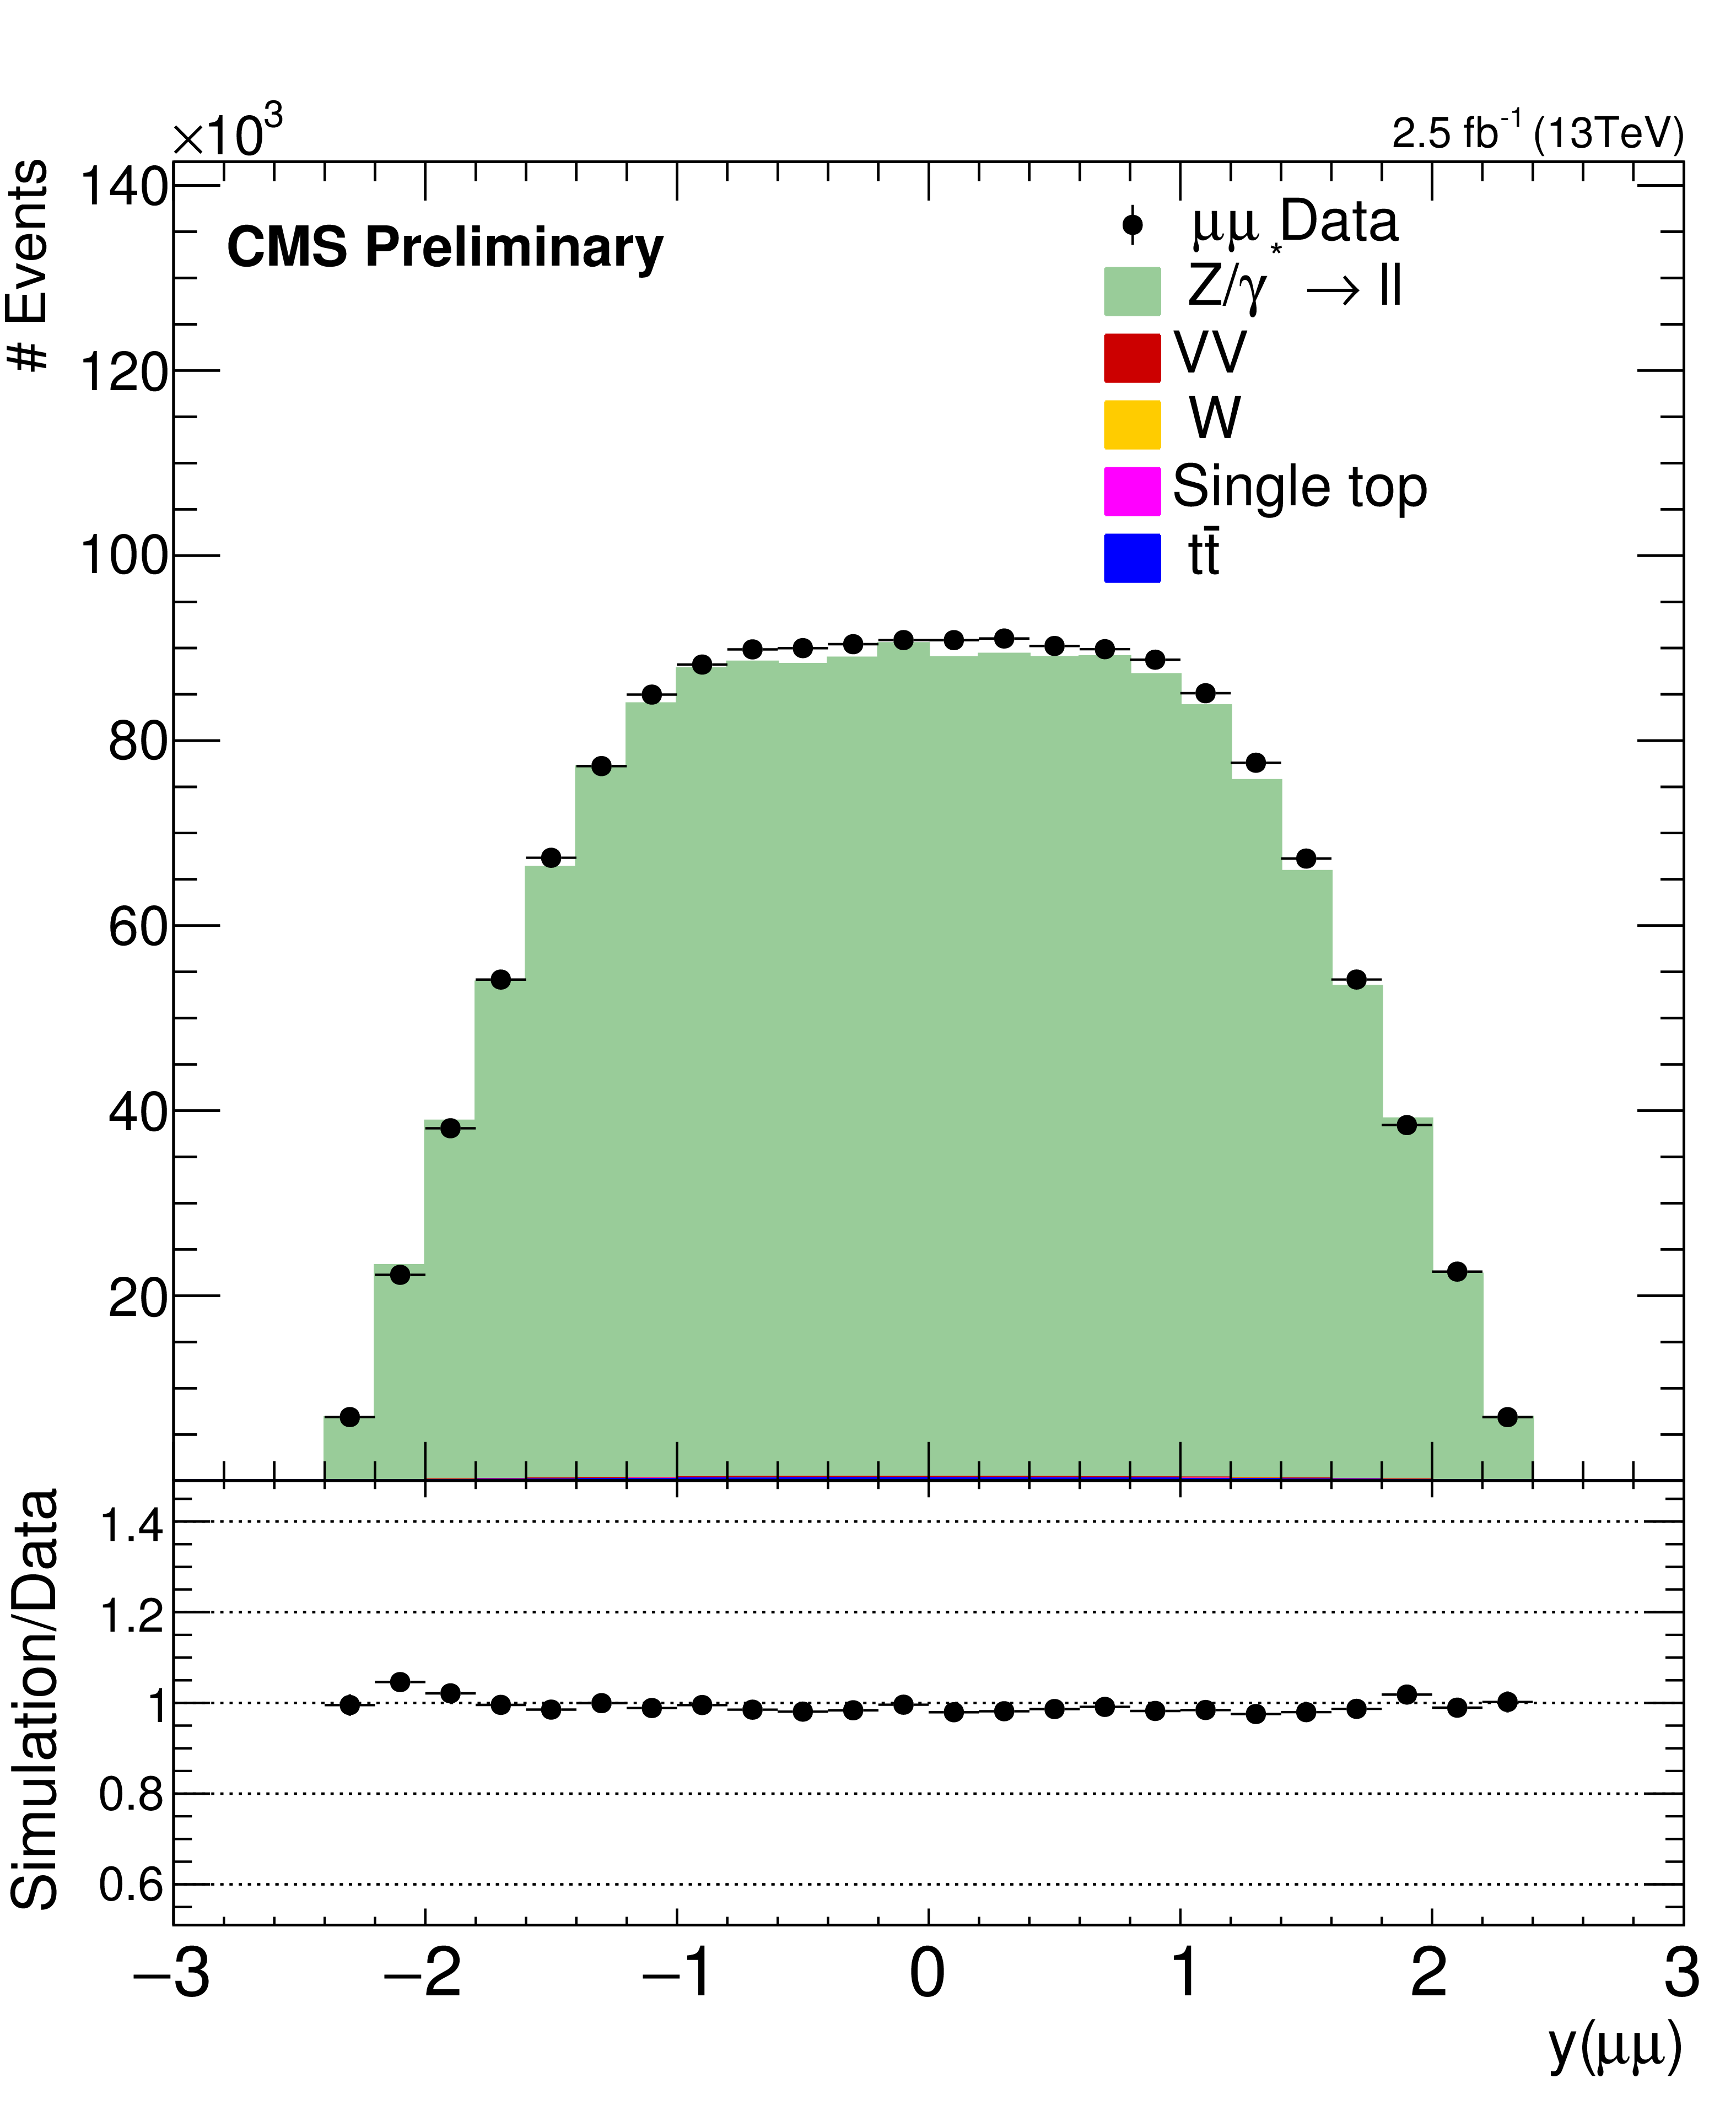
Figure 2-b:
Reconstructed data and simulated signal and backgrounds distributions of the Z candidate invariant mass and rapidity for $\mathrm{ Z } \ + \ge 1 \text { jet}$ events passing the measurement selection. The error bars on the data points correspond to the statistical errors (in the case of the ratio plots, they correspond to the statistical errors coming from both the data and the simulation). |
png pdf |
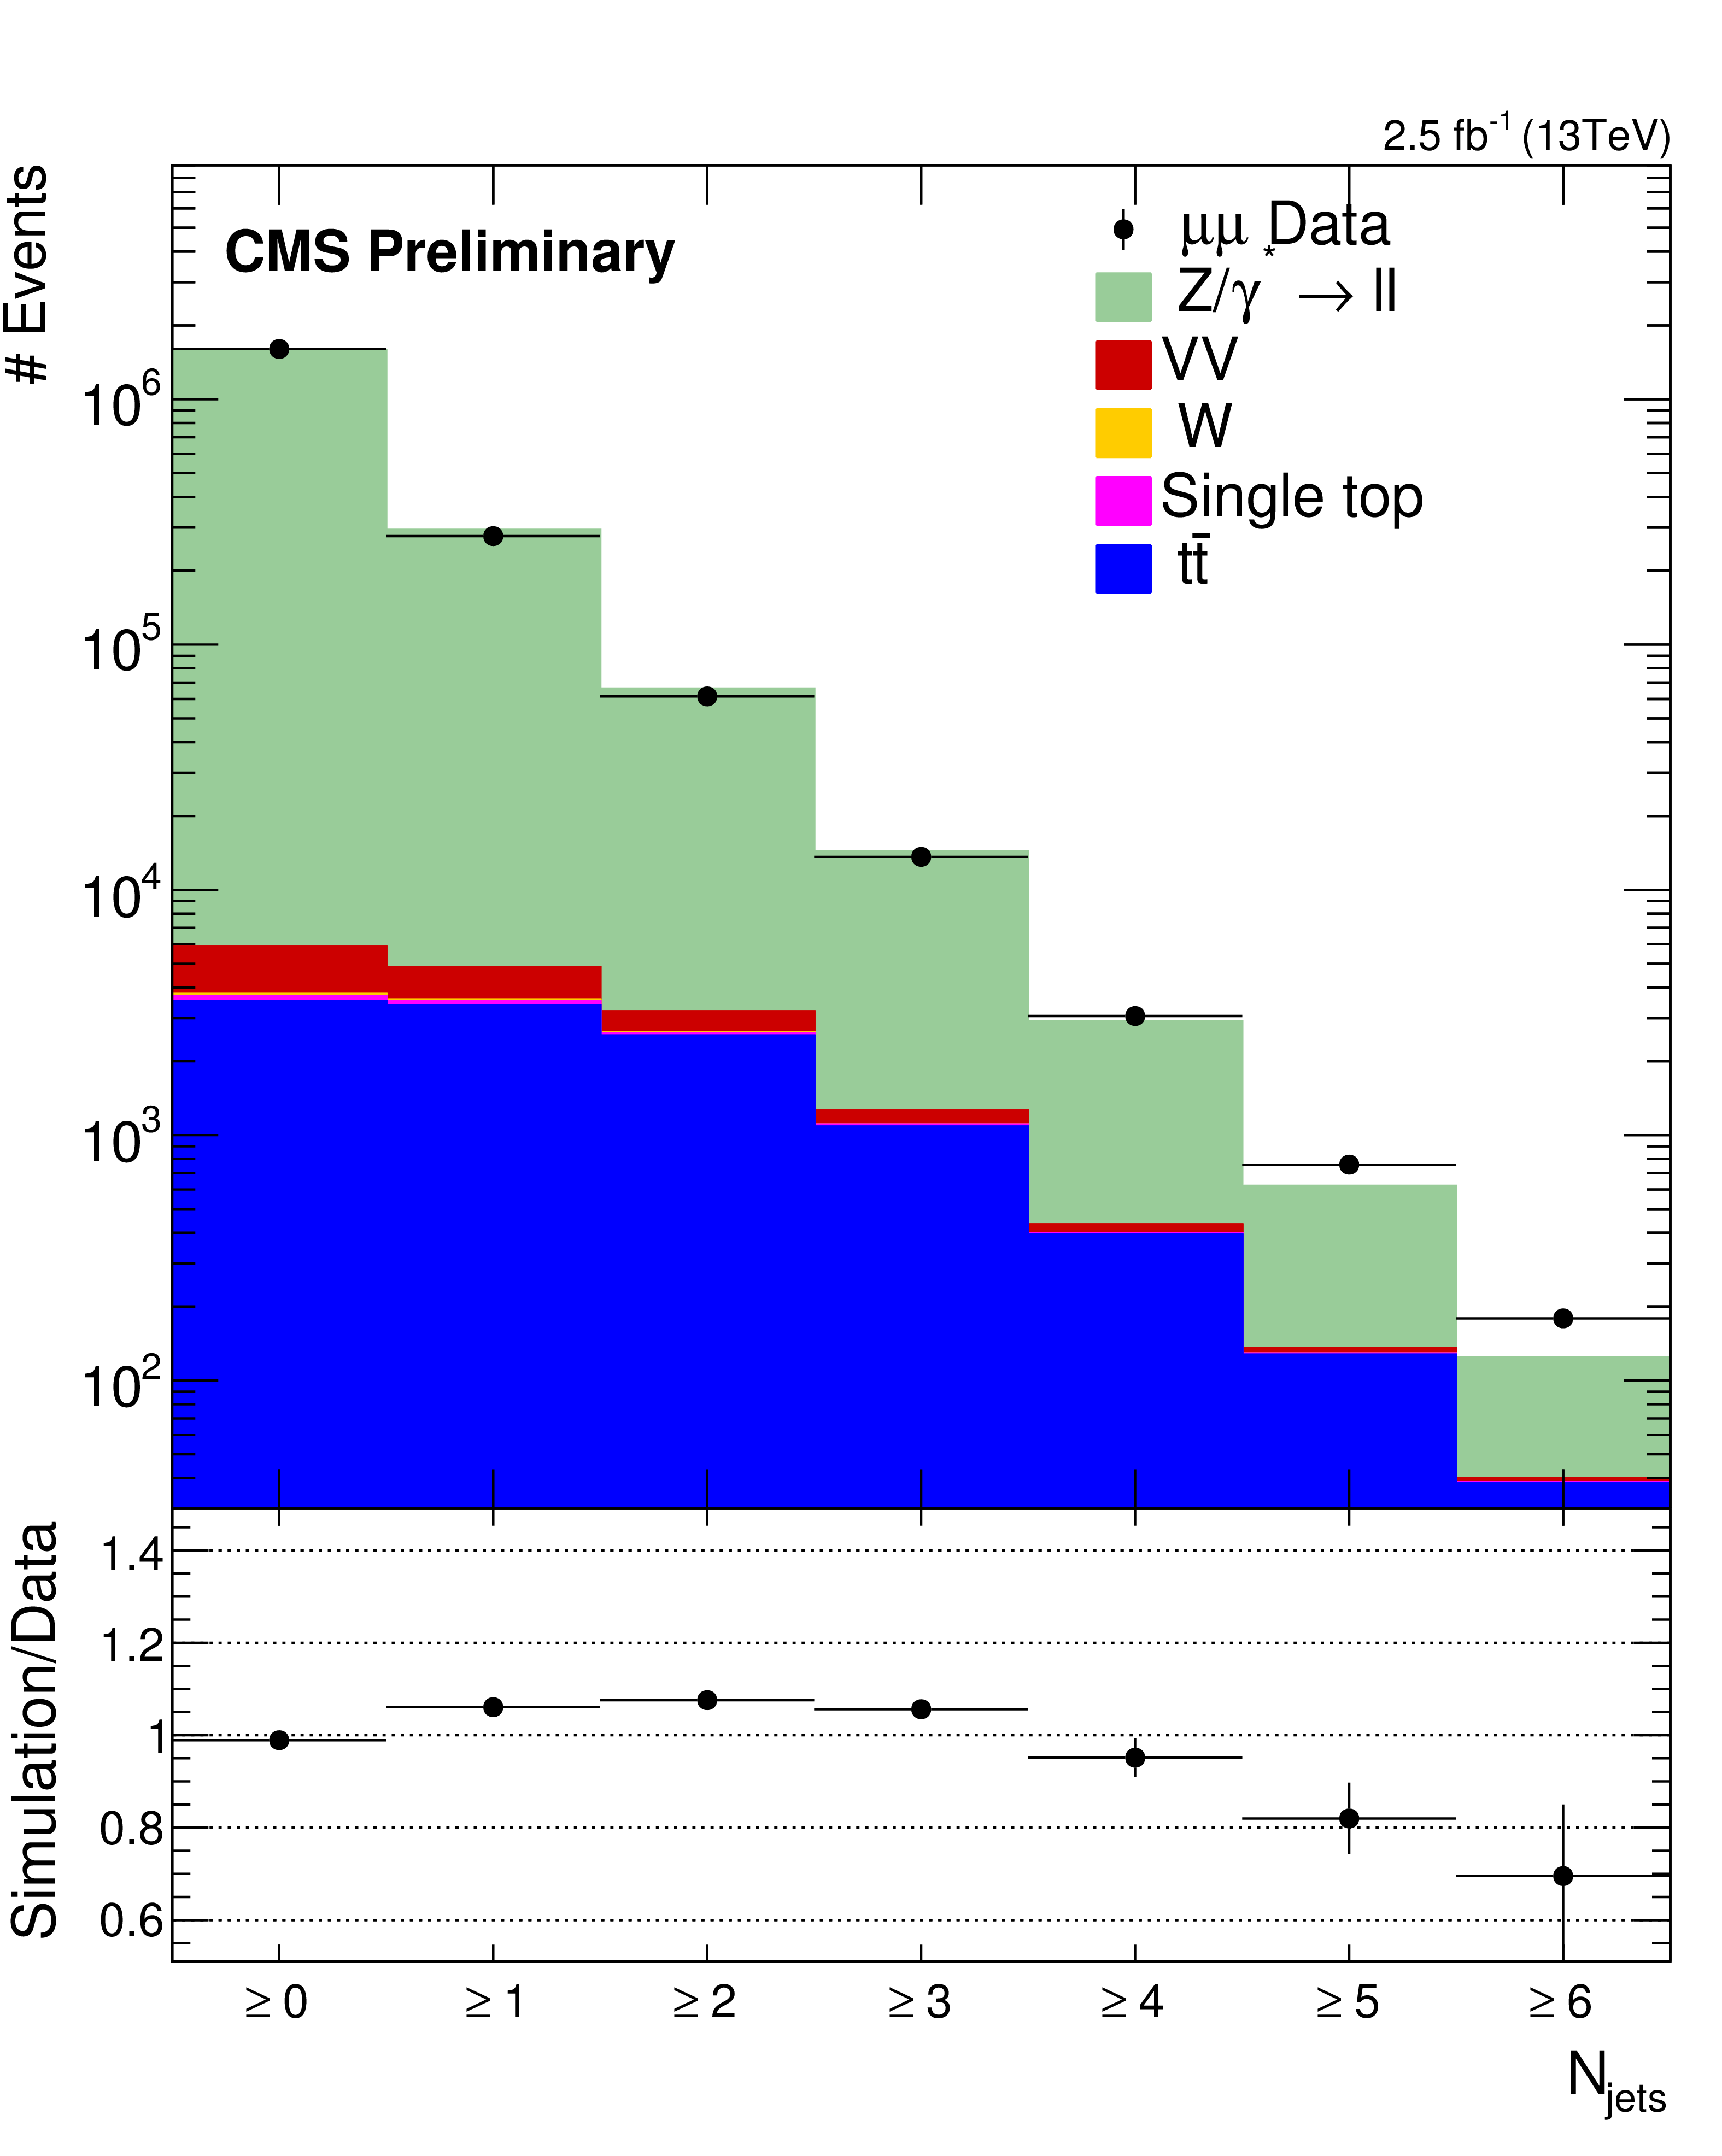
Figure 3-a:
Reconstructed data and simulated signal and backgrounds distributions of (a) the inclusive jet multiplicity and (b) exclusive jet multiplicity. The error bars on the data points correspond to the statistical errors (in the case of the ratio plots, they correspond to the statistical errors coming from both the data and the simulation). |
png pdf |
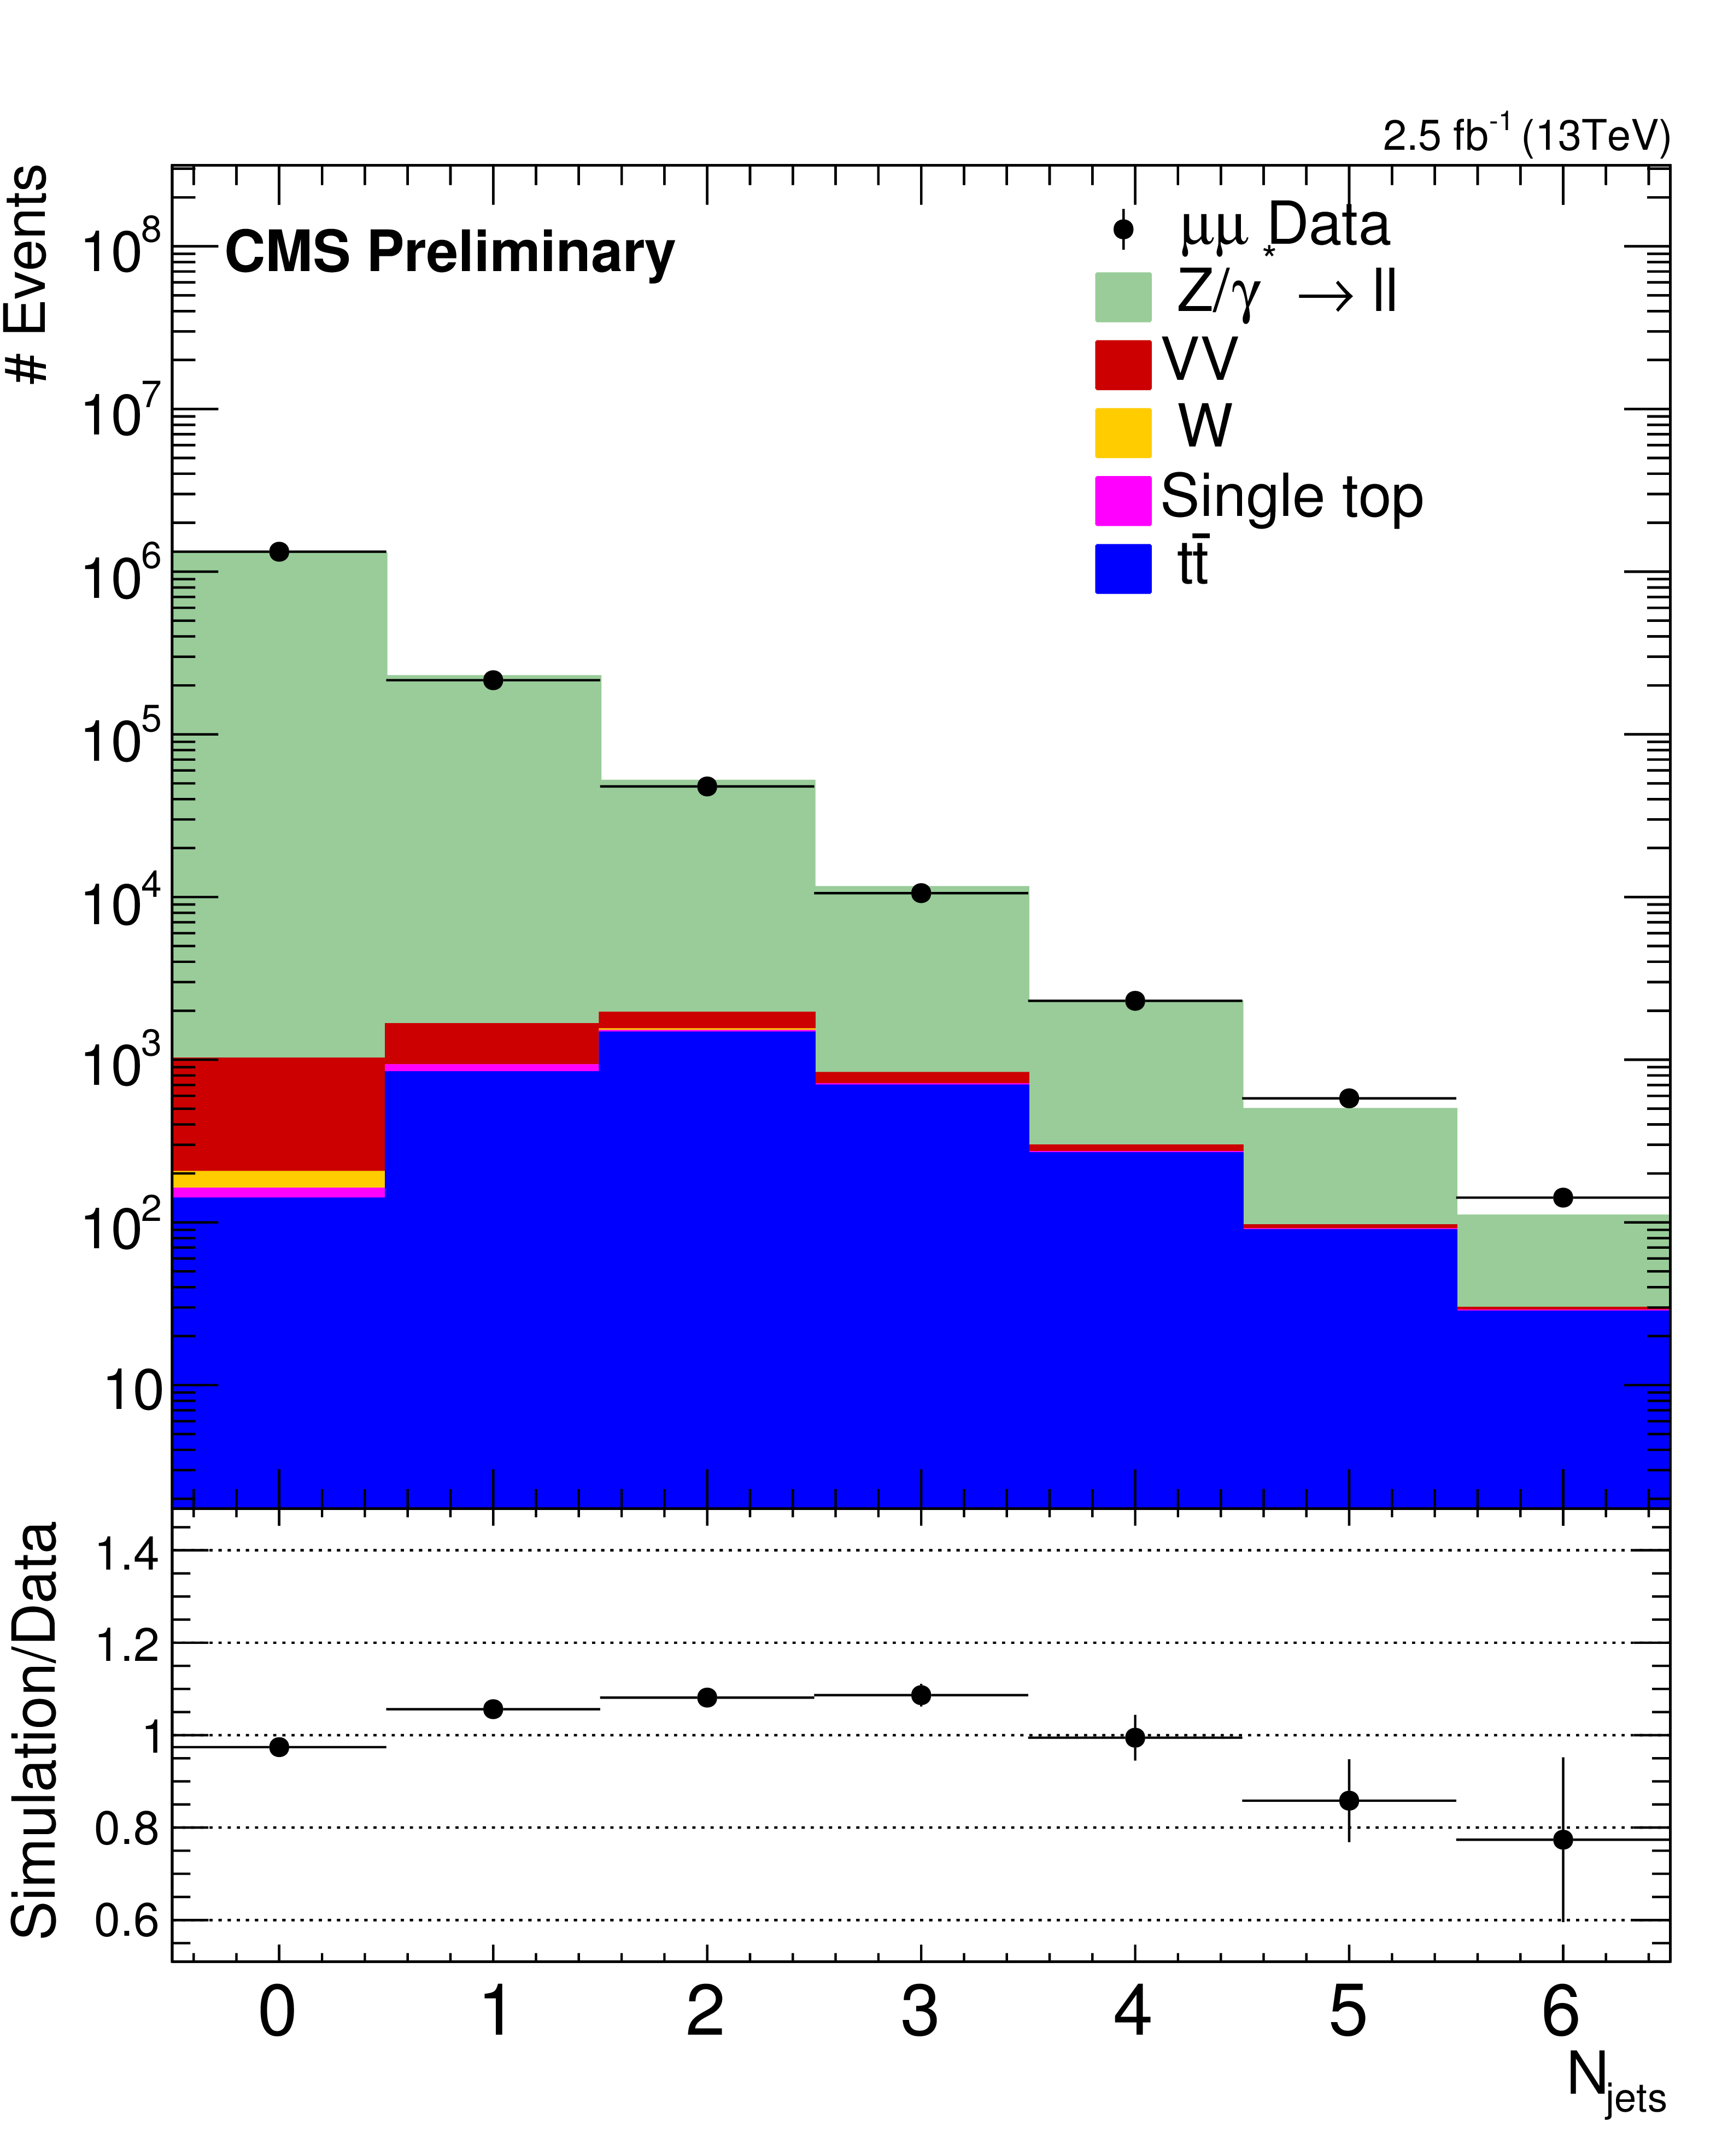
Figure 3-b:
Reconstructed data and simulated signal and backgrounds distributions of (a) the inclusive jet multiplicity and (b) exclusive jet multiplicity. The error bars on the data points correspond to the statistical errors (in the case of the ratio plots, they correspond to the statistical errors coming from both the data and the simulation). |

png pdf |
Figure 4-a:
Reconstructed data and simulated signal and backgrounds distributions of the transverse momenta of the two highest $ {p_{\mathrm {T}}} $ jets. The error bars on the data points correspond to the statistical errors (in the case of the ratio plots, they correspond to the statistical errors coming from both the data and the simulation). |
png pdf |
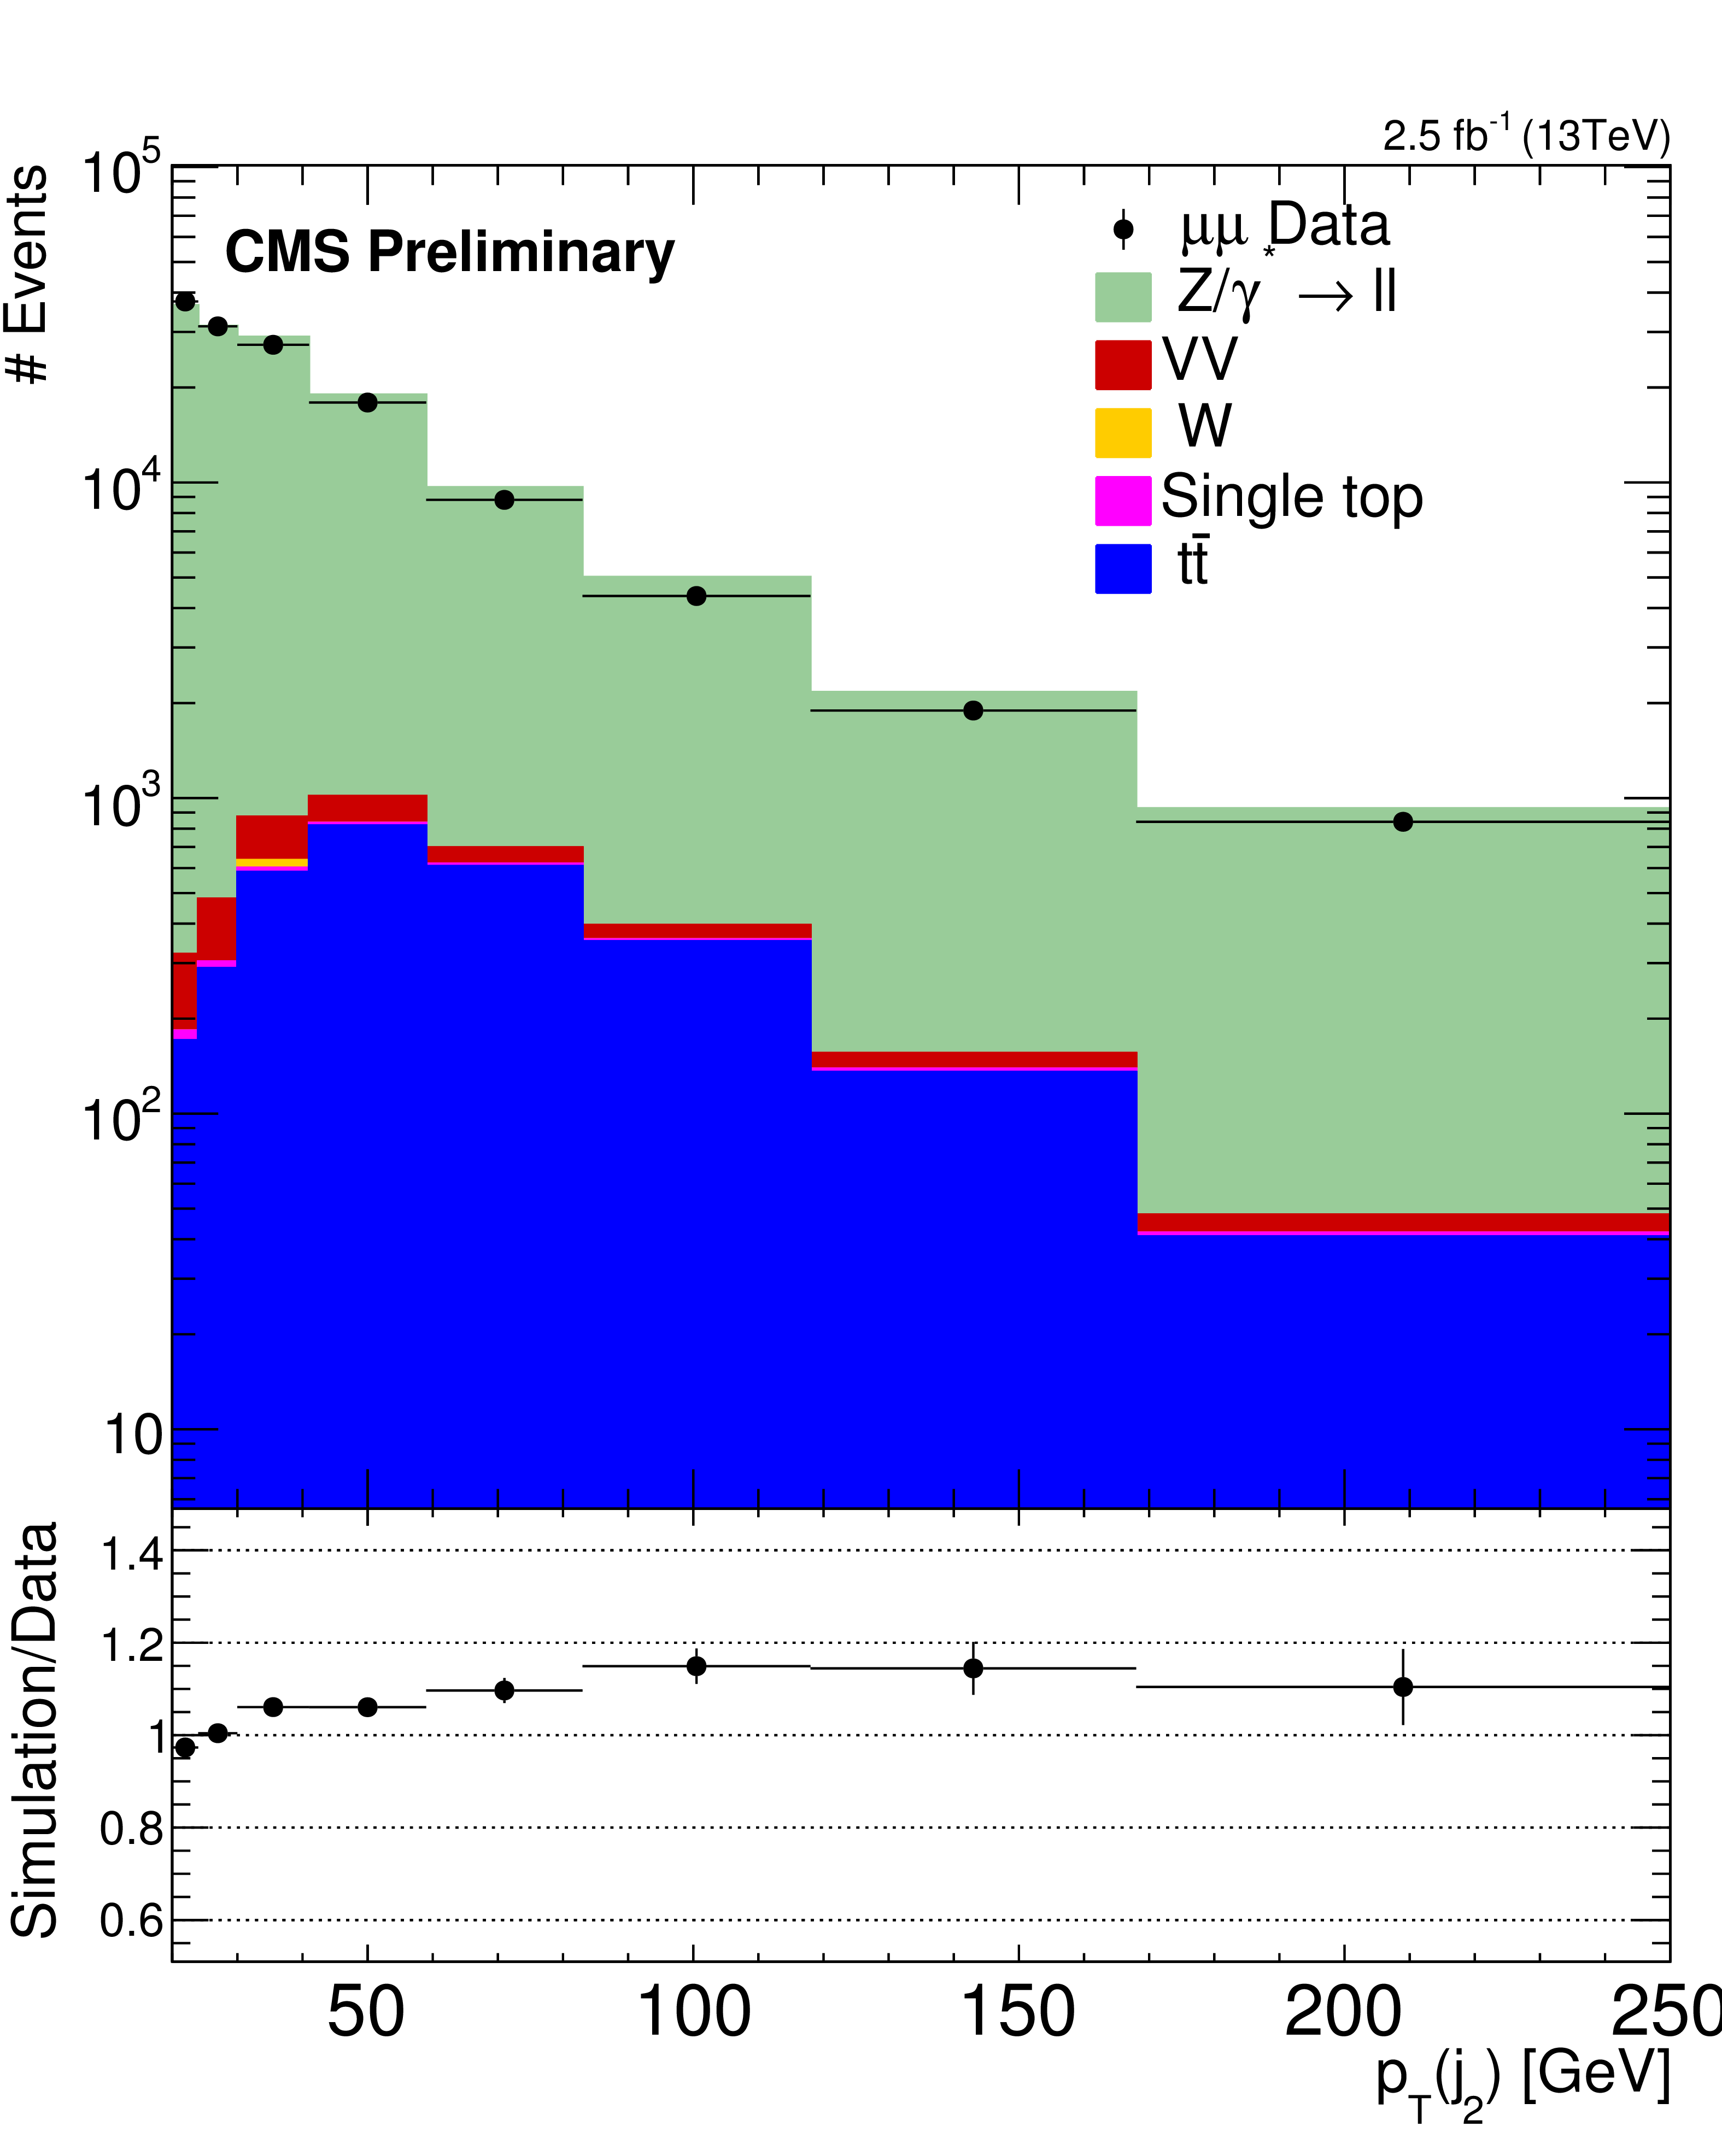
Figure 4-b:
Reconstructed data and simulated signal and backgrounds distributions of the transverse momenta of the two highest $ {p_{\mathrm {T}}} $ jets. The error bars on the data points correspond to the statistical errors (in the case of the ratio plots, they correspond to the statistical errors coming from both the data and the simulation). |
png pdf |
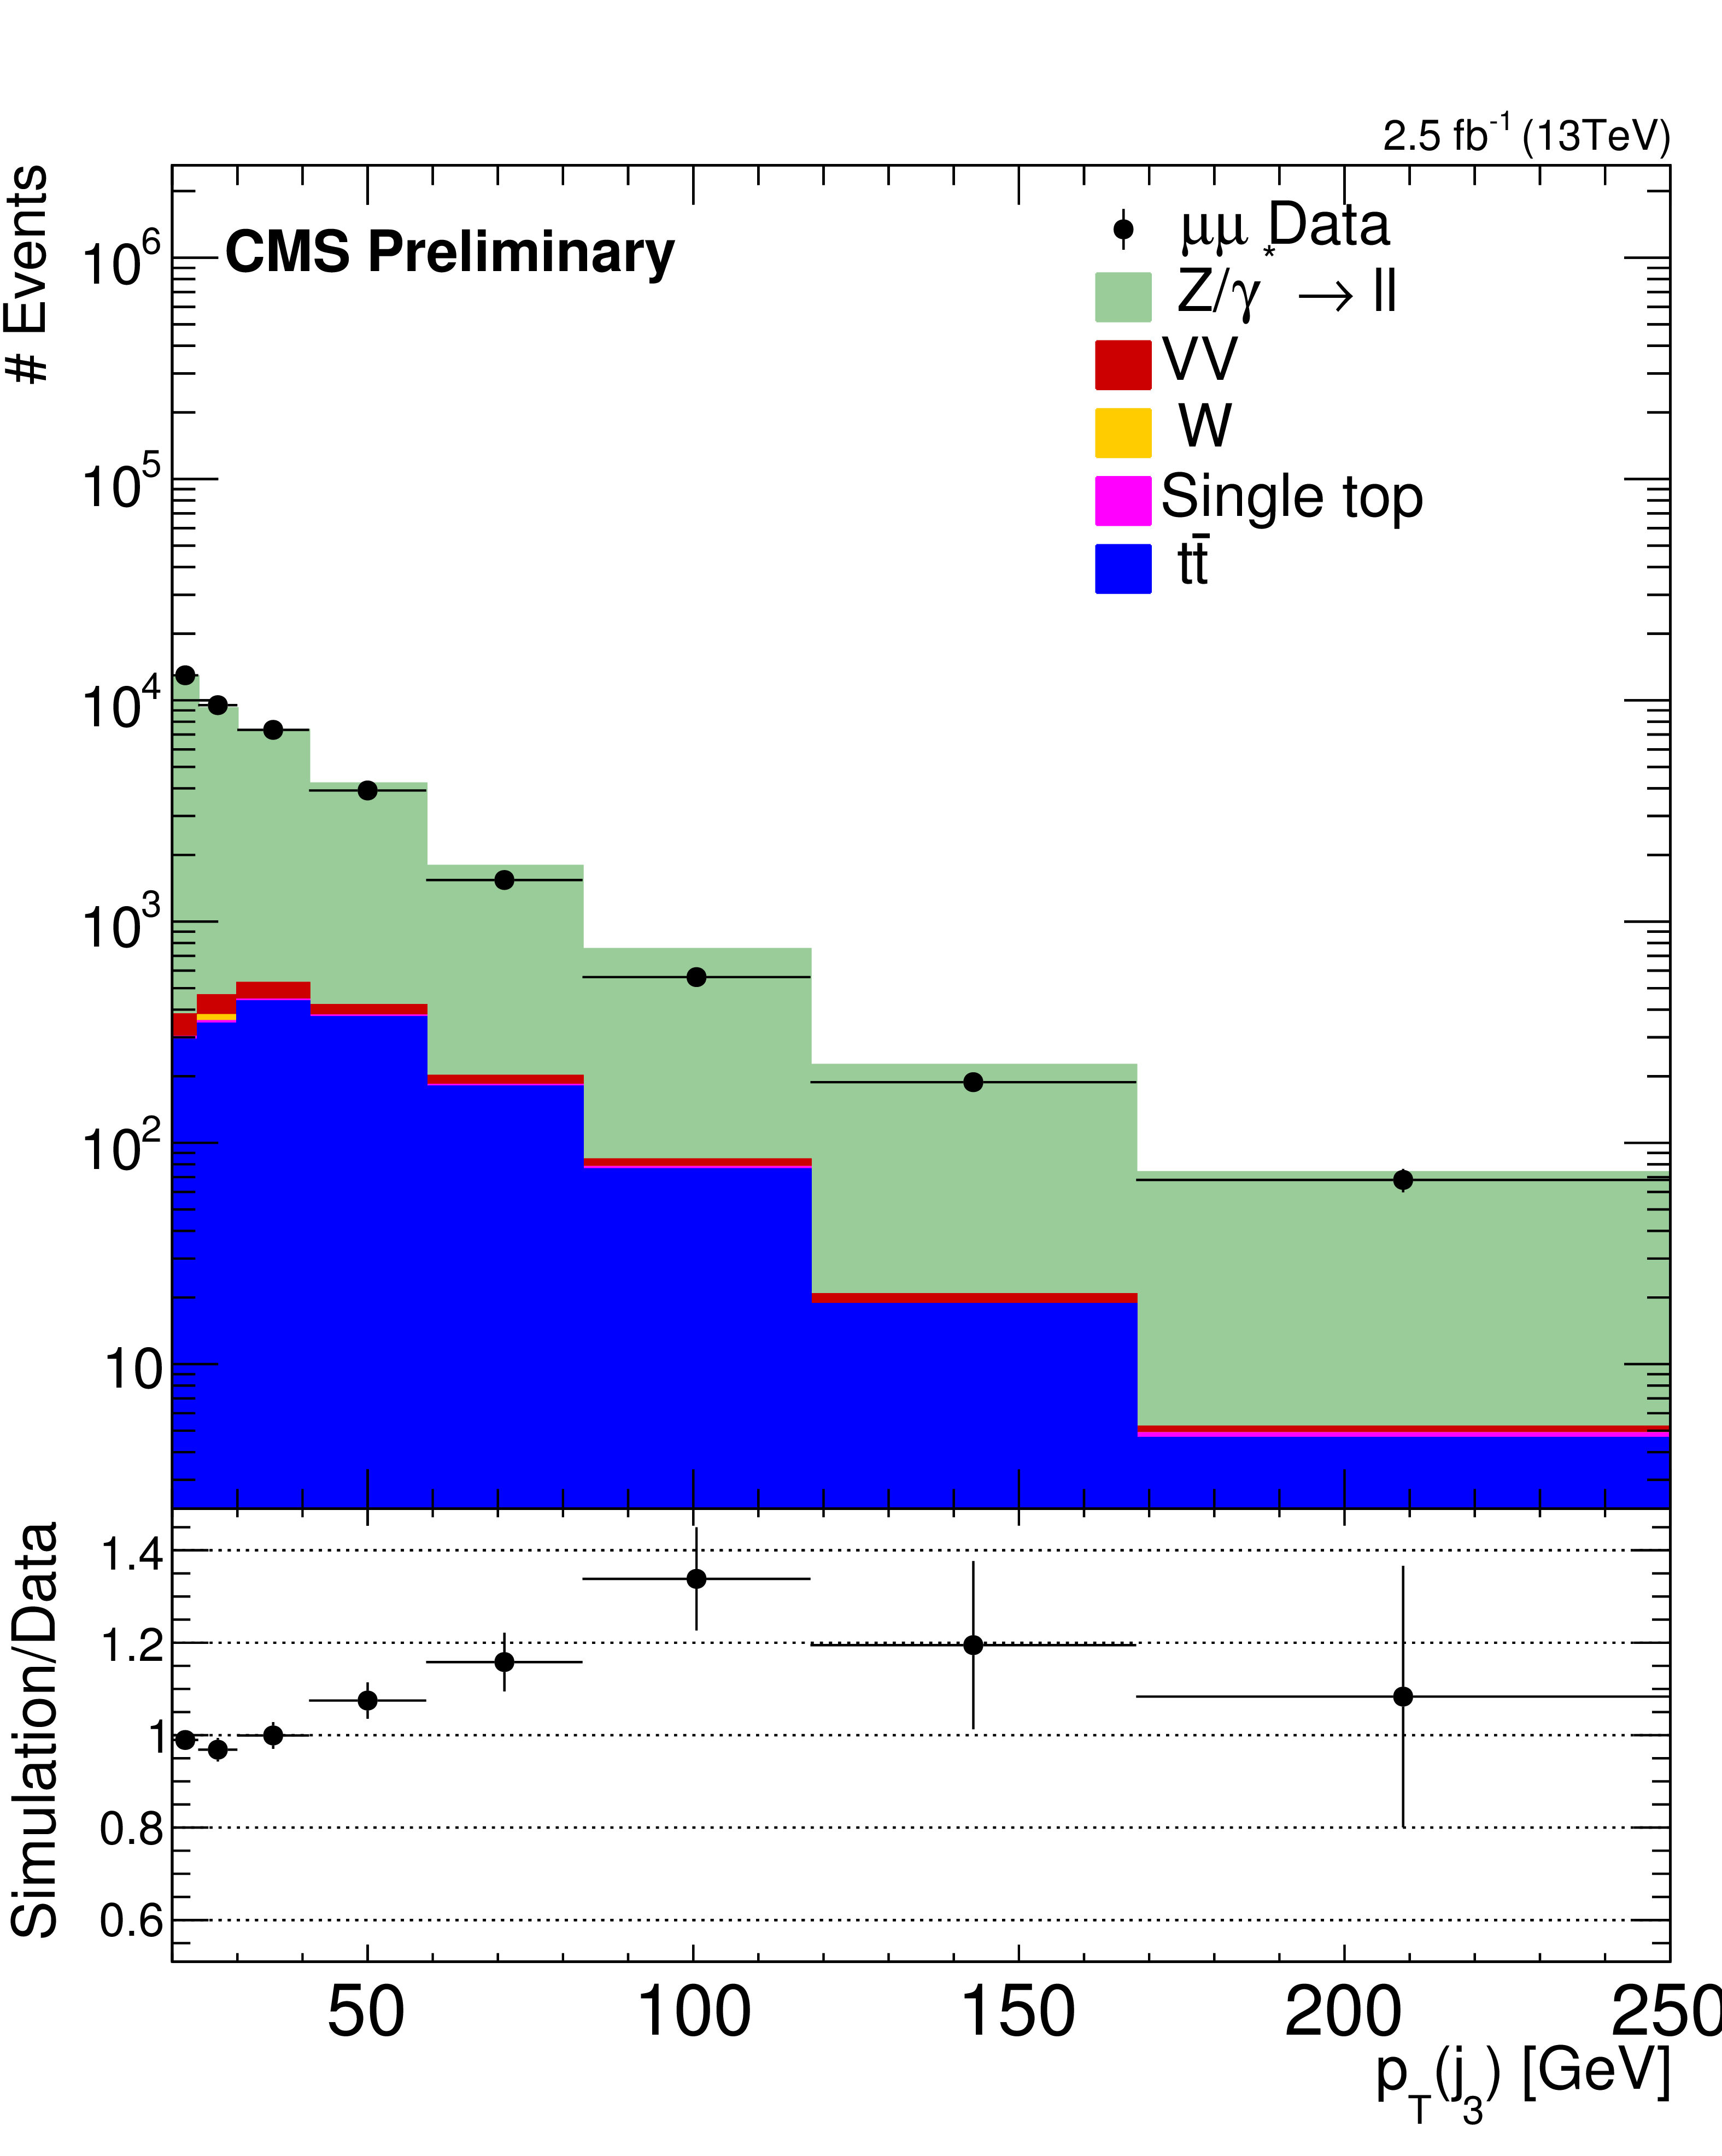
Figure 5:
Reconstructed data and simulated signal and backgrounds distributions of the transverse momenta of the third highest $ {p_{\mathrm {T}}} $ jet. The error bars on the data points correspond to the statistical errors (in the case of the ratio plots, they correspond to the statistical errors coming from both the data and the simulation). |
png pdf |
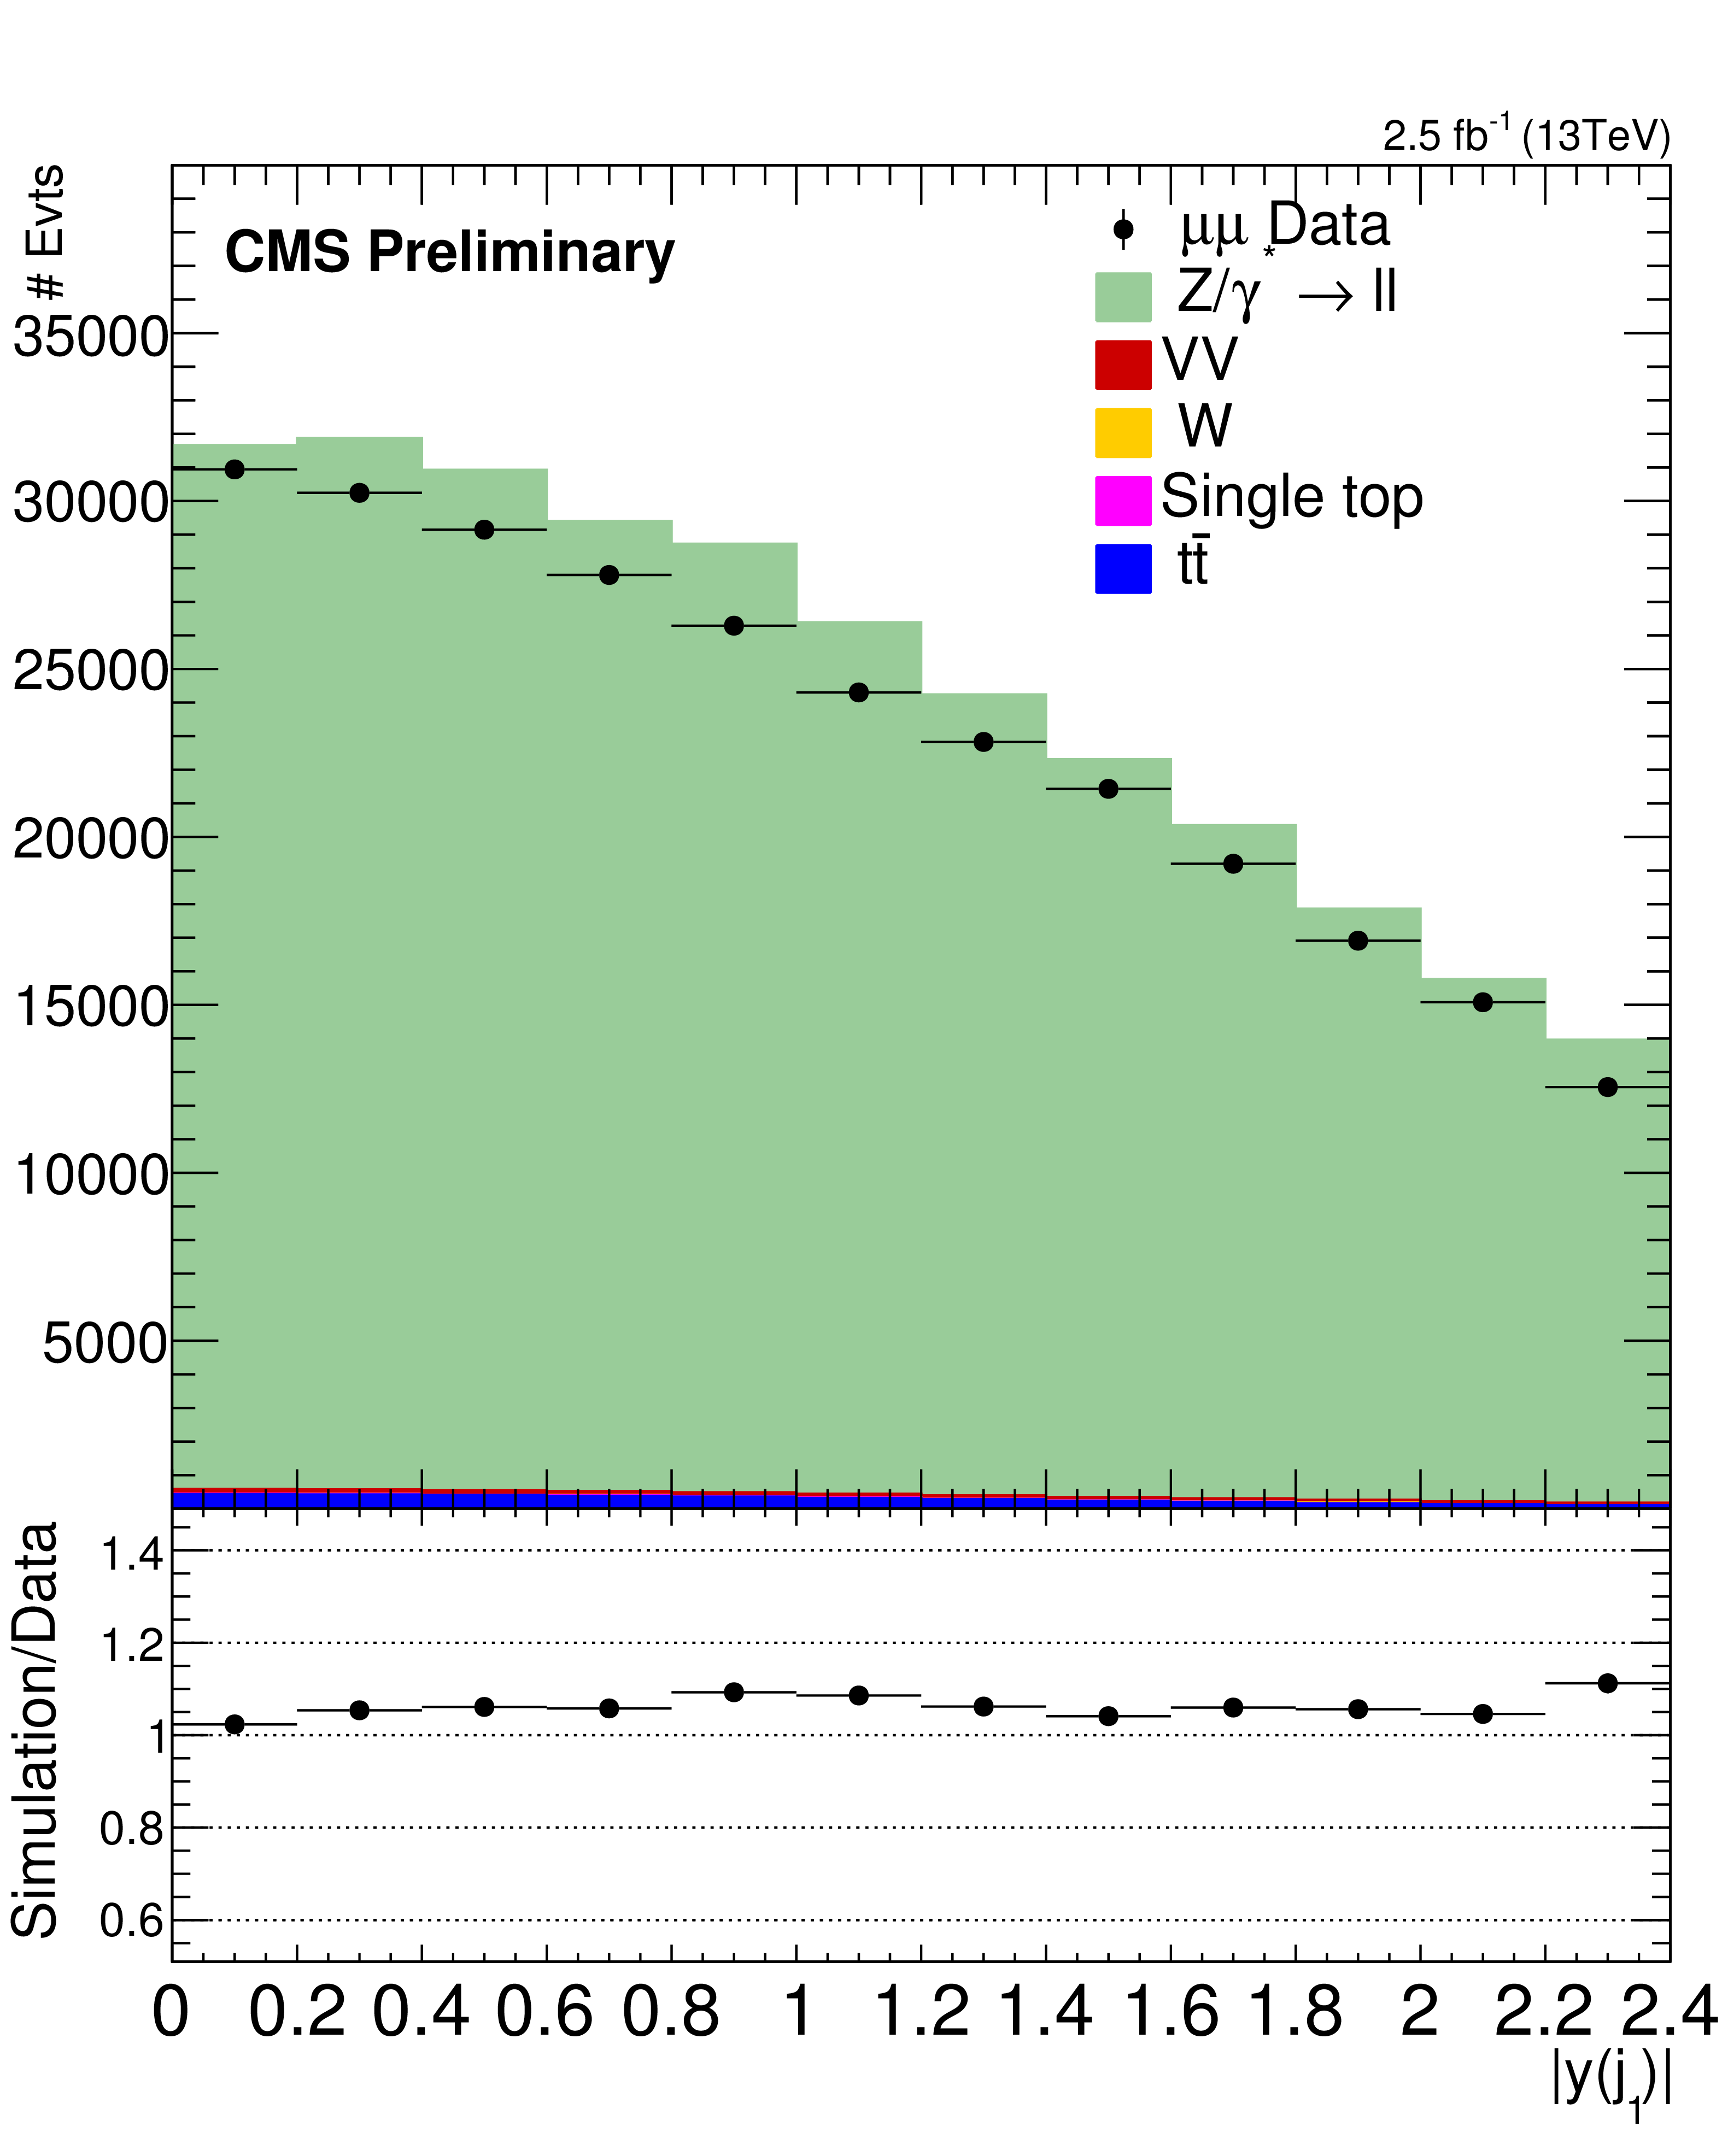
Figure 6-a:
Reconstructed data and simulated signal and backgrounds distributions of the rapidity of the two highest $ {p_{\mathrm {T}}} $ jets. The error bars on the data points correspond to the statistical errors (in the case of the ratio plots, they correspond to the statistical errors coming from both the data and the simulation). |
png pdf |
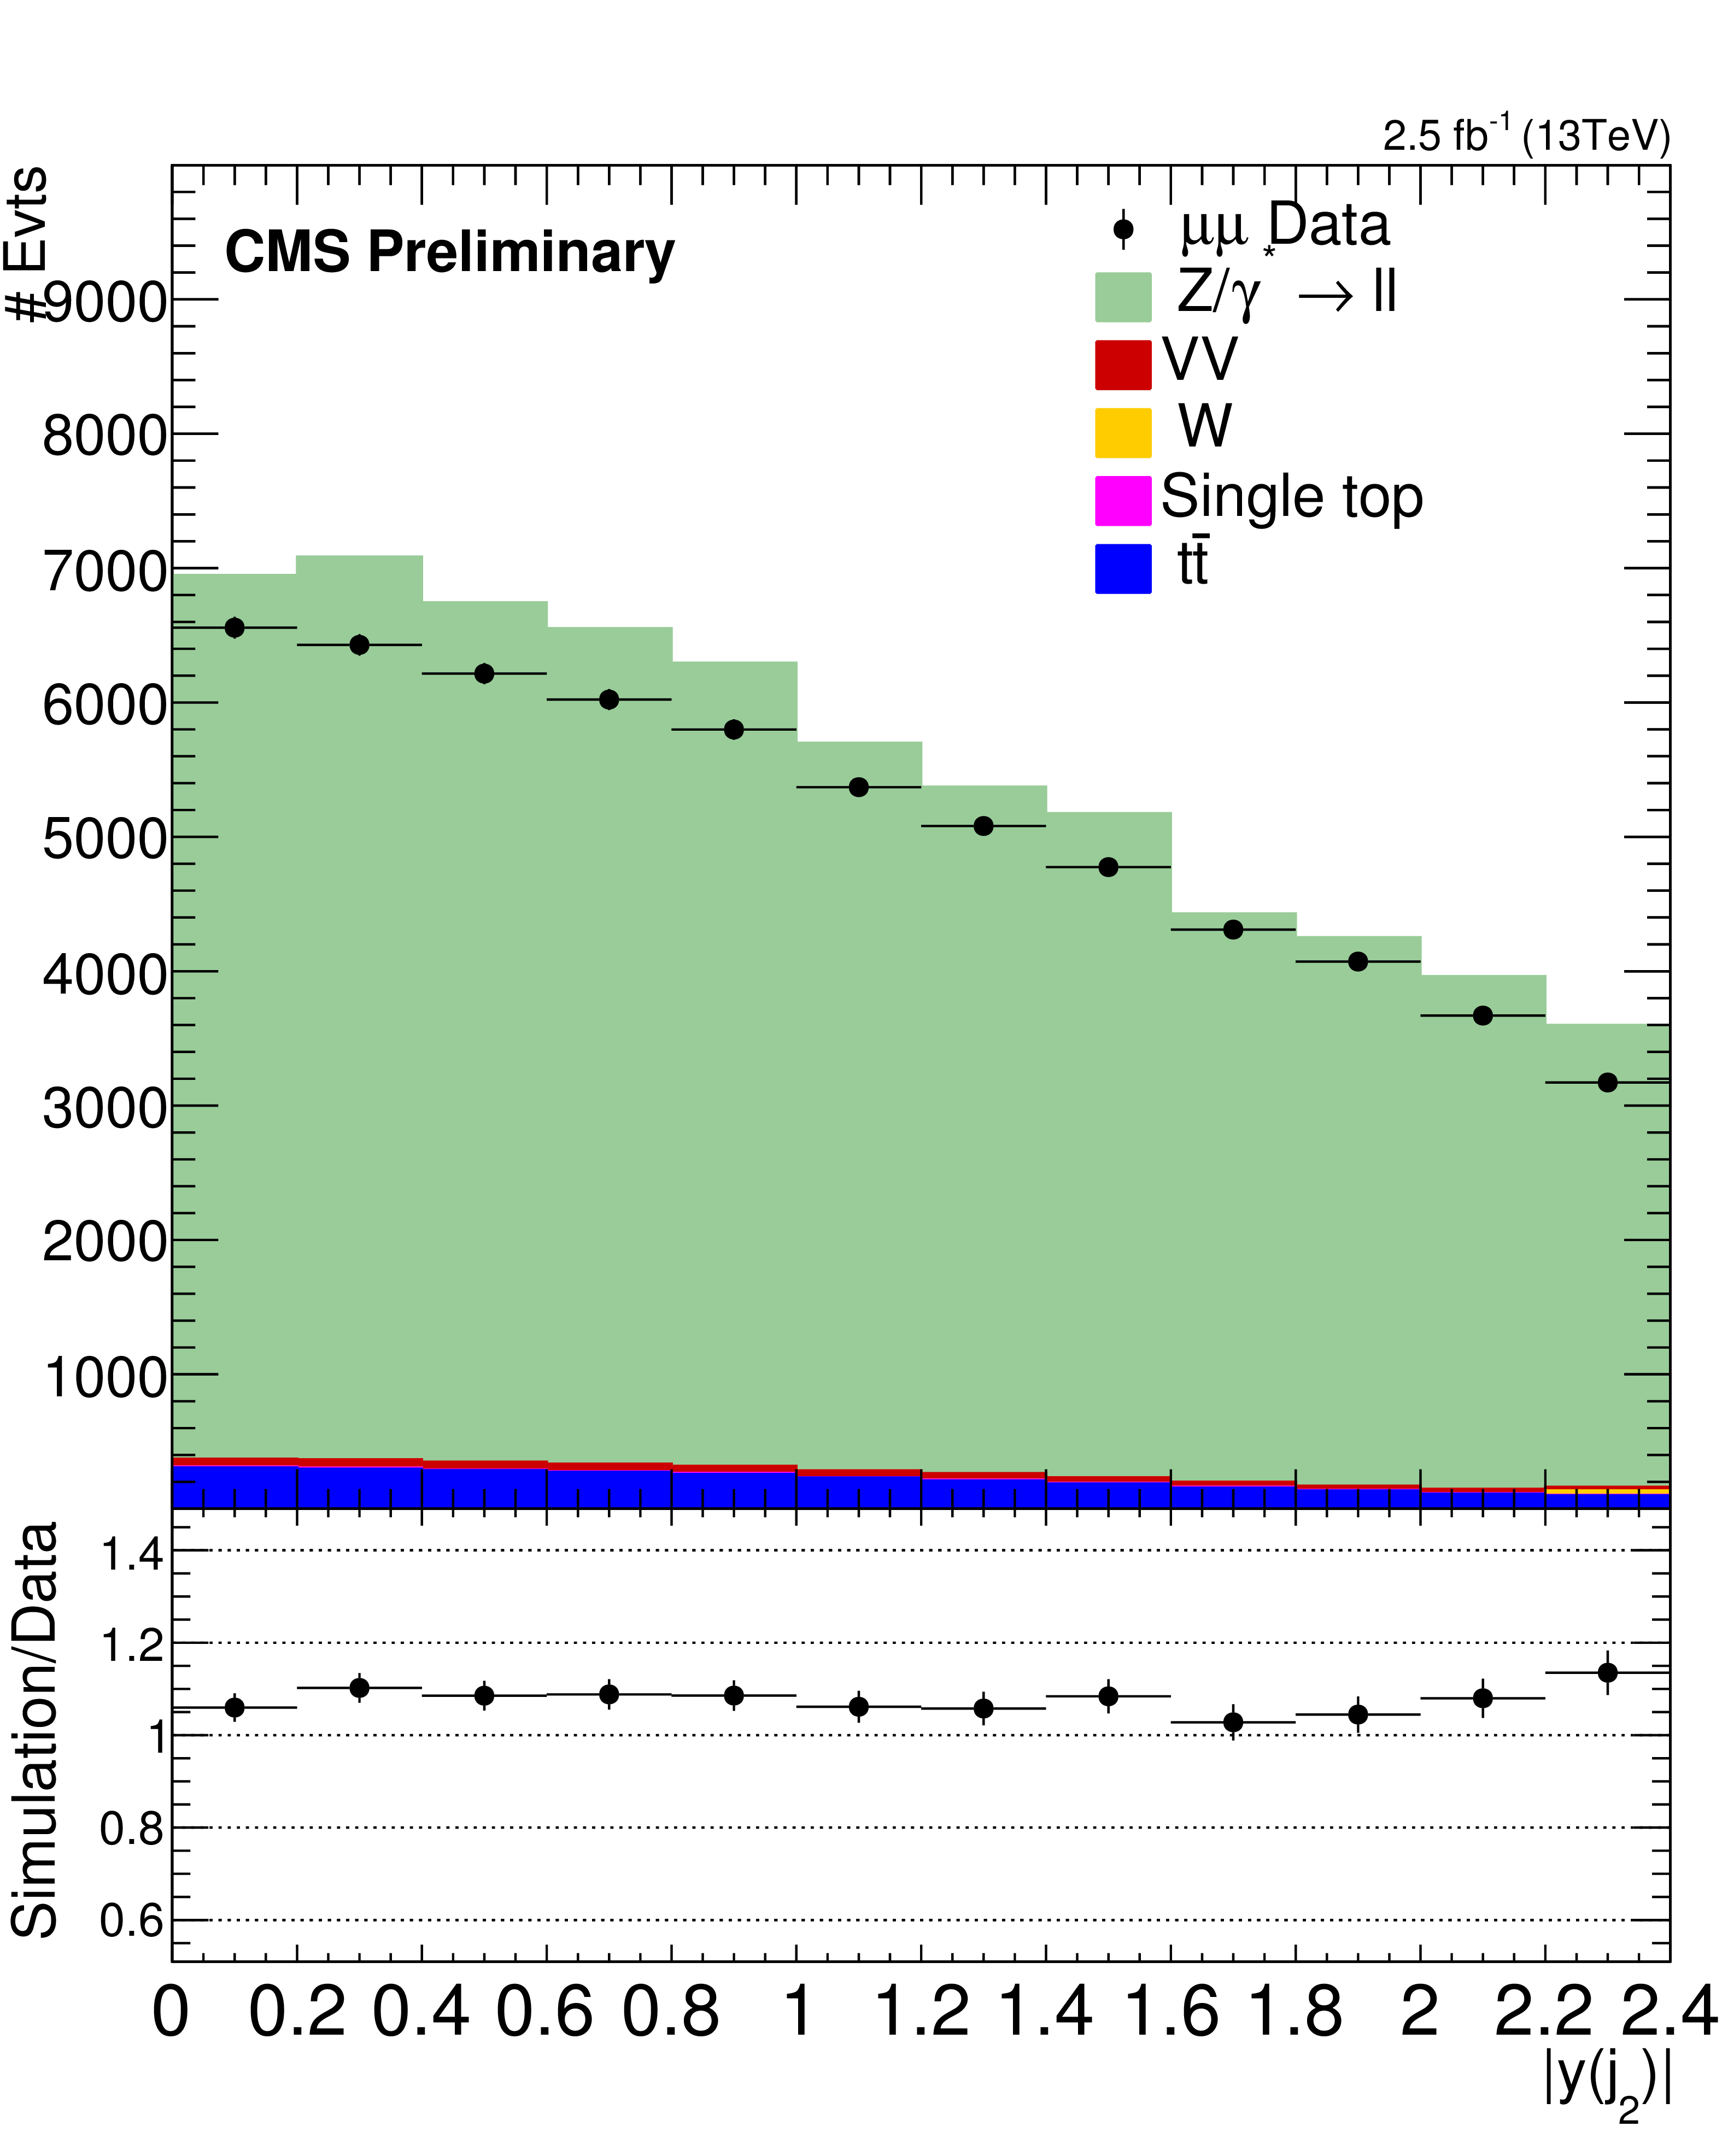
Figure 6-b:
Reconstructed data and simulated signal and backgrounds distributions of the rapidity of the two highest $ {p_{\mathrm {T}}} $ jets. The error bars on the data points correspond to the statistical errors (in the case of the ratio plots, they correspond to the statistical errors coming from both the data and the simulation). |
png pdf |
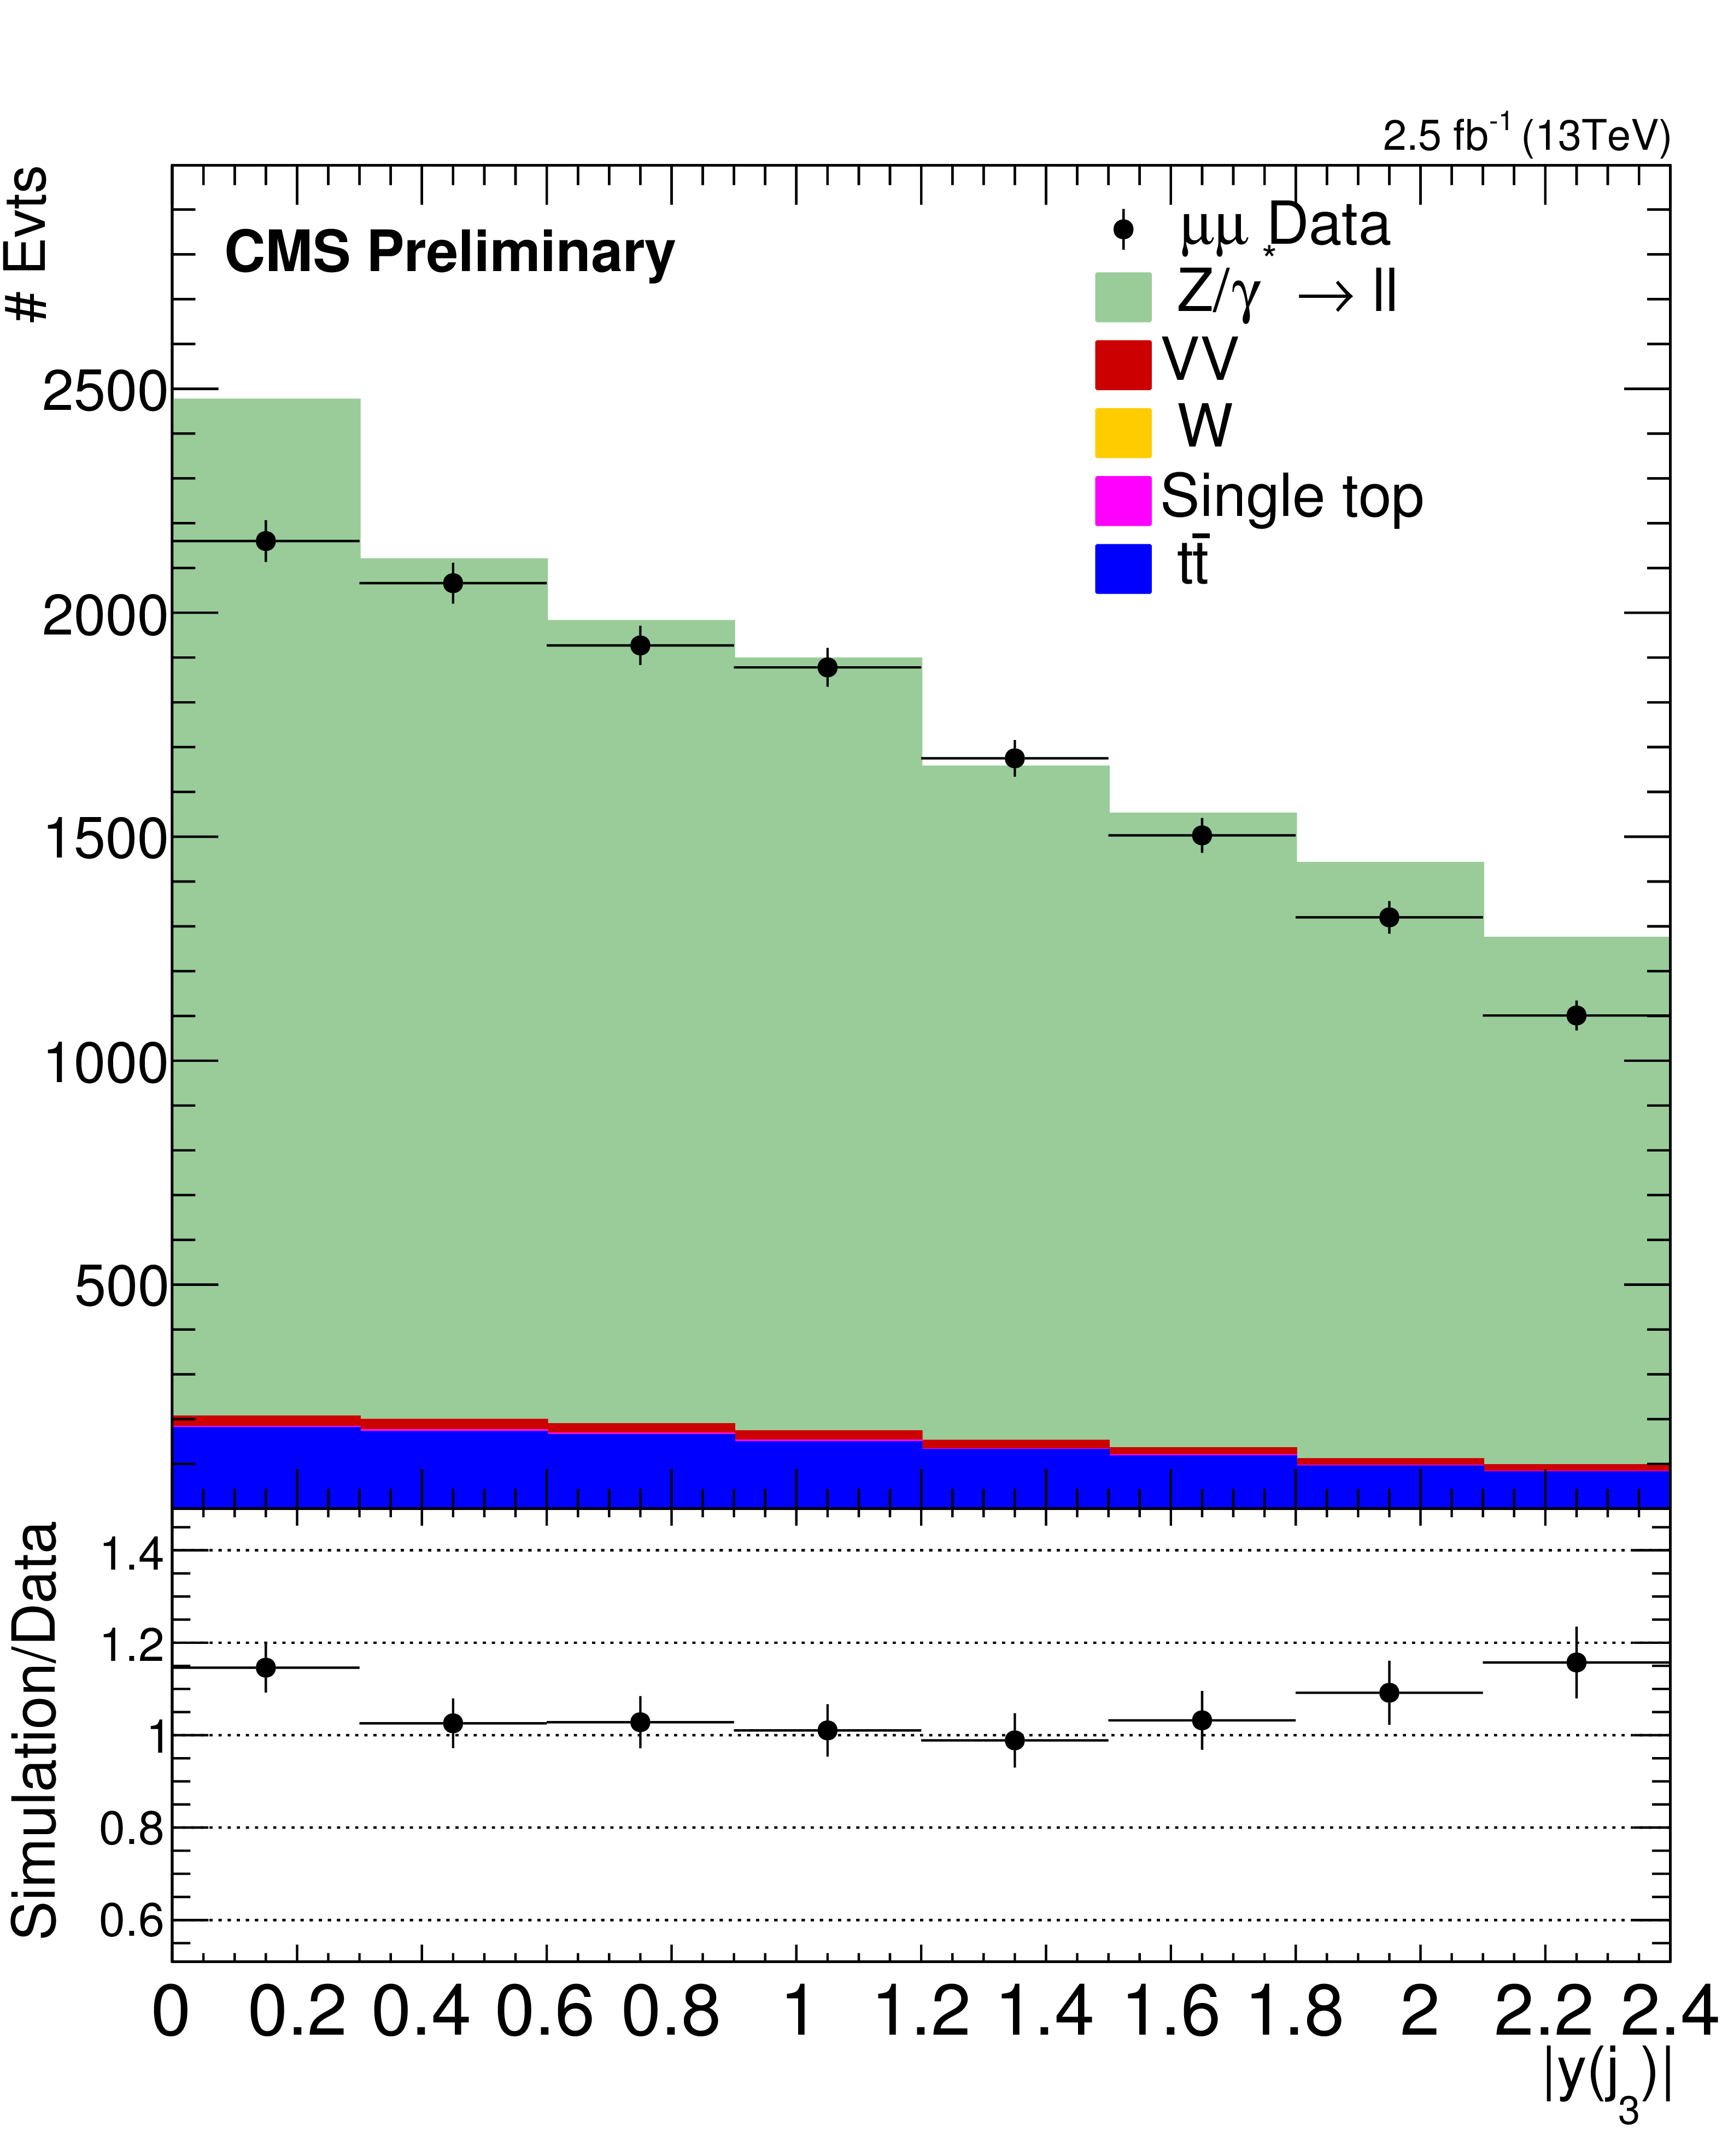
Figure 7:
Reconstructed data and simulated signal and backgrounds distributions of the rapidity of the third highest $ {p_{\mathrm {T}}} $ jet. The error bars on the data points correspond to the statistical errors (in the case of the ratio plots, they correspond to the statistical errors coming from both the data and the simulation). |
png pdf |
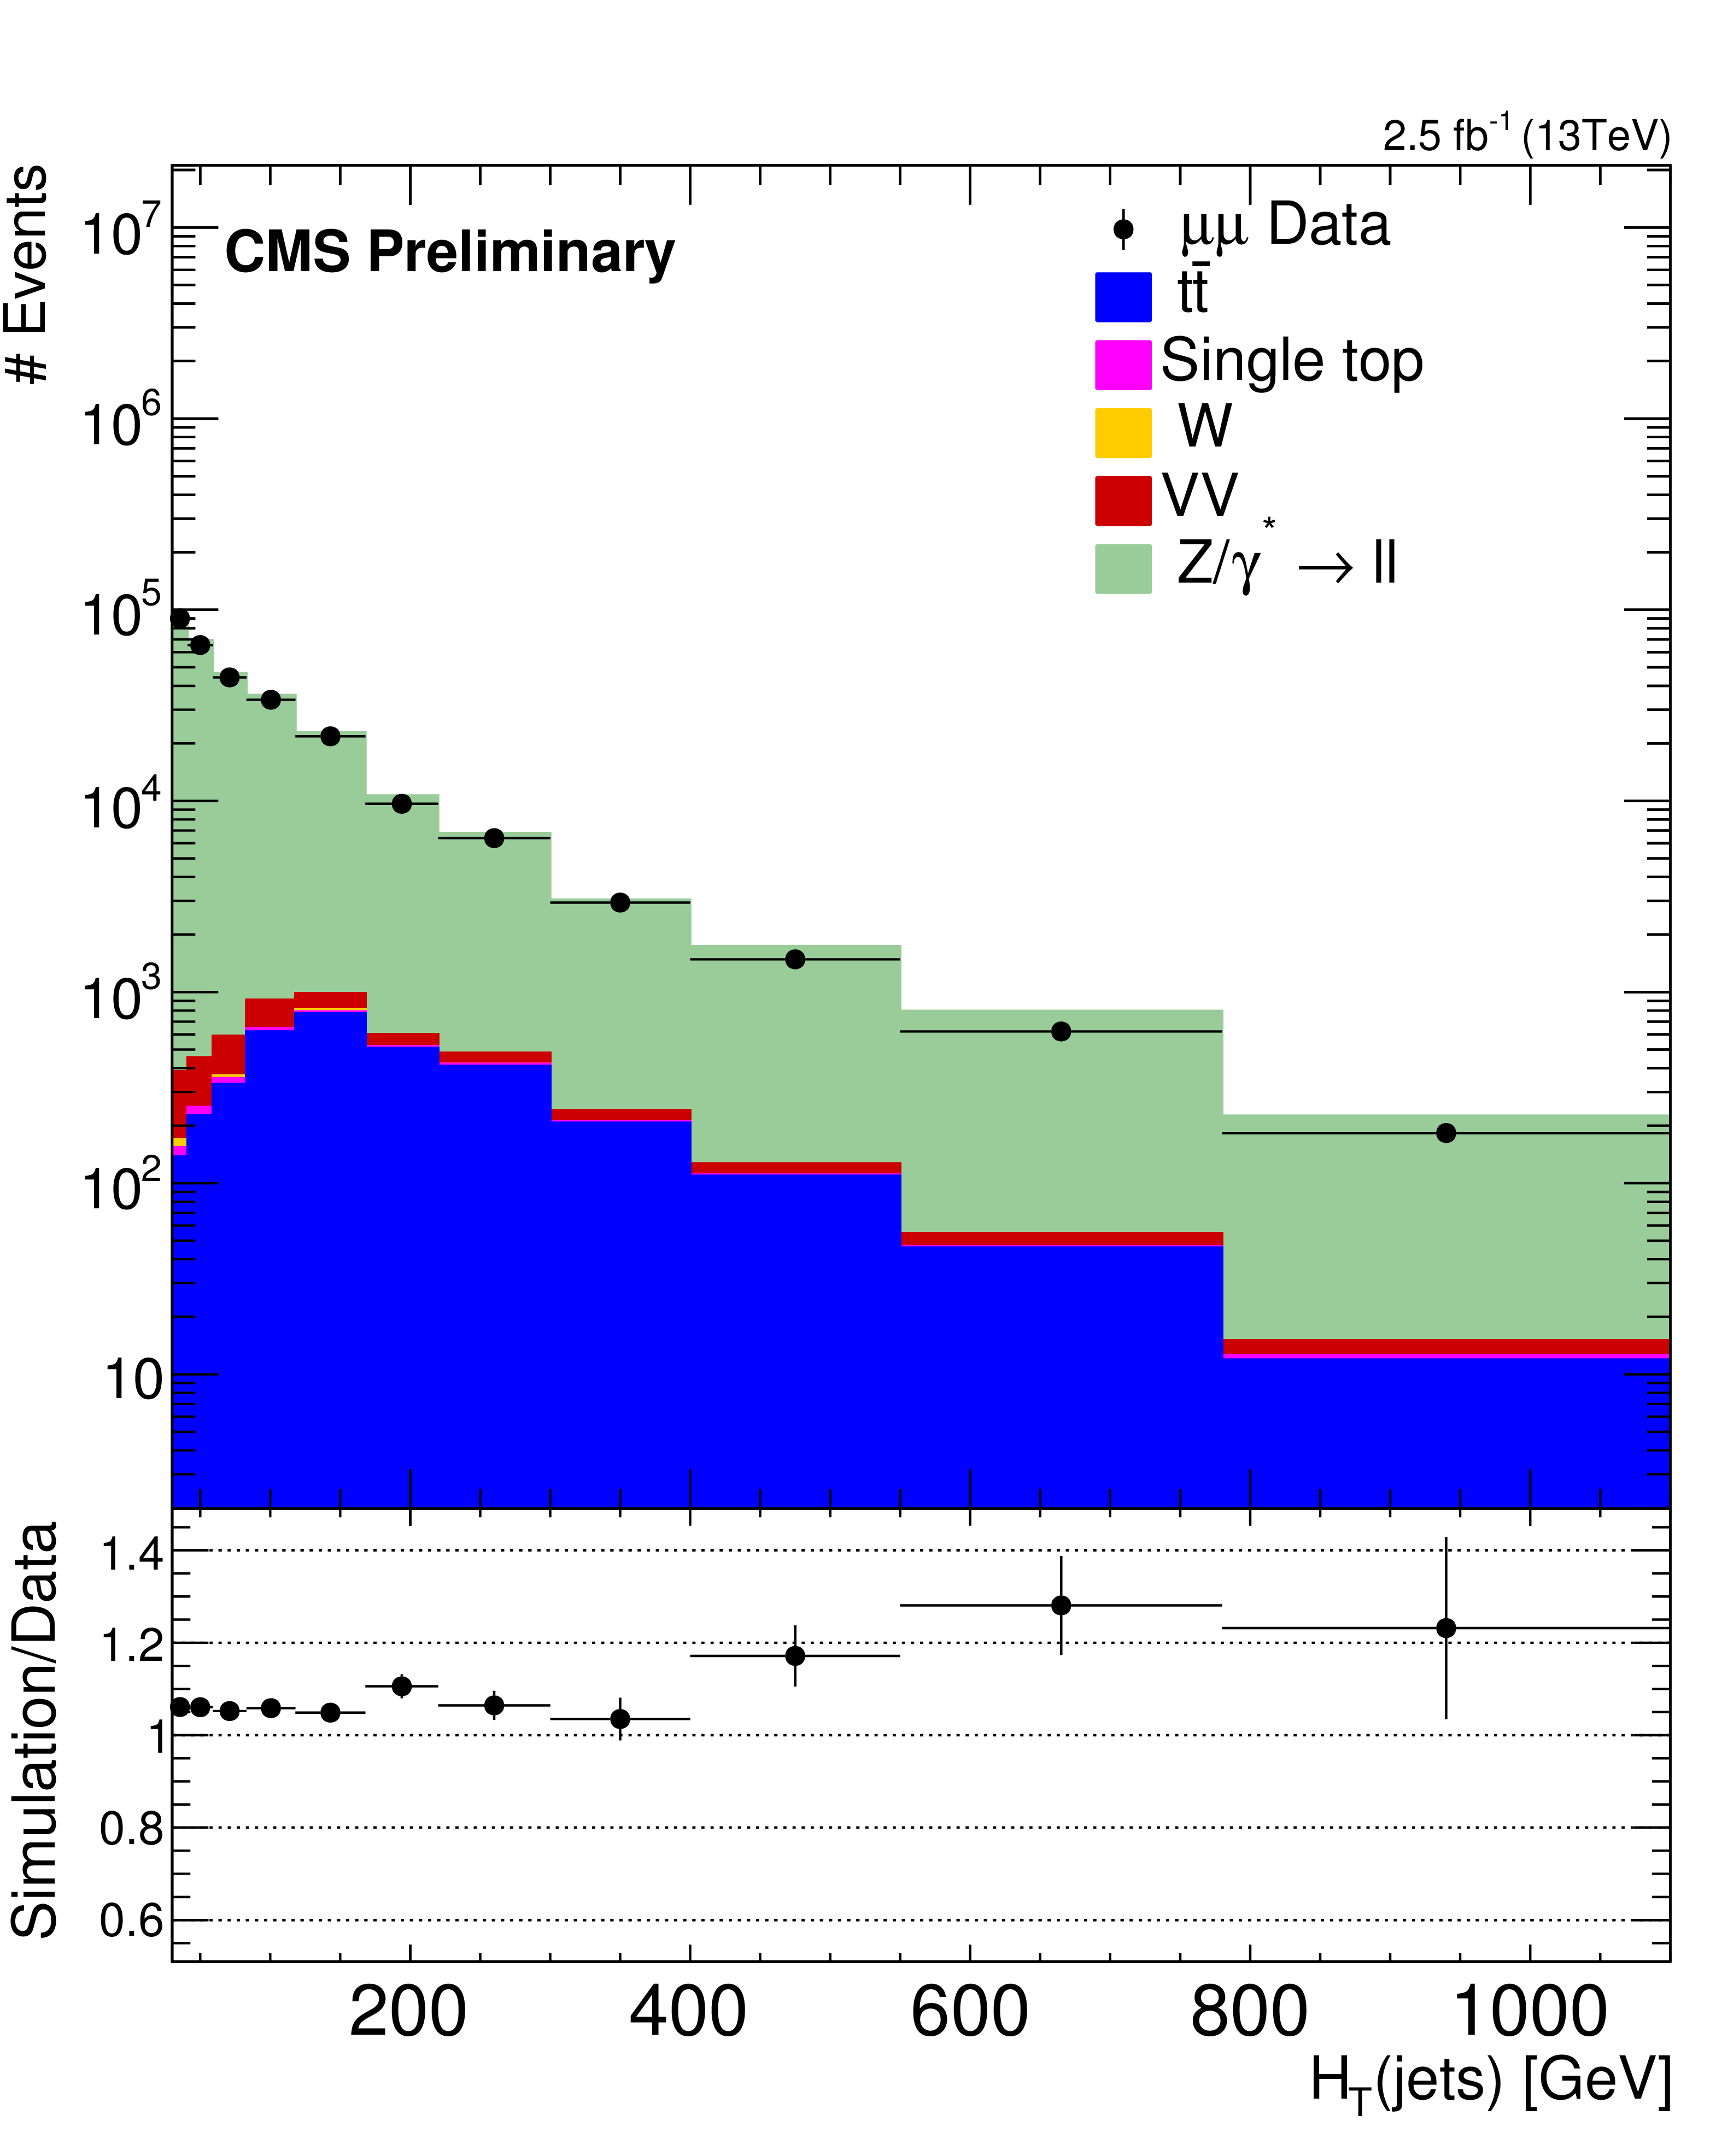
Figure 8-a:
Data to simulation comparison of $ H_{\mathrm{T}} $ of the jets for inclusive jet multiplicities of one and two. The error bars on the data points correspond to the statistical errors (in the case of the ratio plots, they correspond to the statistical errors coming from both the data and the simulation). |
png pdf |
Figure 8-b:
Data to simulation comparison of $ H_{\mathrm{T}} $ of the jets for inclusive jet multiplicities of one and two. The error bars on the data points correspond to the statistical errors (in the case of the ratio plots, they correspond to the statistical errors coming from both the data and the simulation). |

png pdf |
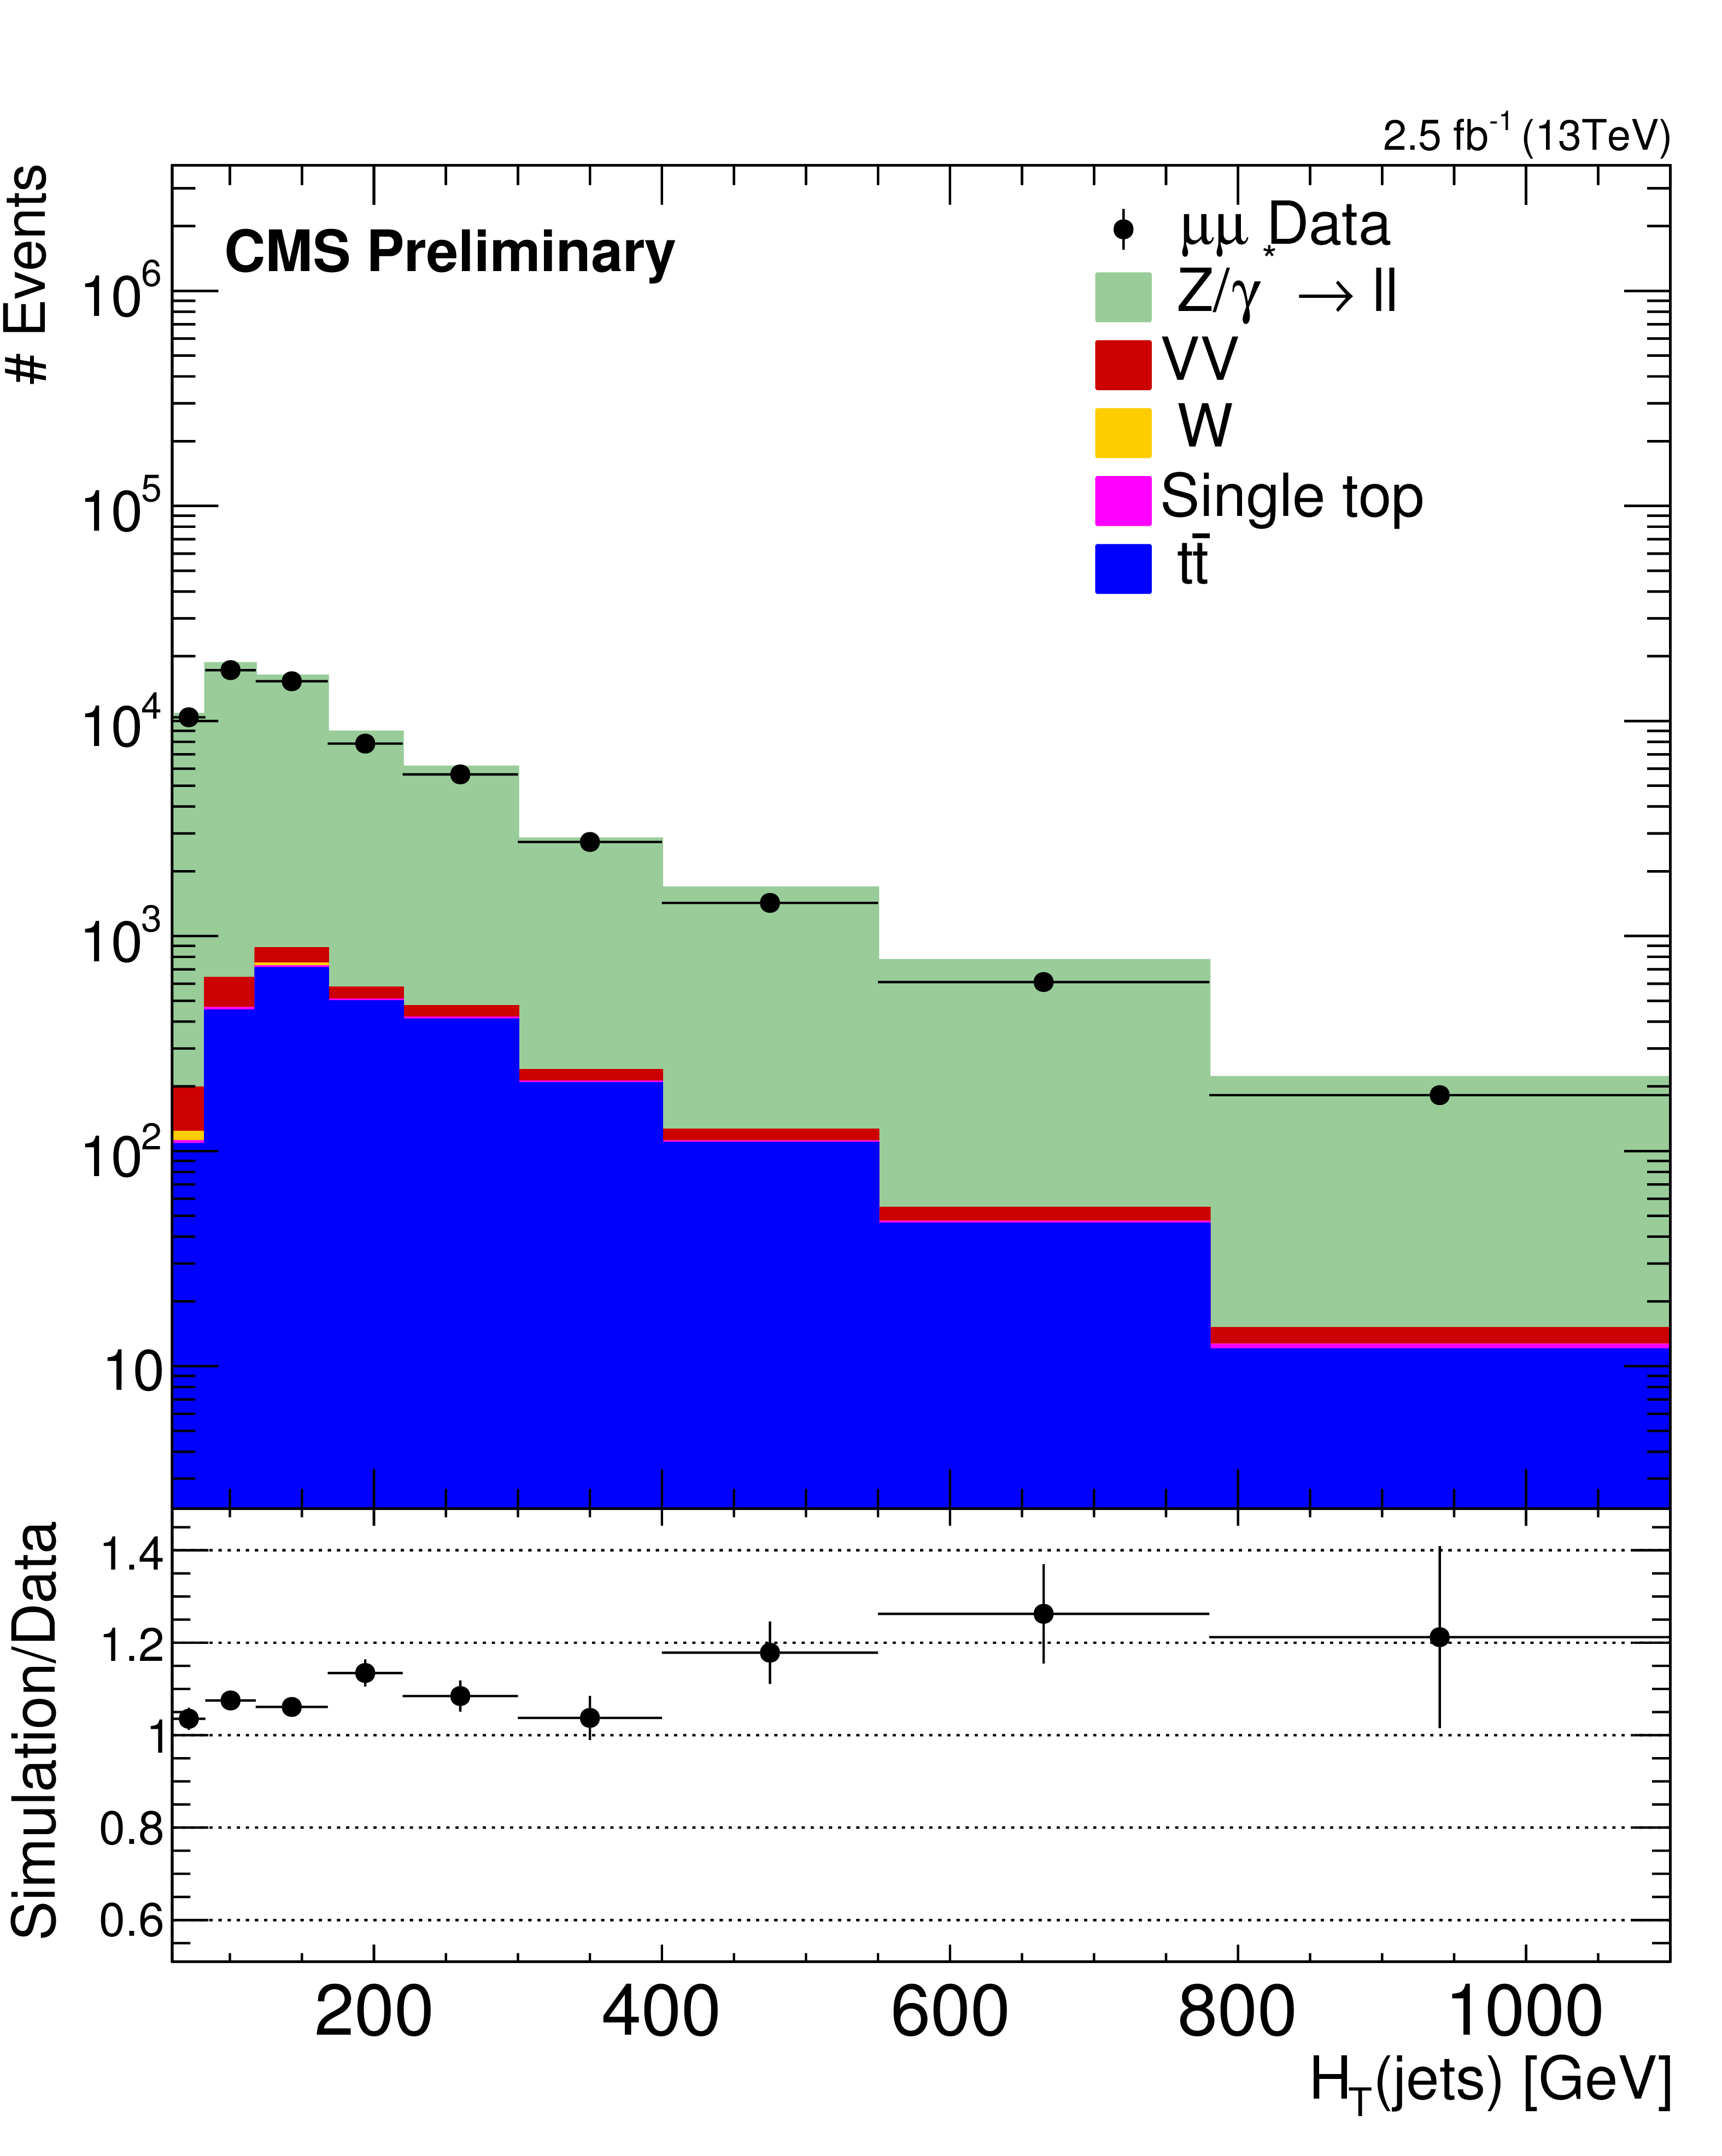
Figure 9:
Data to simulation comparison of $ H_{\mathrm{T}} $ of the jets for inclusive jet multiplicities of three. The error bars on the data points correspond to the statistical errors (in the case of the ratio plots, they correspond to the statistical errors coming from both the data and the simulation). |
png pdf |
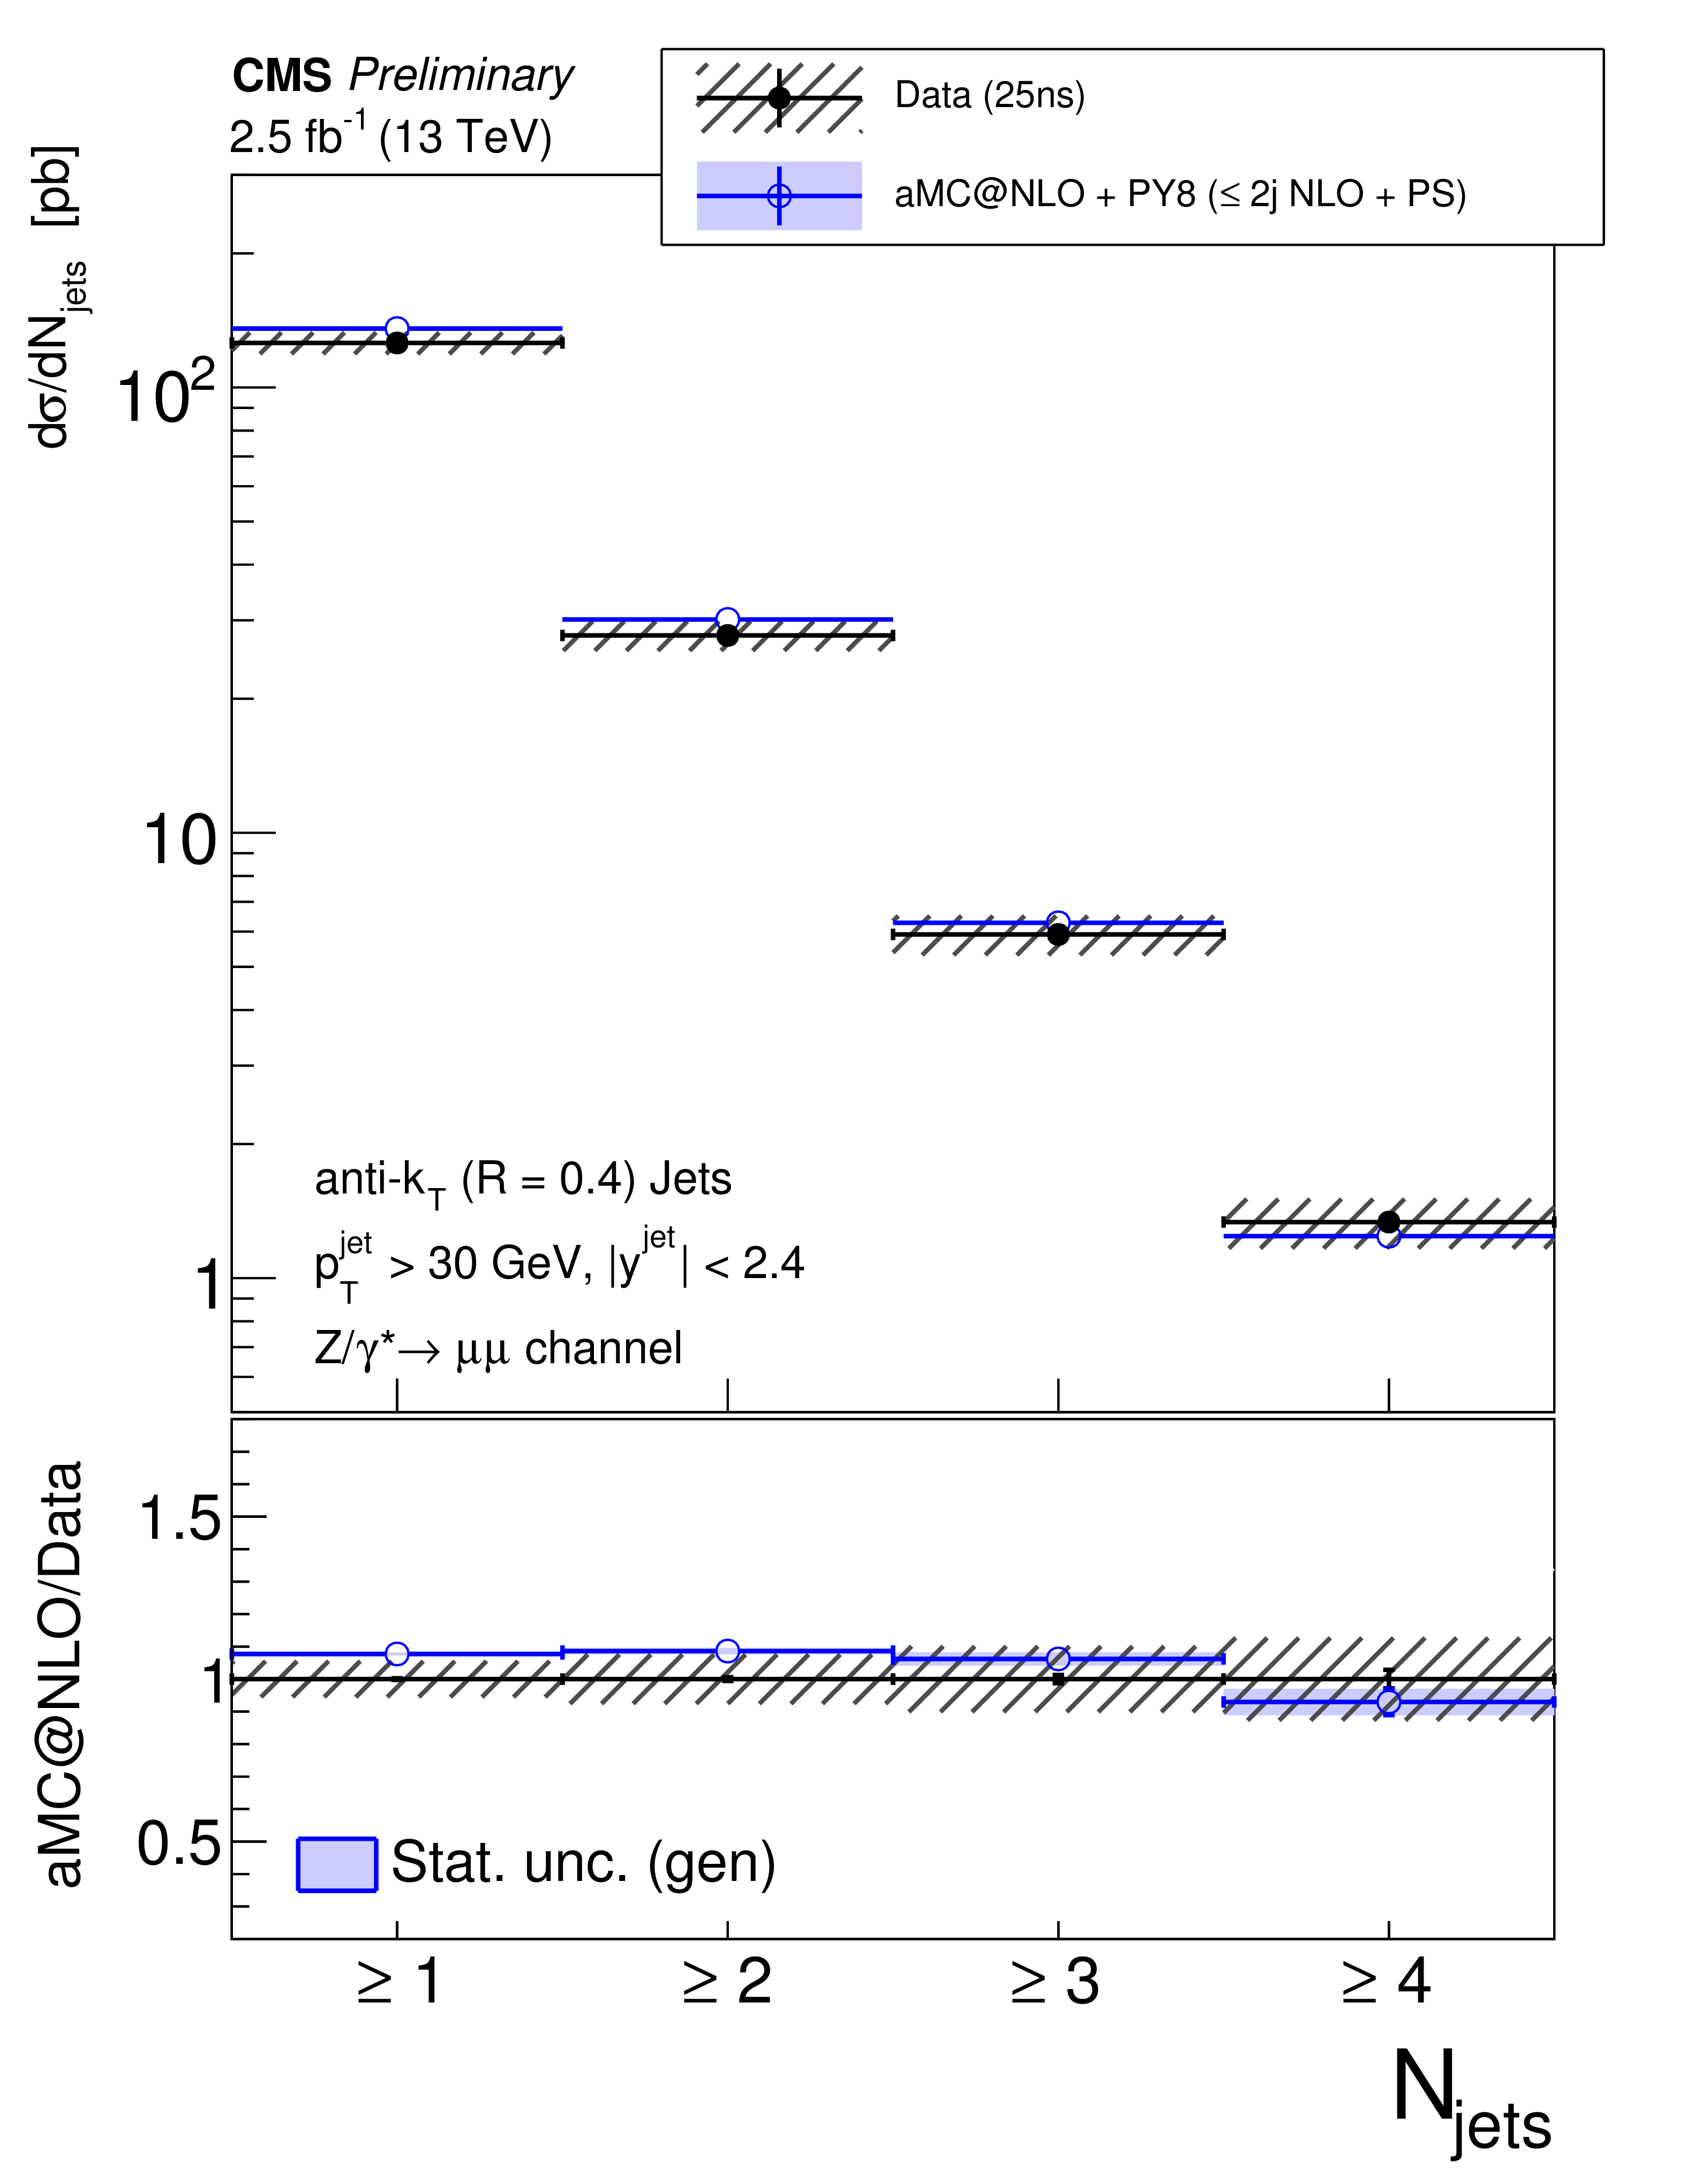
Figure 10-a:
Measured cross section as a function of (a) the jets inclusive and (b) exclusive multiplicity. The error bar represents the statistical uncertainty and the grey hatched band represents the total uncertainty including systematic and statistical uncertainties. |
png pdf |
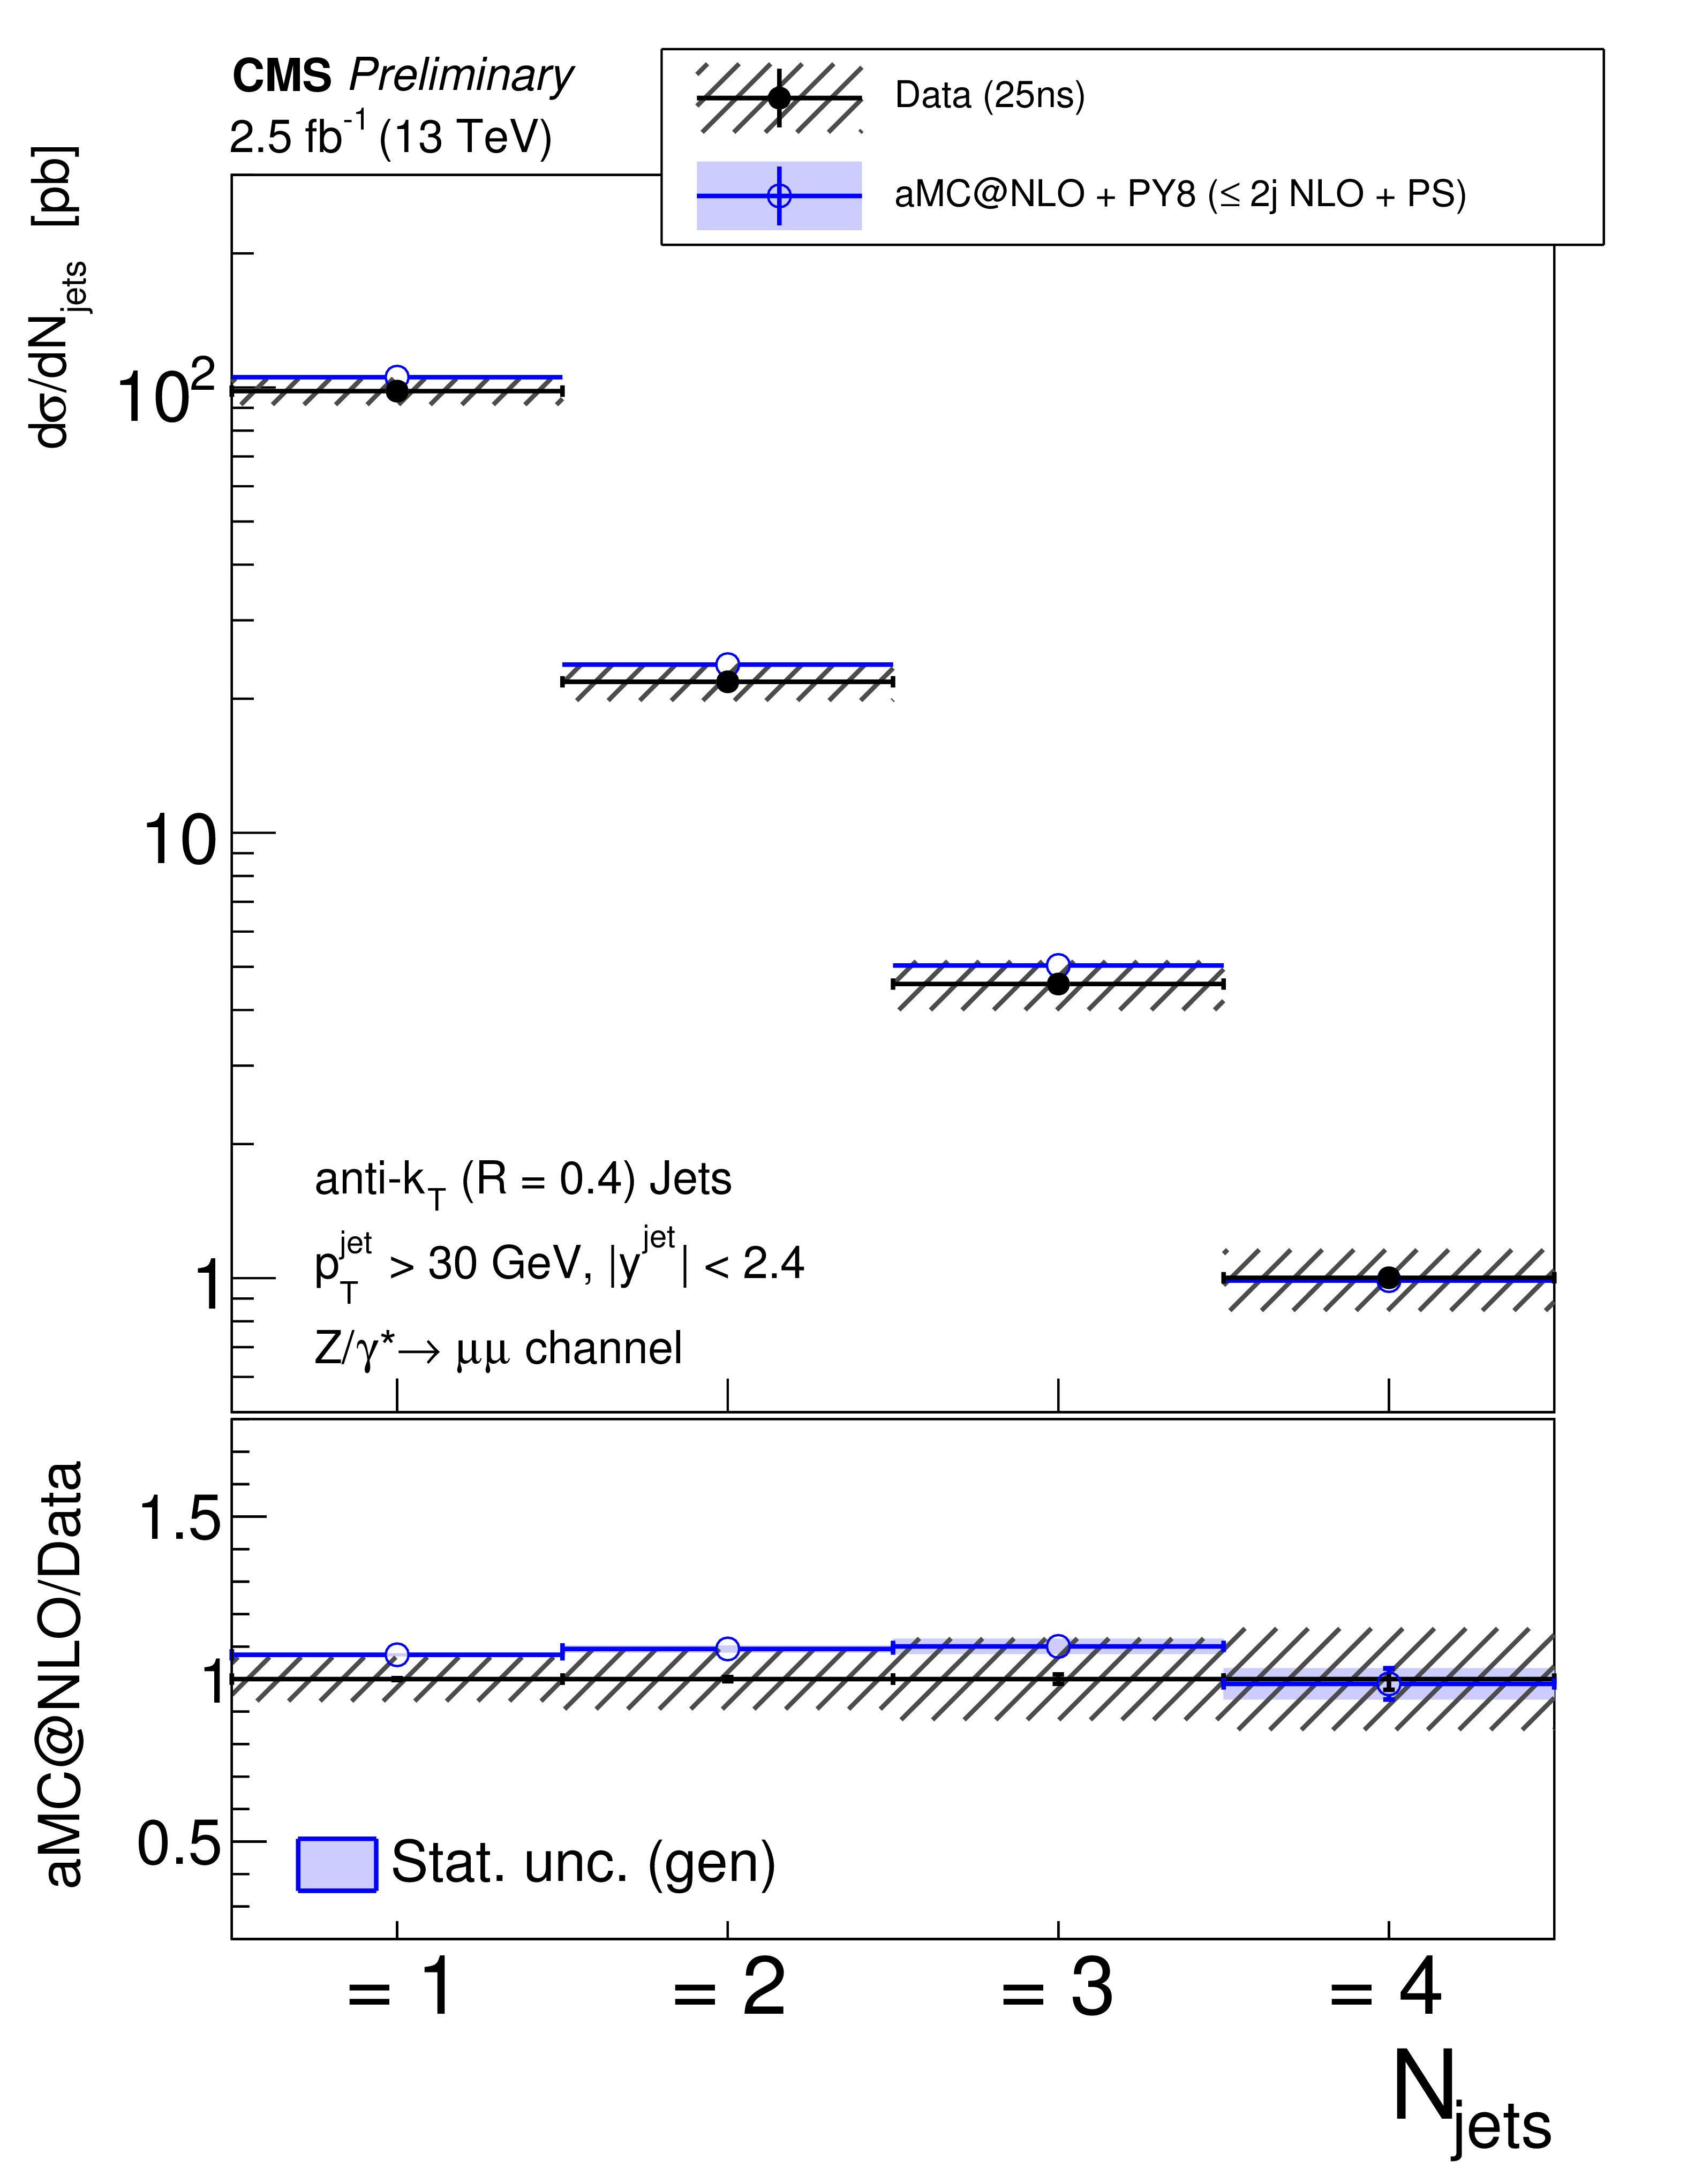
Figure 10-b:
Measured cross section as a function of (a) the jets inclusive and (b) exclusive multiplicity. The error bar represents the statistical uncertainty and the grey hatched band represents the total uncertainty including systematic and statistical uncertainties. |

png pdf |
Figure 11-a:
Measured cross section as a function of the $ {p_{\mathrm {T}}} $ of (a) the first and (b) the second jets. The error bar represents the statistical uncertainty and the grey hatched band represents the total uncertainty including systematic and statistical uncertainties. |

png pdf |
Figure 11-b:
Measured cross section as a function of the $ {p_{\mathrm {T}}} $ of (a) the first and (b) the second jets. The error bar represents the statistical uncertainty and the grey hatched band represents the total uncertainty including systematic and statistical uncertainties. |
png pdf |
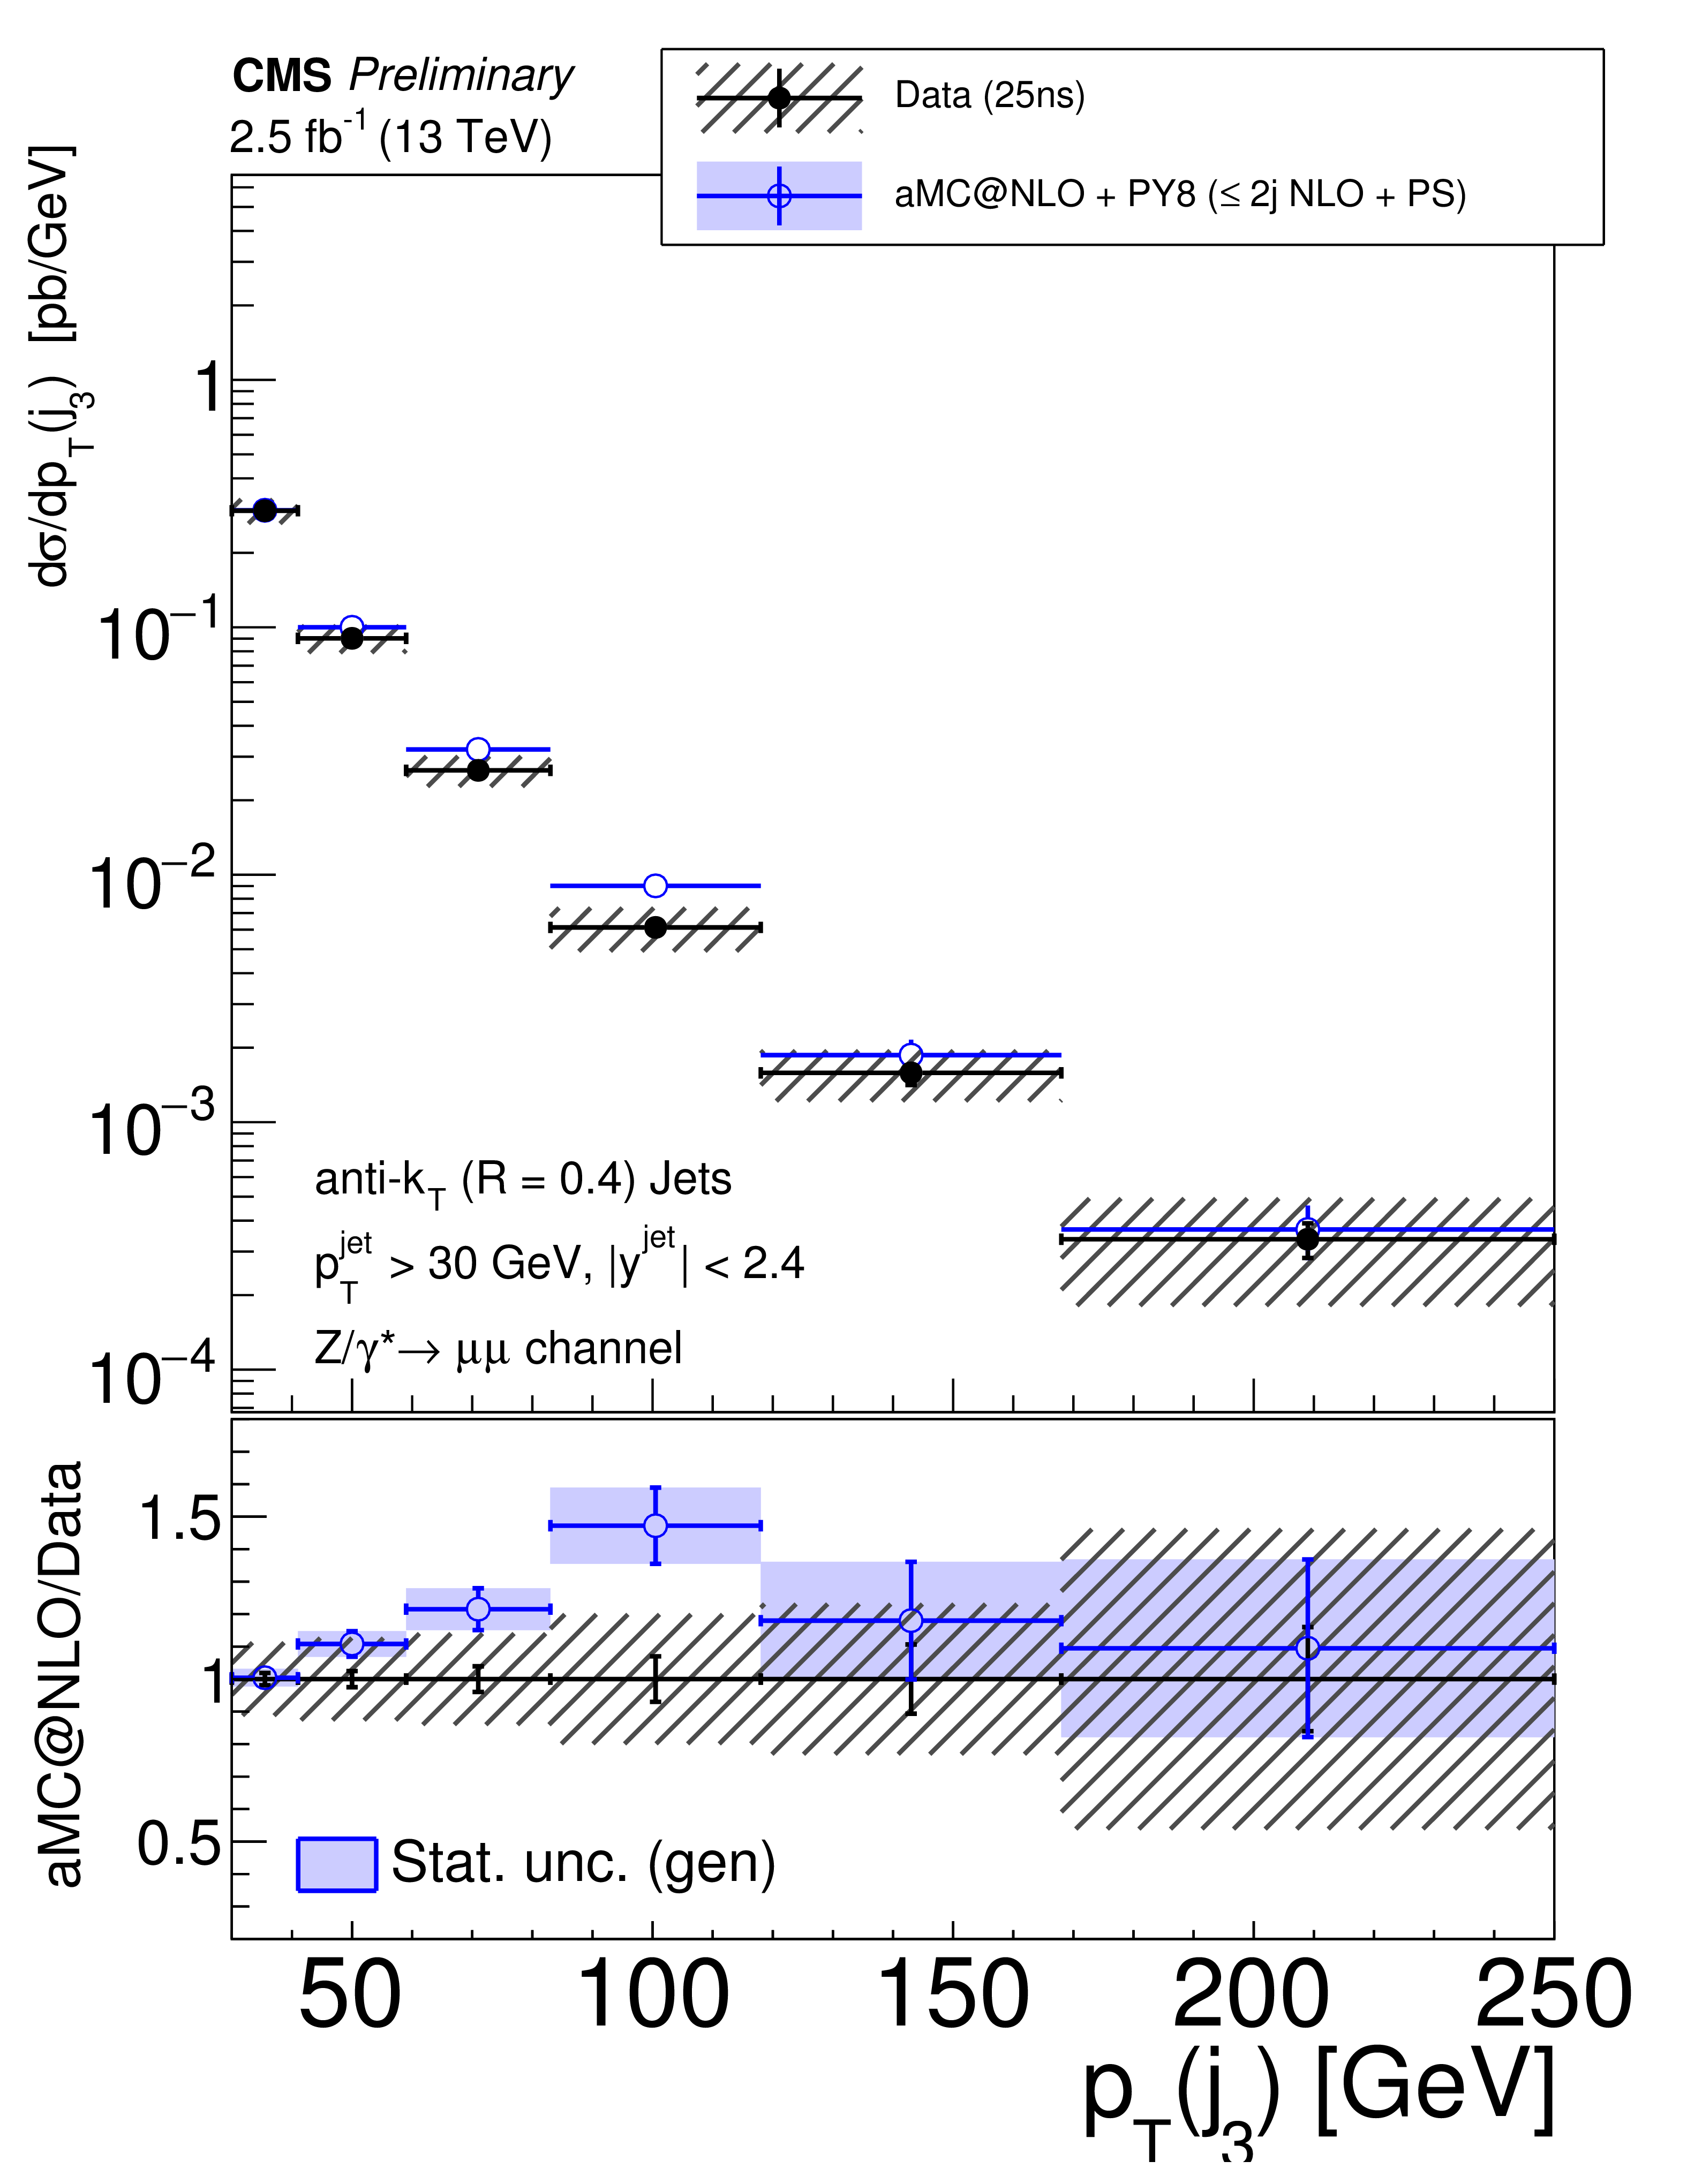
Figure 12:
Measured cross section as a function of the $ {p_{\mathrm {T}}} $ of the third jet. The error bar represents the statistical uncertainty and the grey hatched band represents the total uncertainty including systematic and statistical uncertainties. |
png pdf |
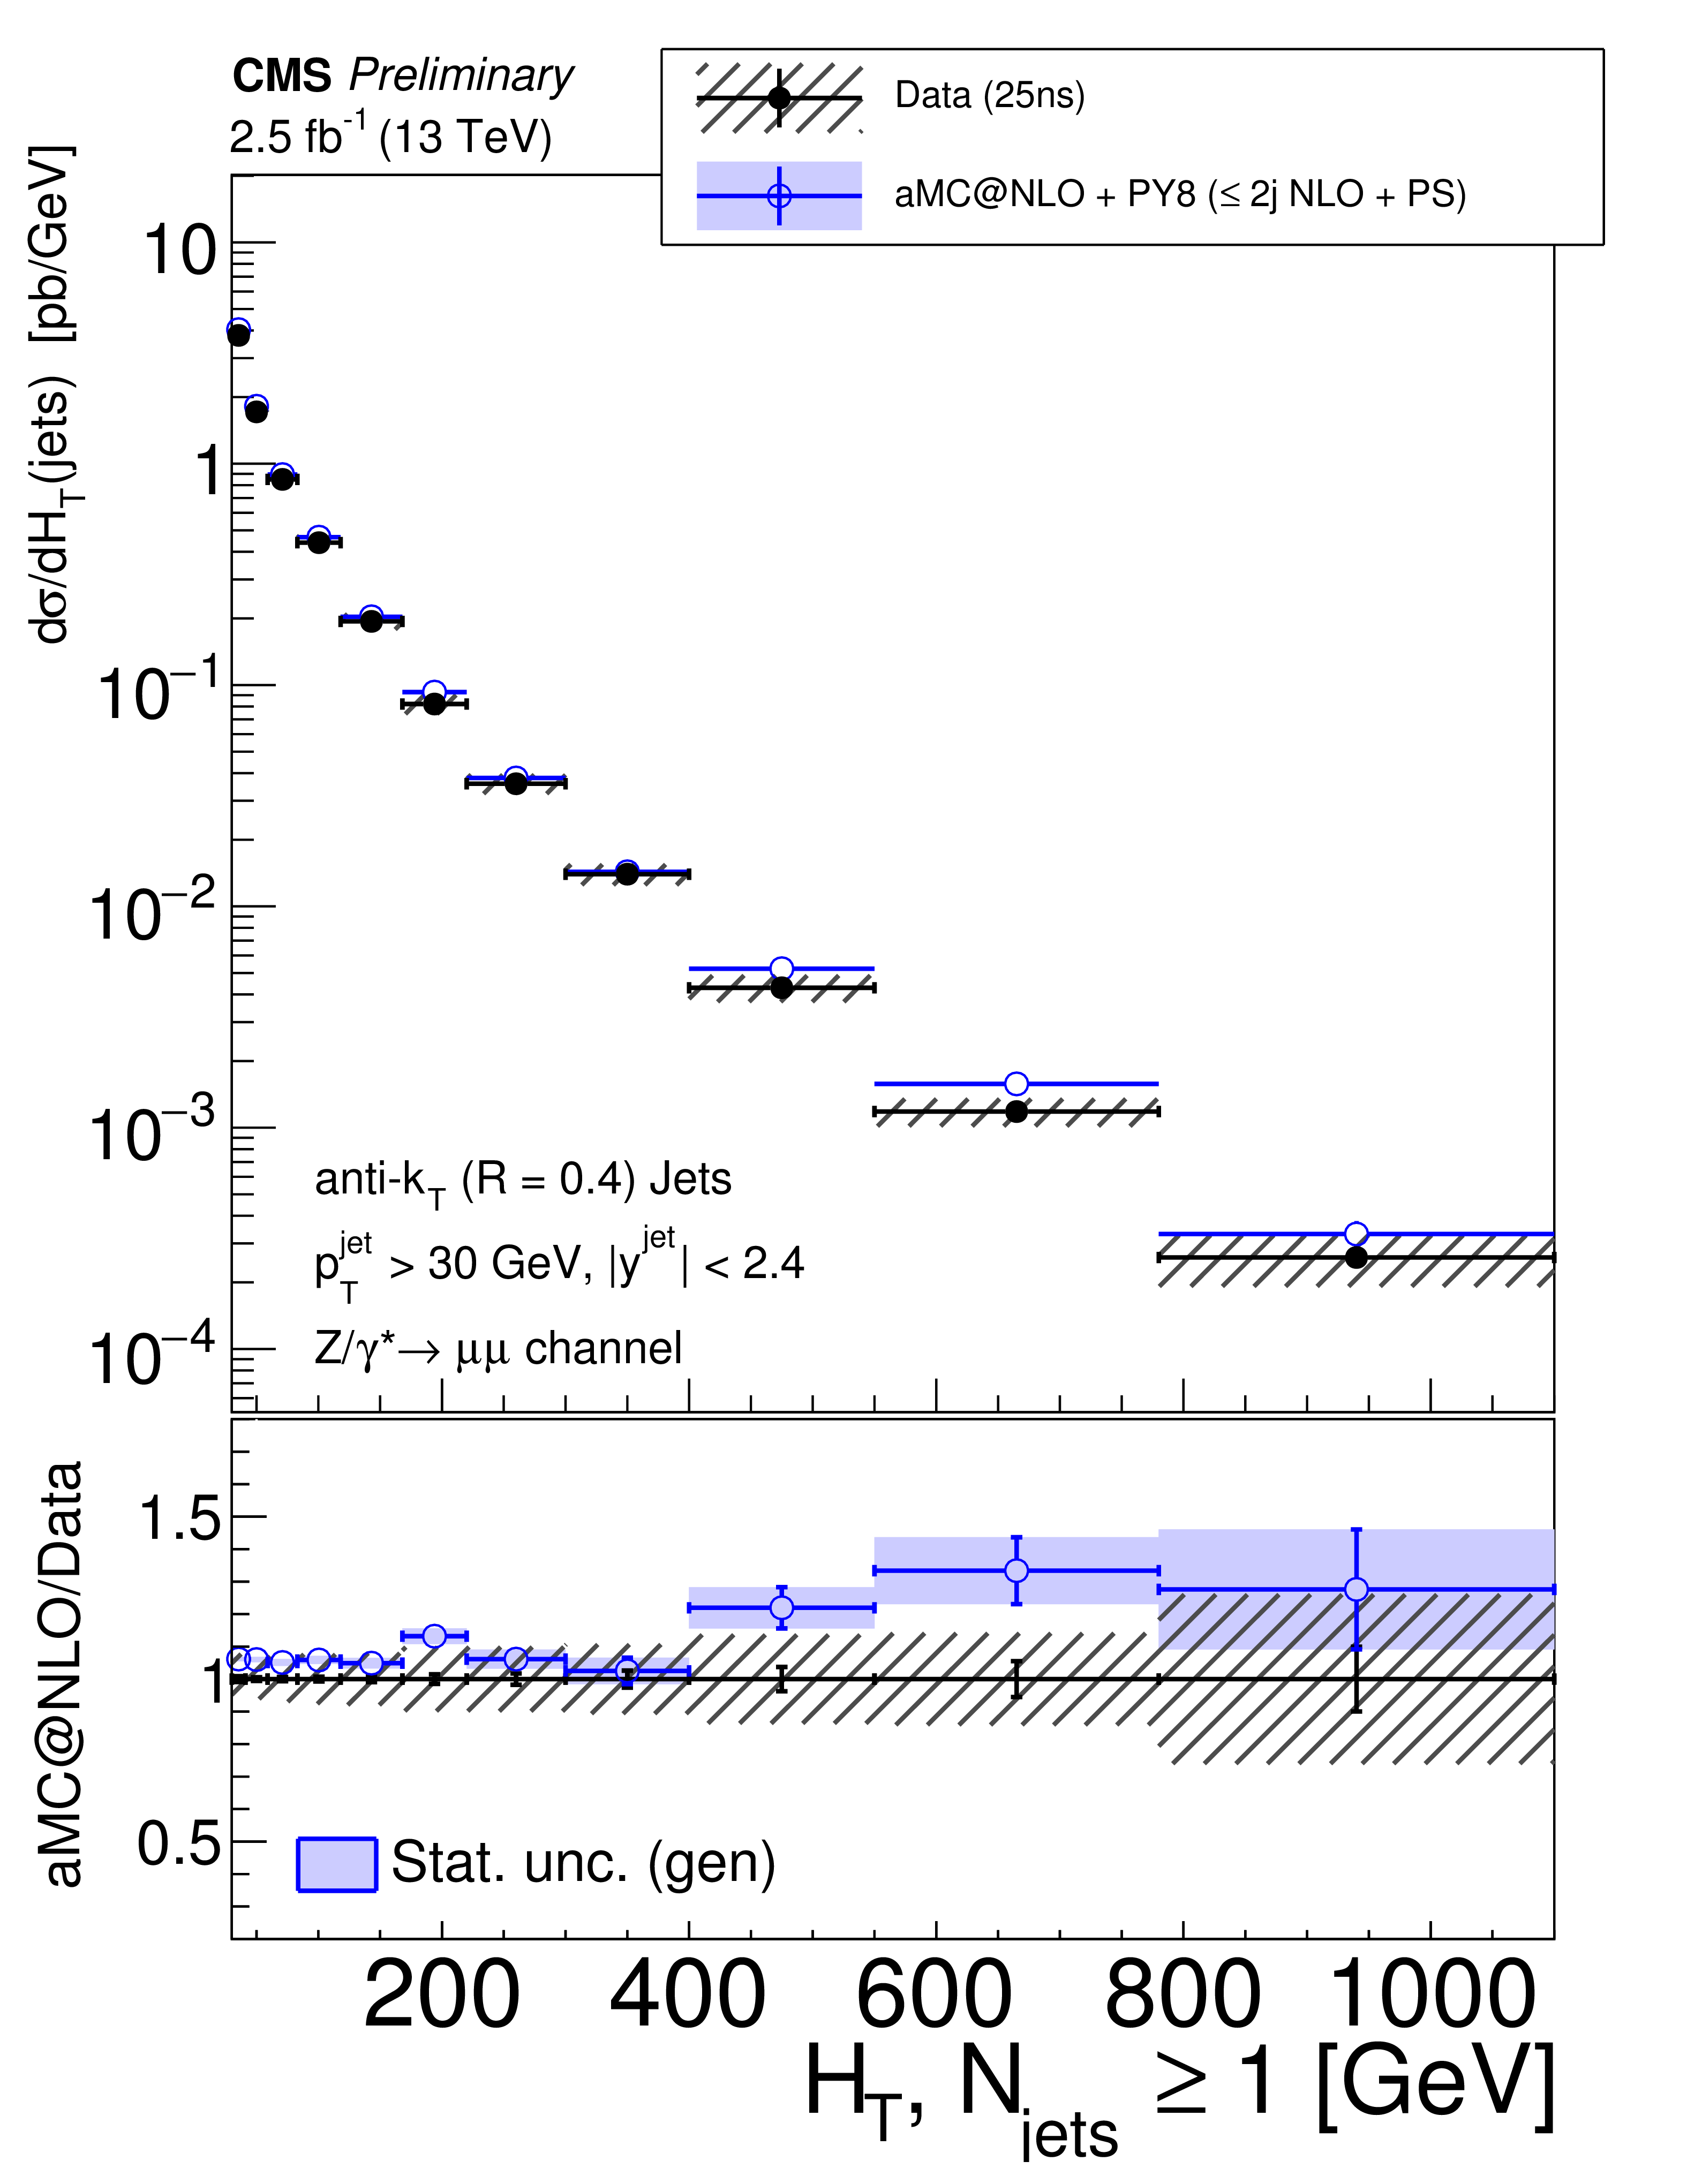
Figure 13-a:
Measured cross section as a function of $ H_{\mathrm{T}} $ for inclusive jet multiplicities of (a) one and (b) two. The error bar represents the statistical uncertainty and the grey hatched band represents the total uncertainty including systematic and statistical uncertainties. |
png pdf |
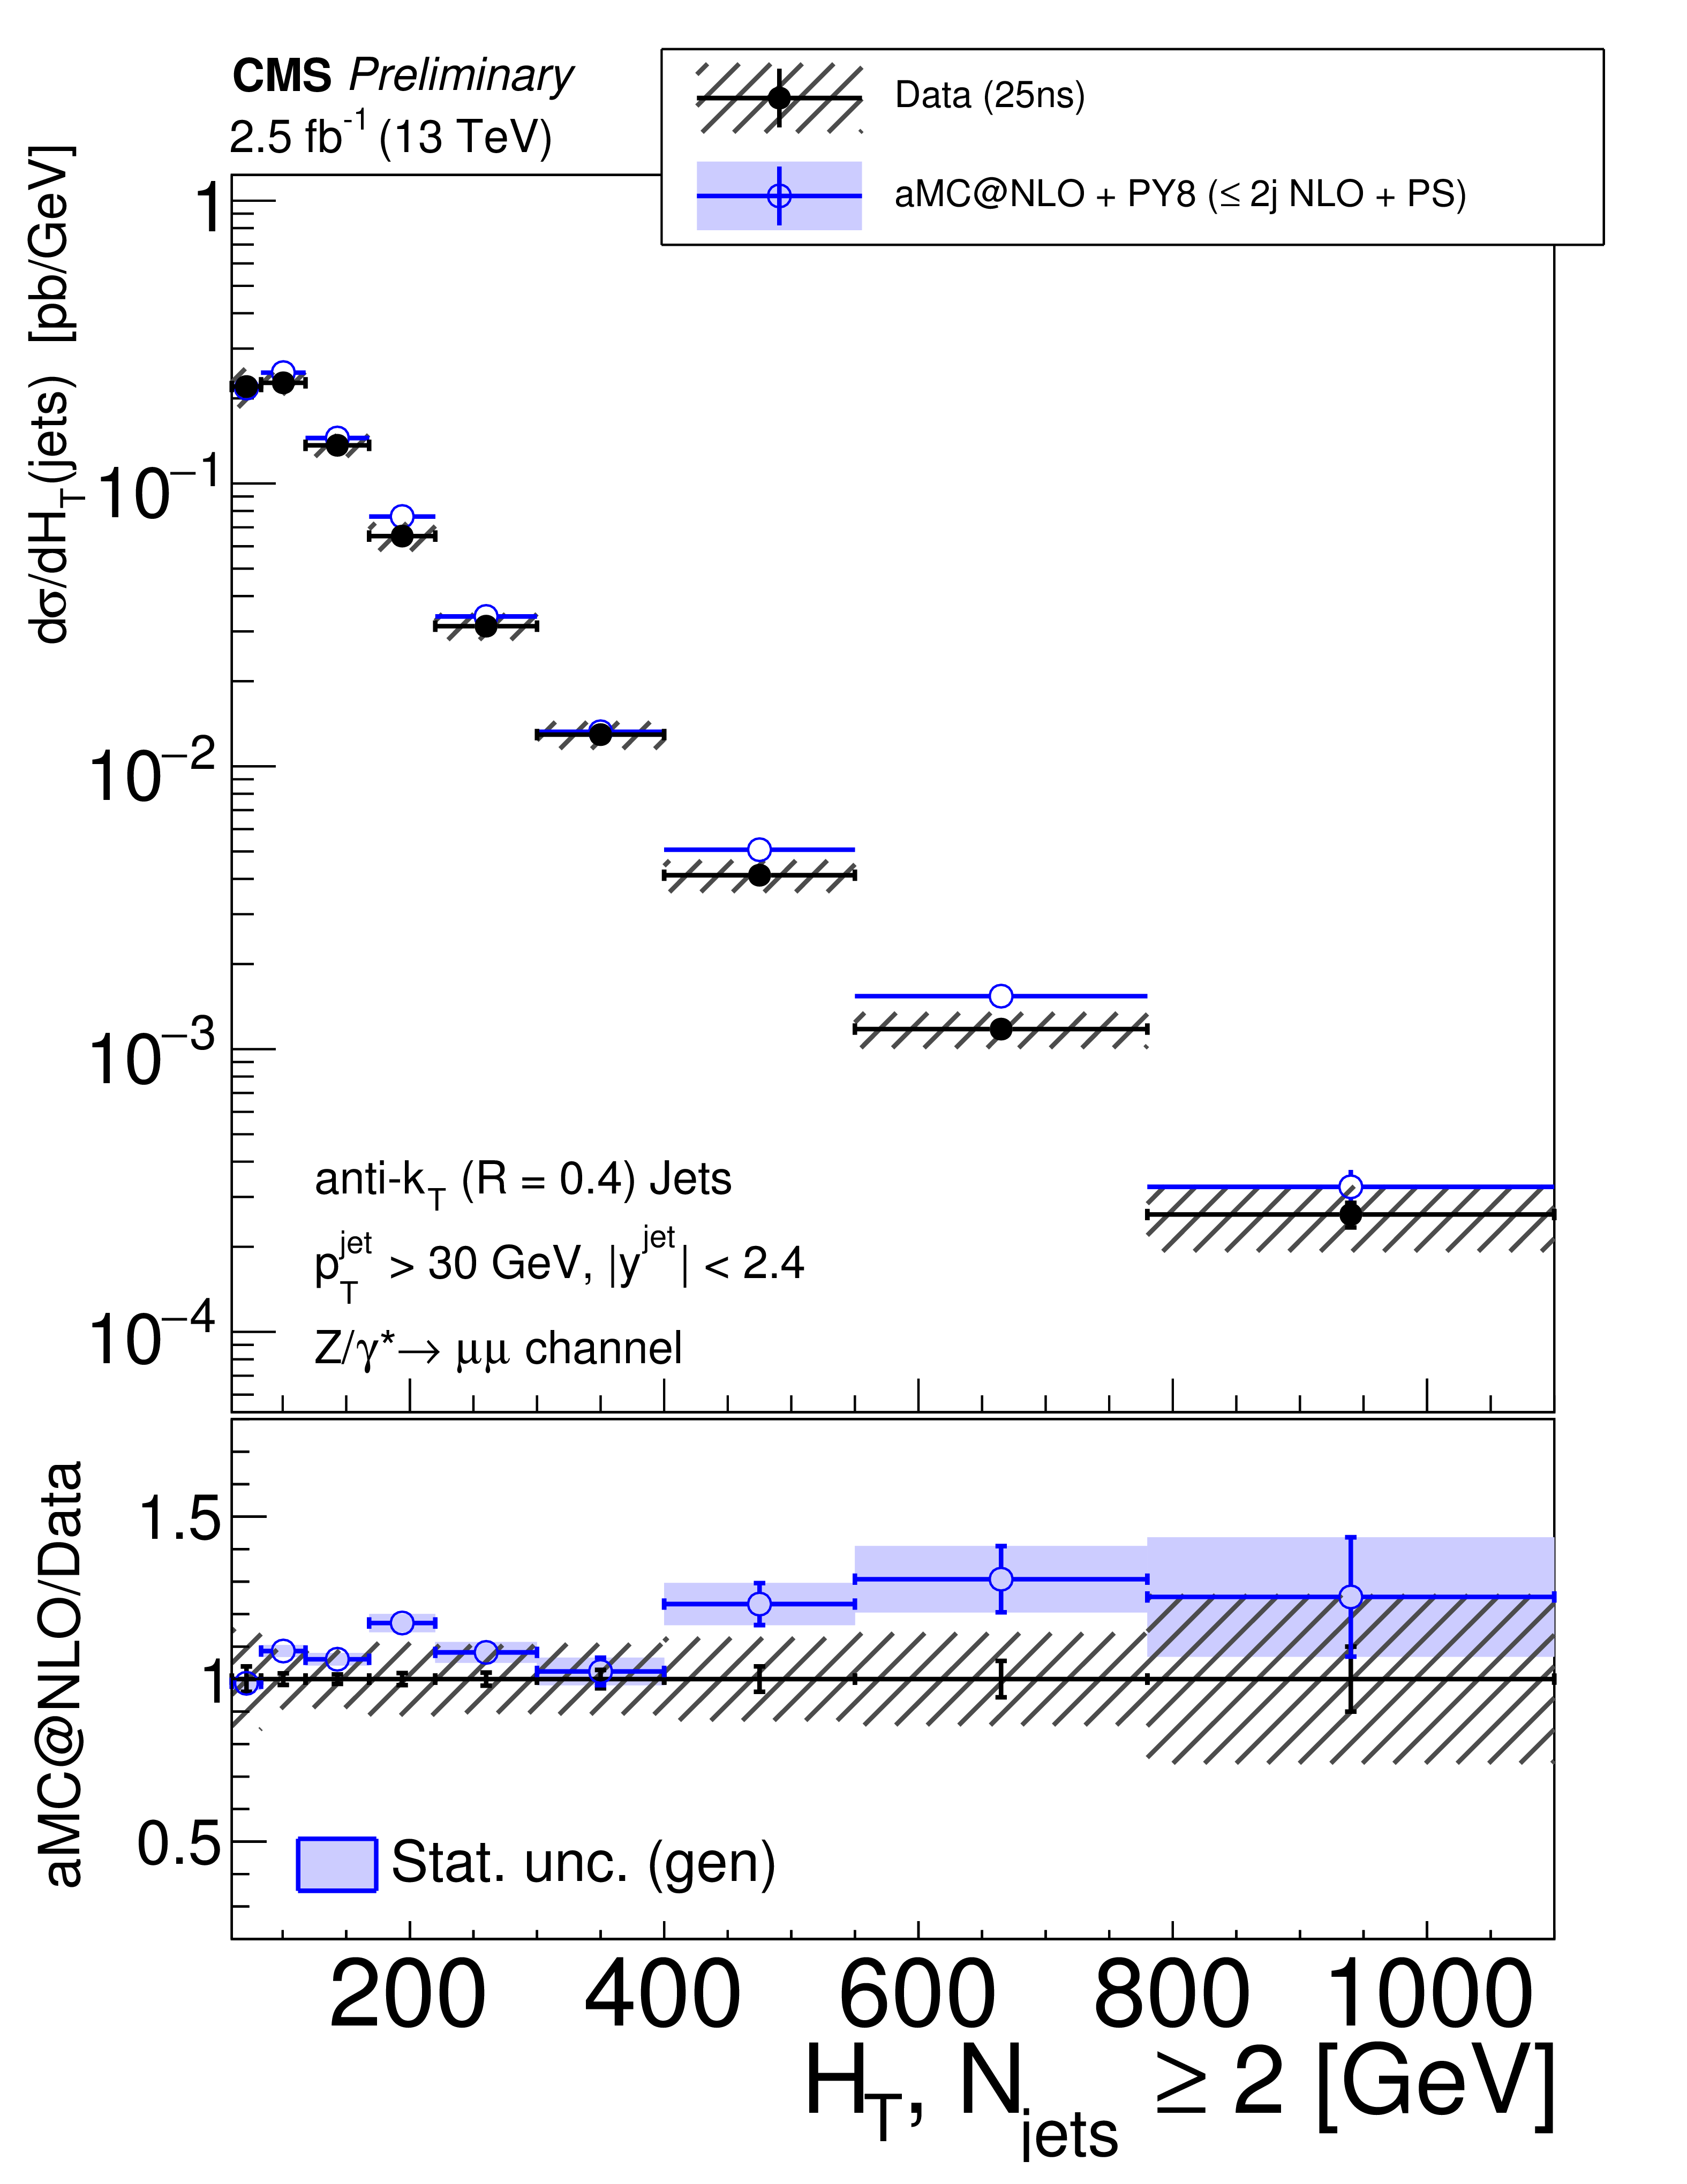
Figure 13-b:
Measured cross section as a function of $ H_{\mathrm{T}} $ for inclusive jet multiplicities of (a) one and (b) two. The error bar represents the statistical uncertainty and the grey hatched band represents the total uncertainty including systematic and statistical uncertainties. |
png pdf |
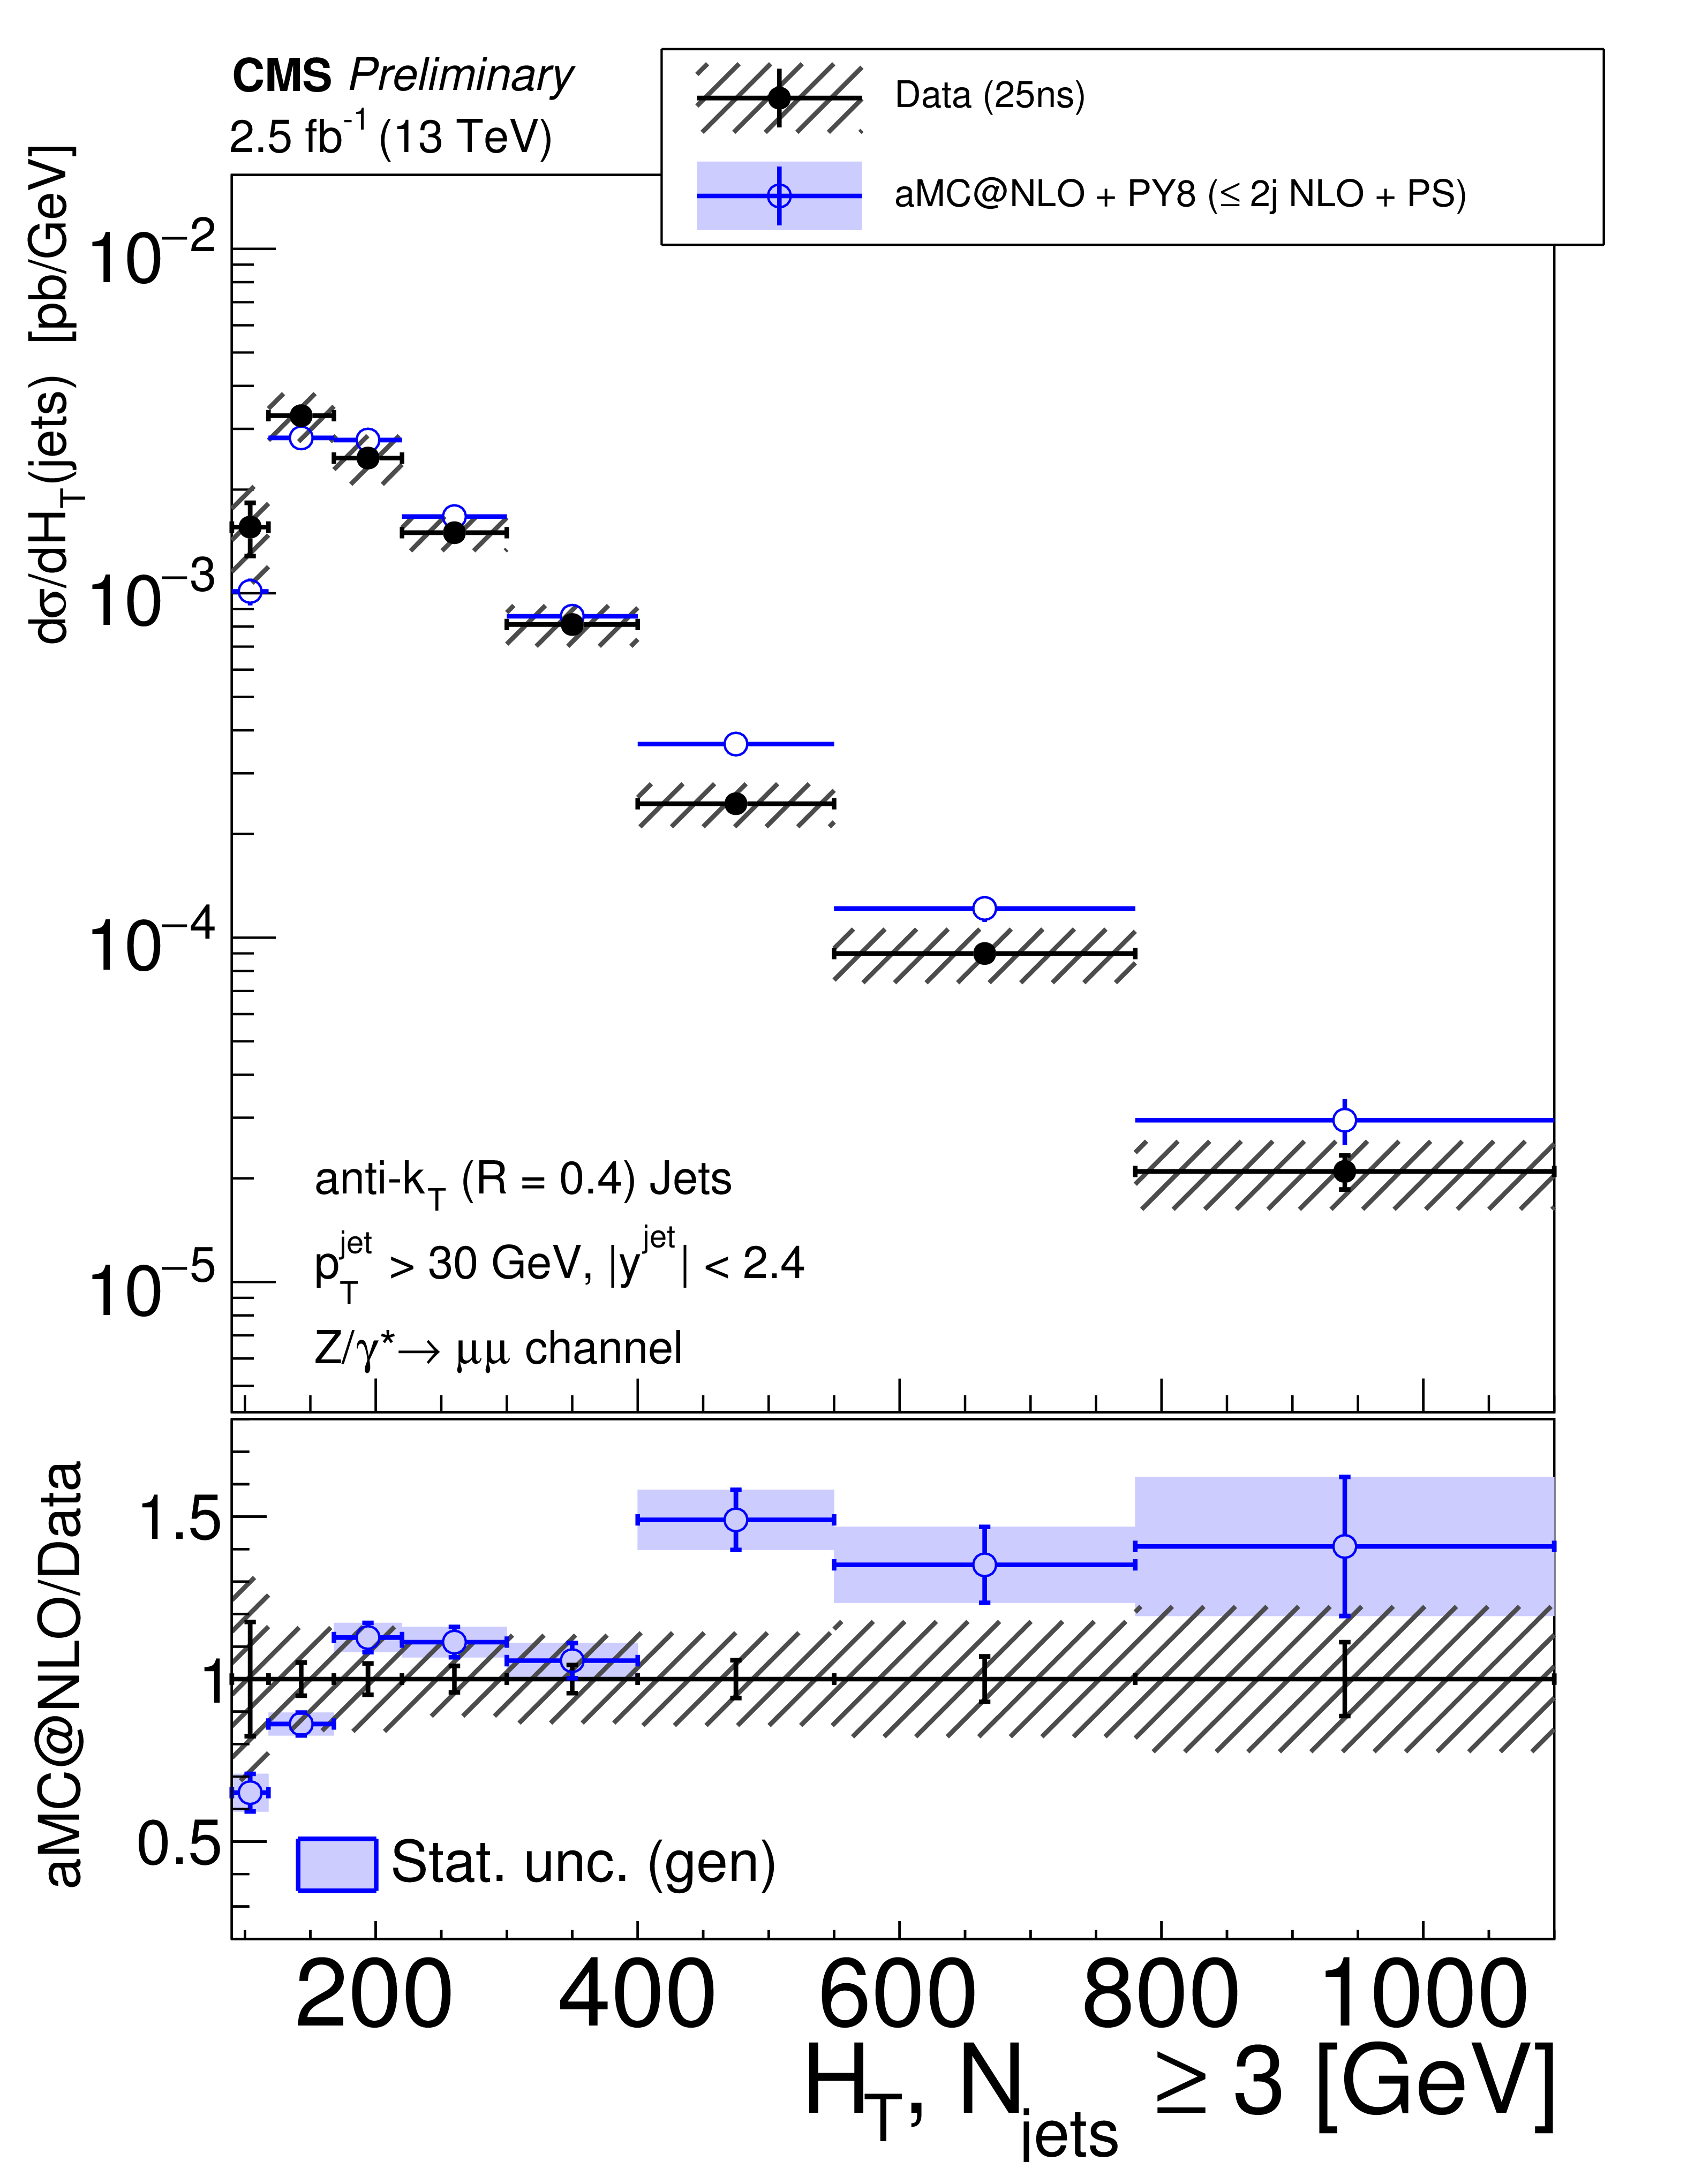
Figure 14:
Measured cross section as a function of $ H_{\mathrm{T}} $ for inclusive jet multiplicities of three. The error bar represents the statistical uncertainty and the grey hatched band represents the total uncertainty including systematic and statistical uncertainties. |
png pdf |
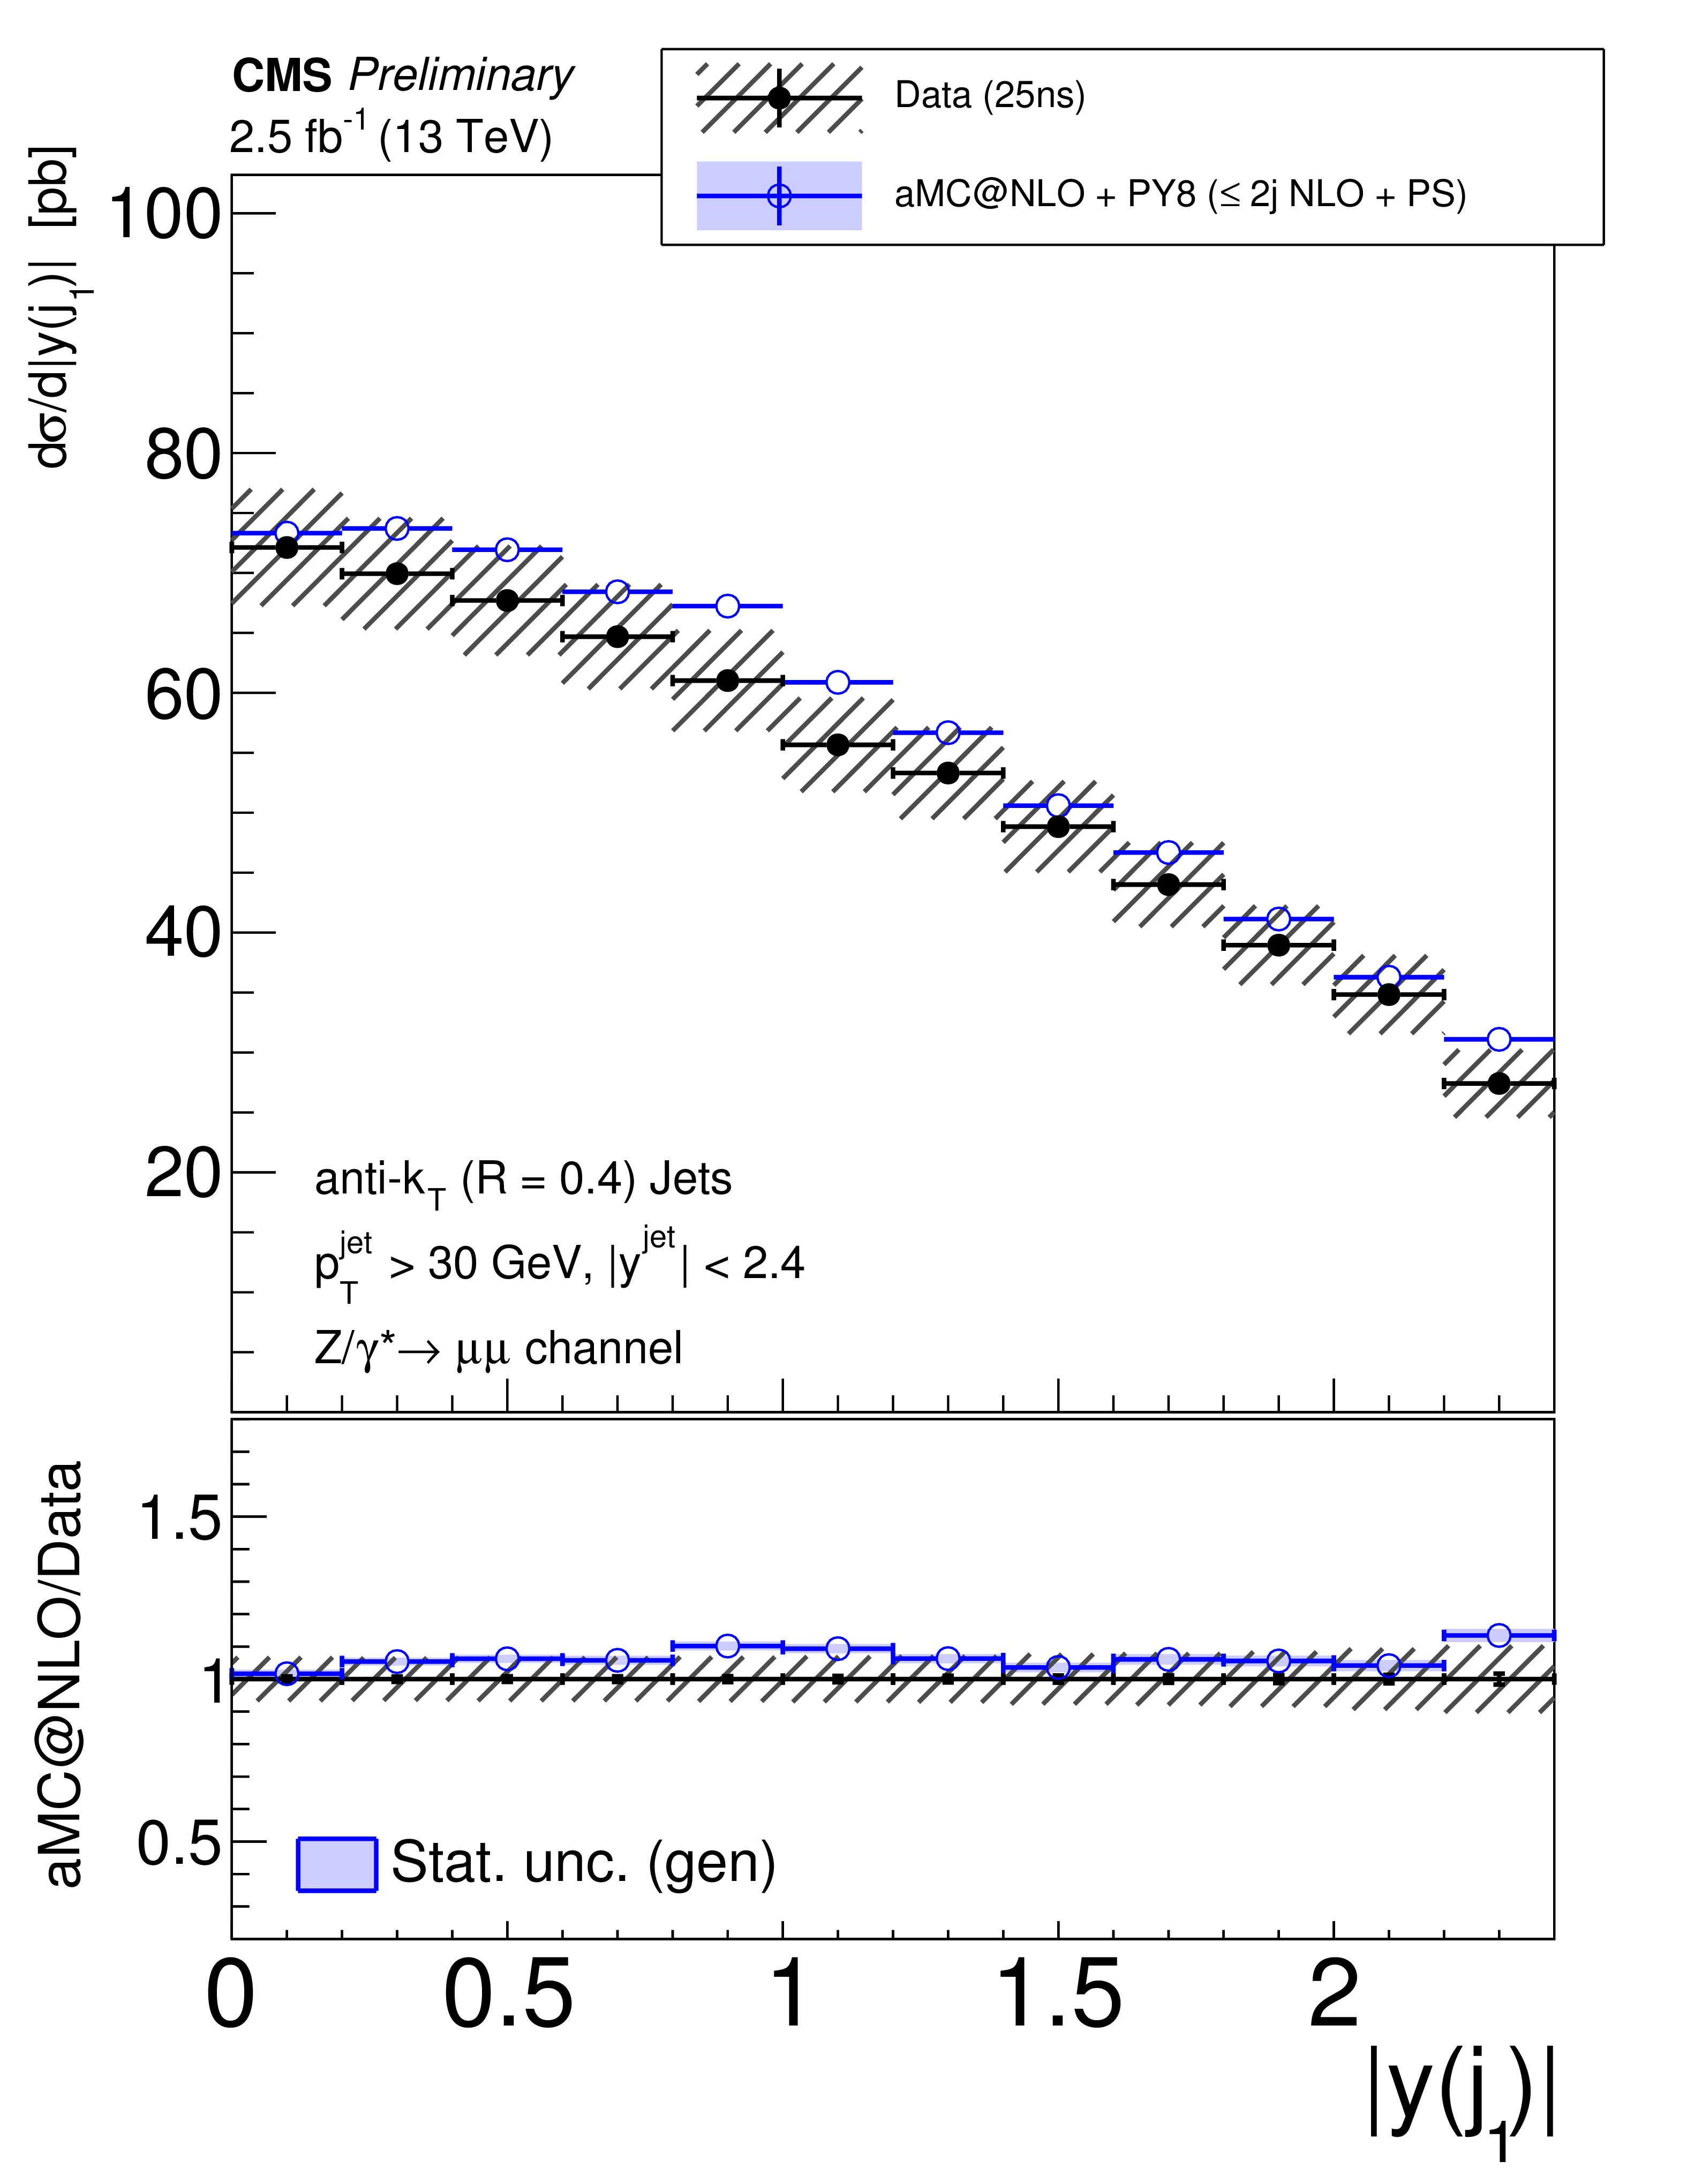
Figure 15-a:
Measured cross section as a function of the rapidity of the (a) first and (b) second highest $ p_{\mathrm{T}} $ jets. The error bar represents the statistical uncertainty and the grey hatched band represents the total uncertainty including systematic and statistical uncertainties. |
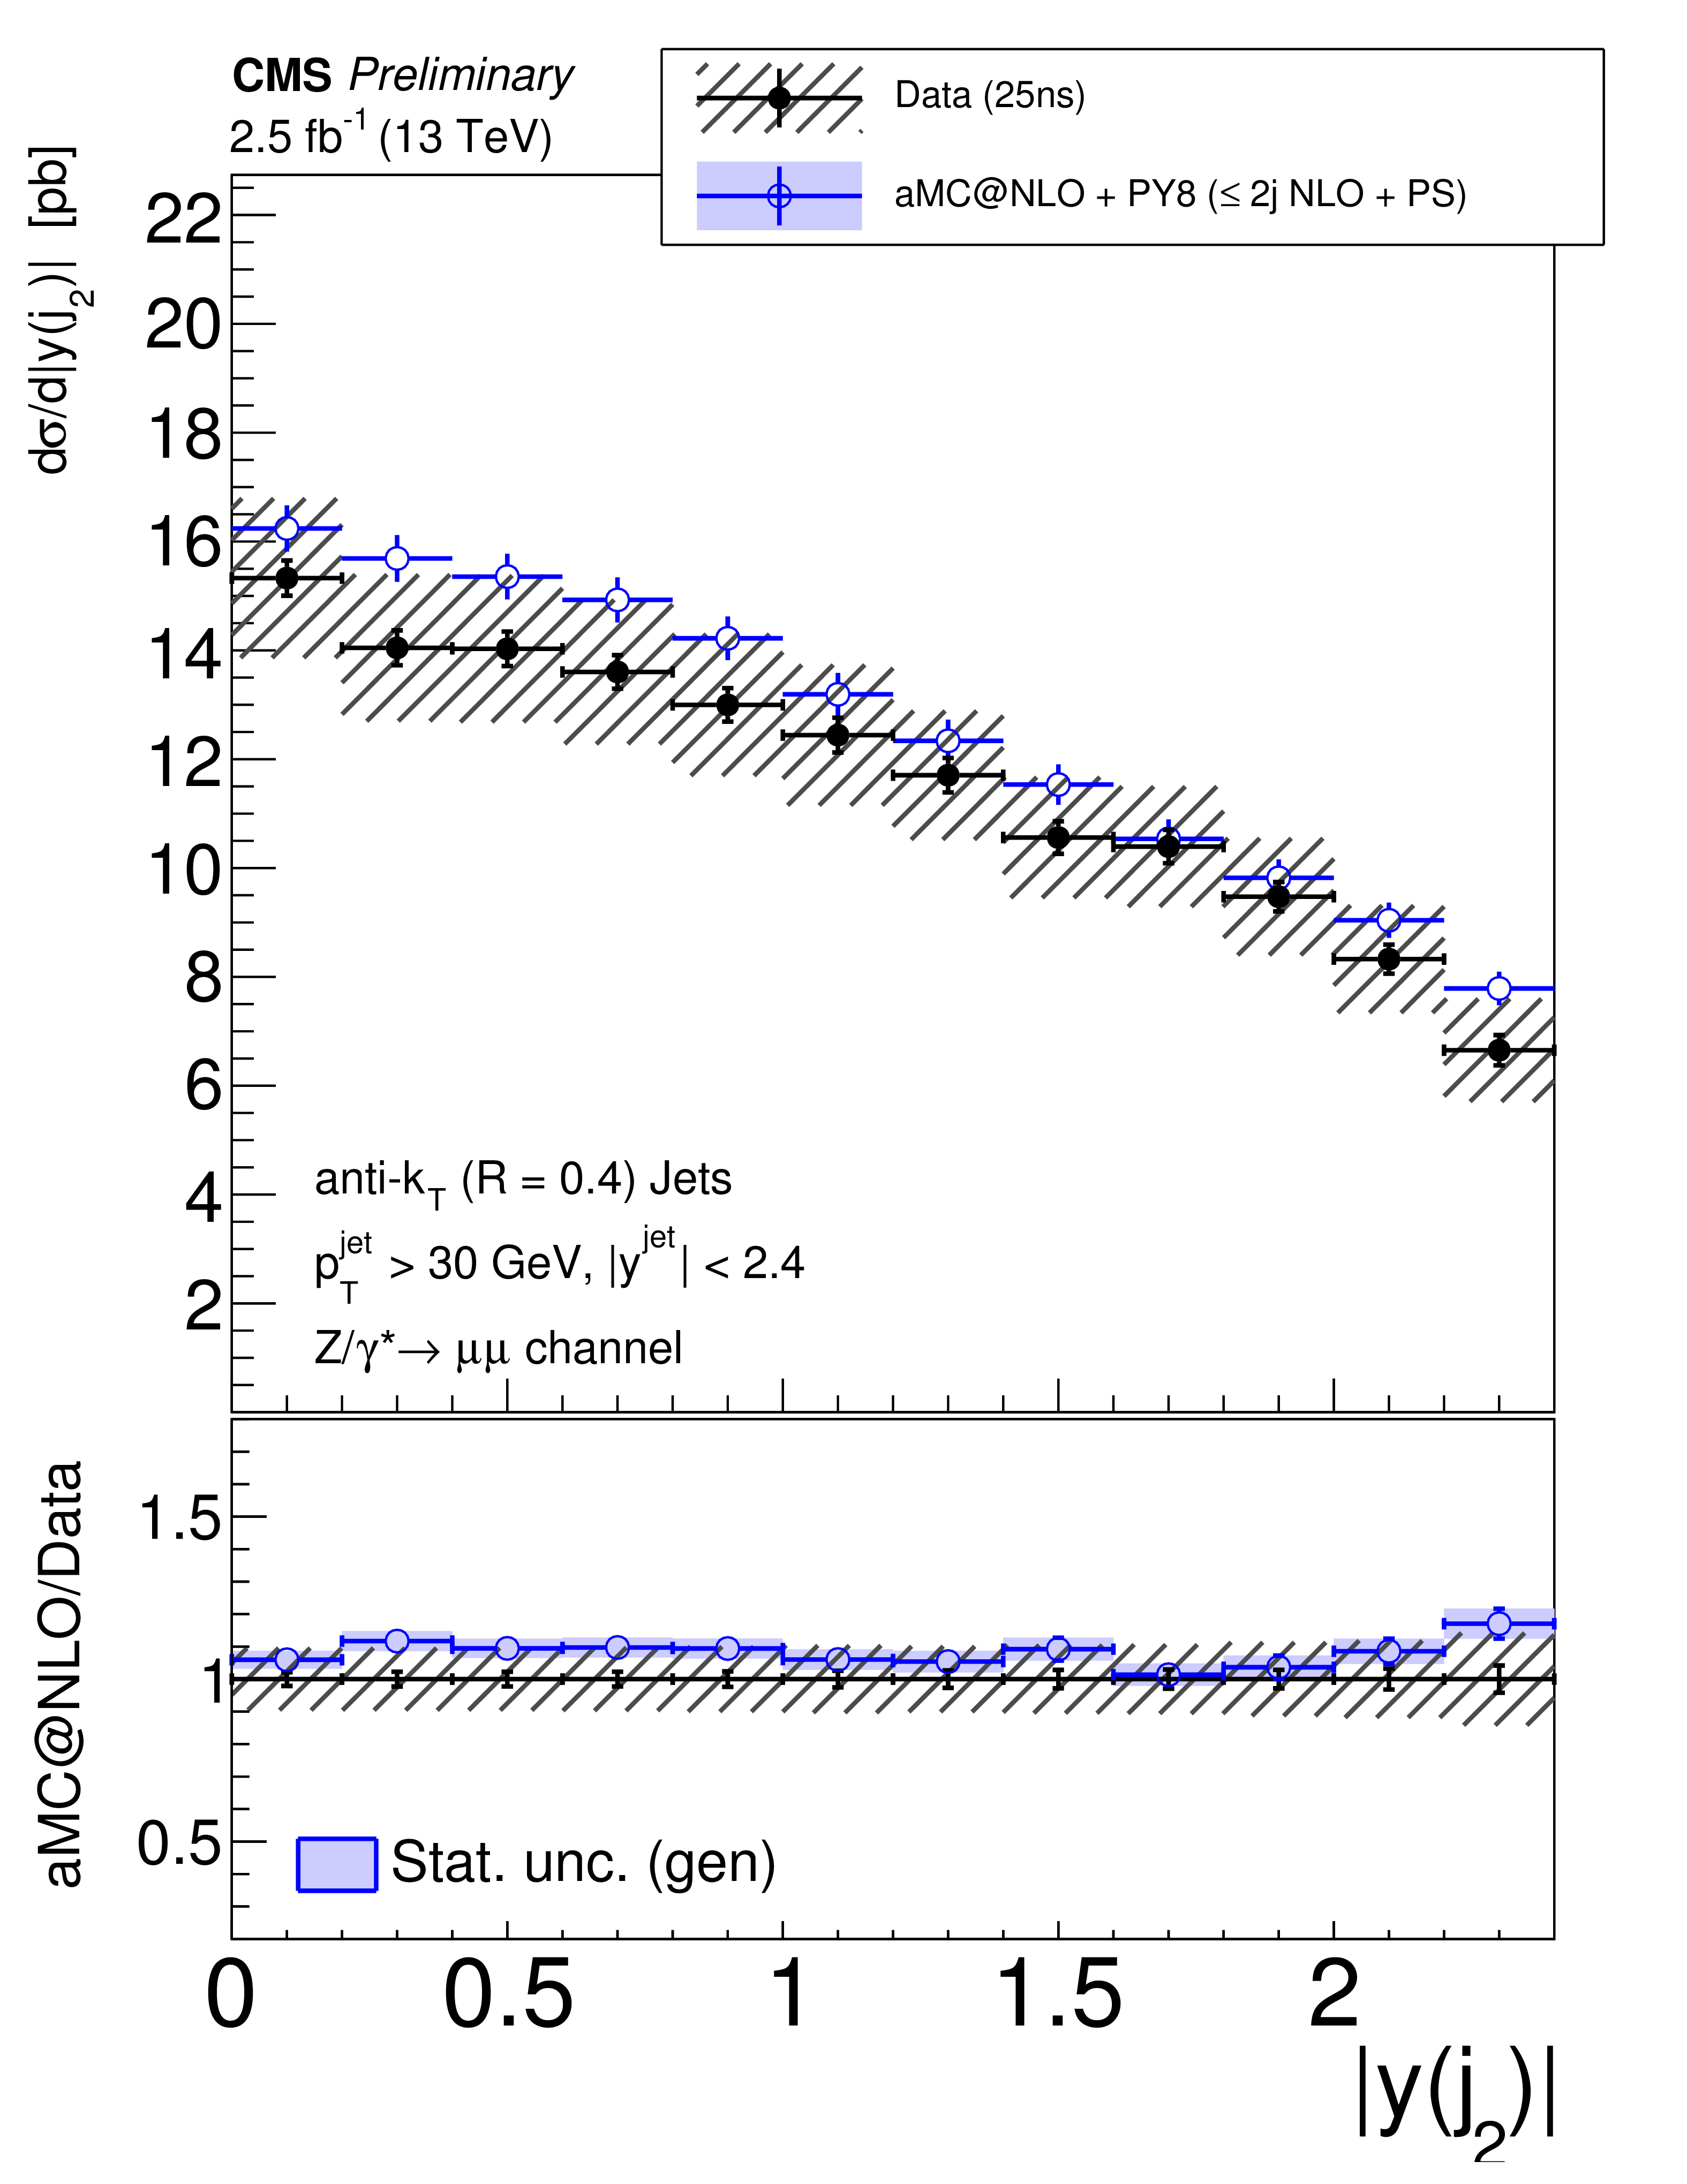
png pdf |
Figure 15-b:
Measured cross section as a function of the rapidity of the (a) first and (b) second highest $ p_{\mathrm{T}} $ jets. The error bar represents the statistical uncertainty and the grey hatched band represents the total uncertainty including systematic and statistical uncertainties. |
png pdf |
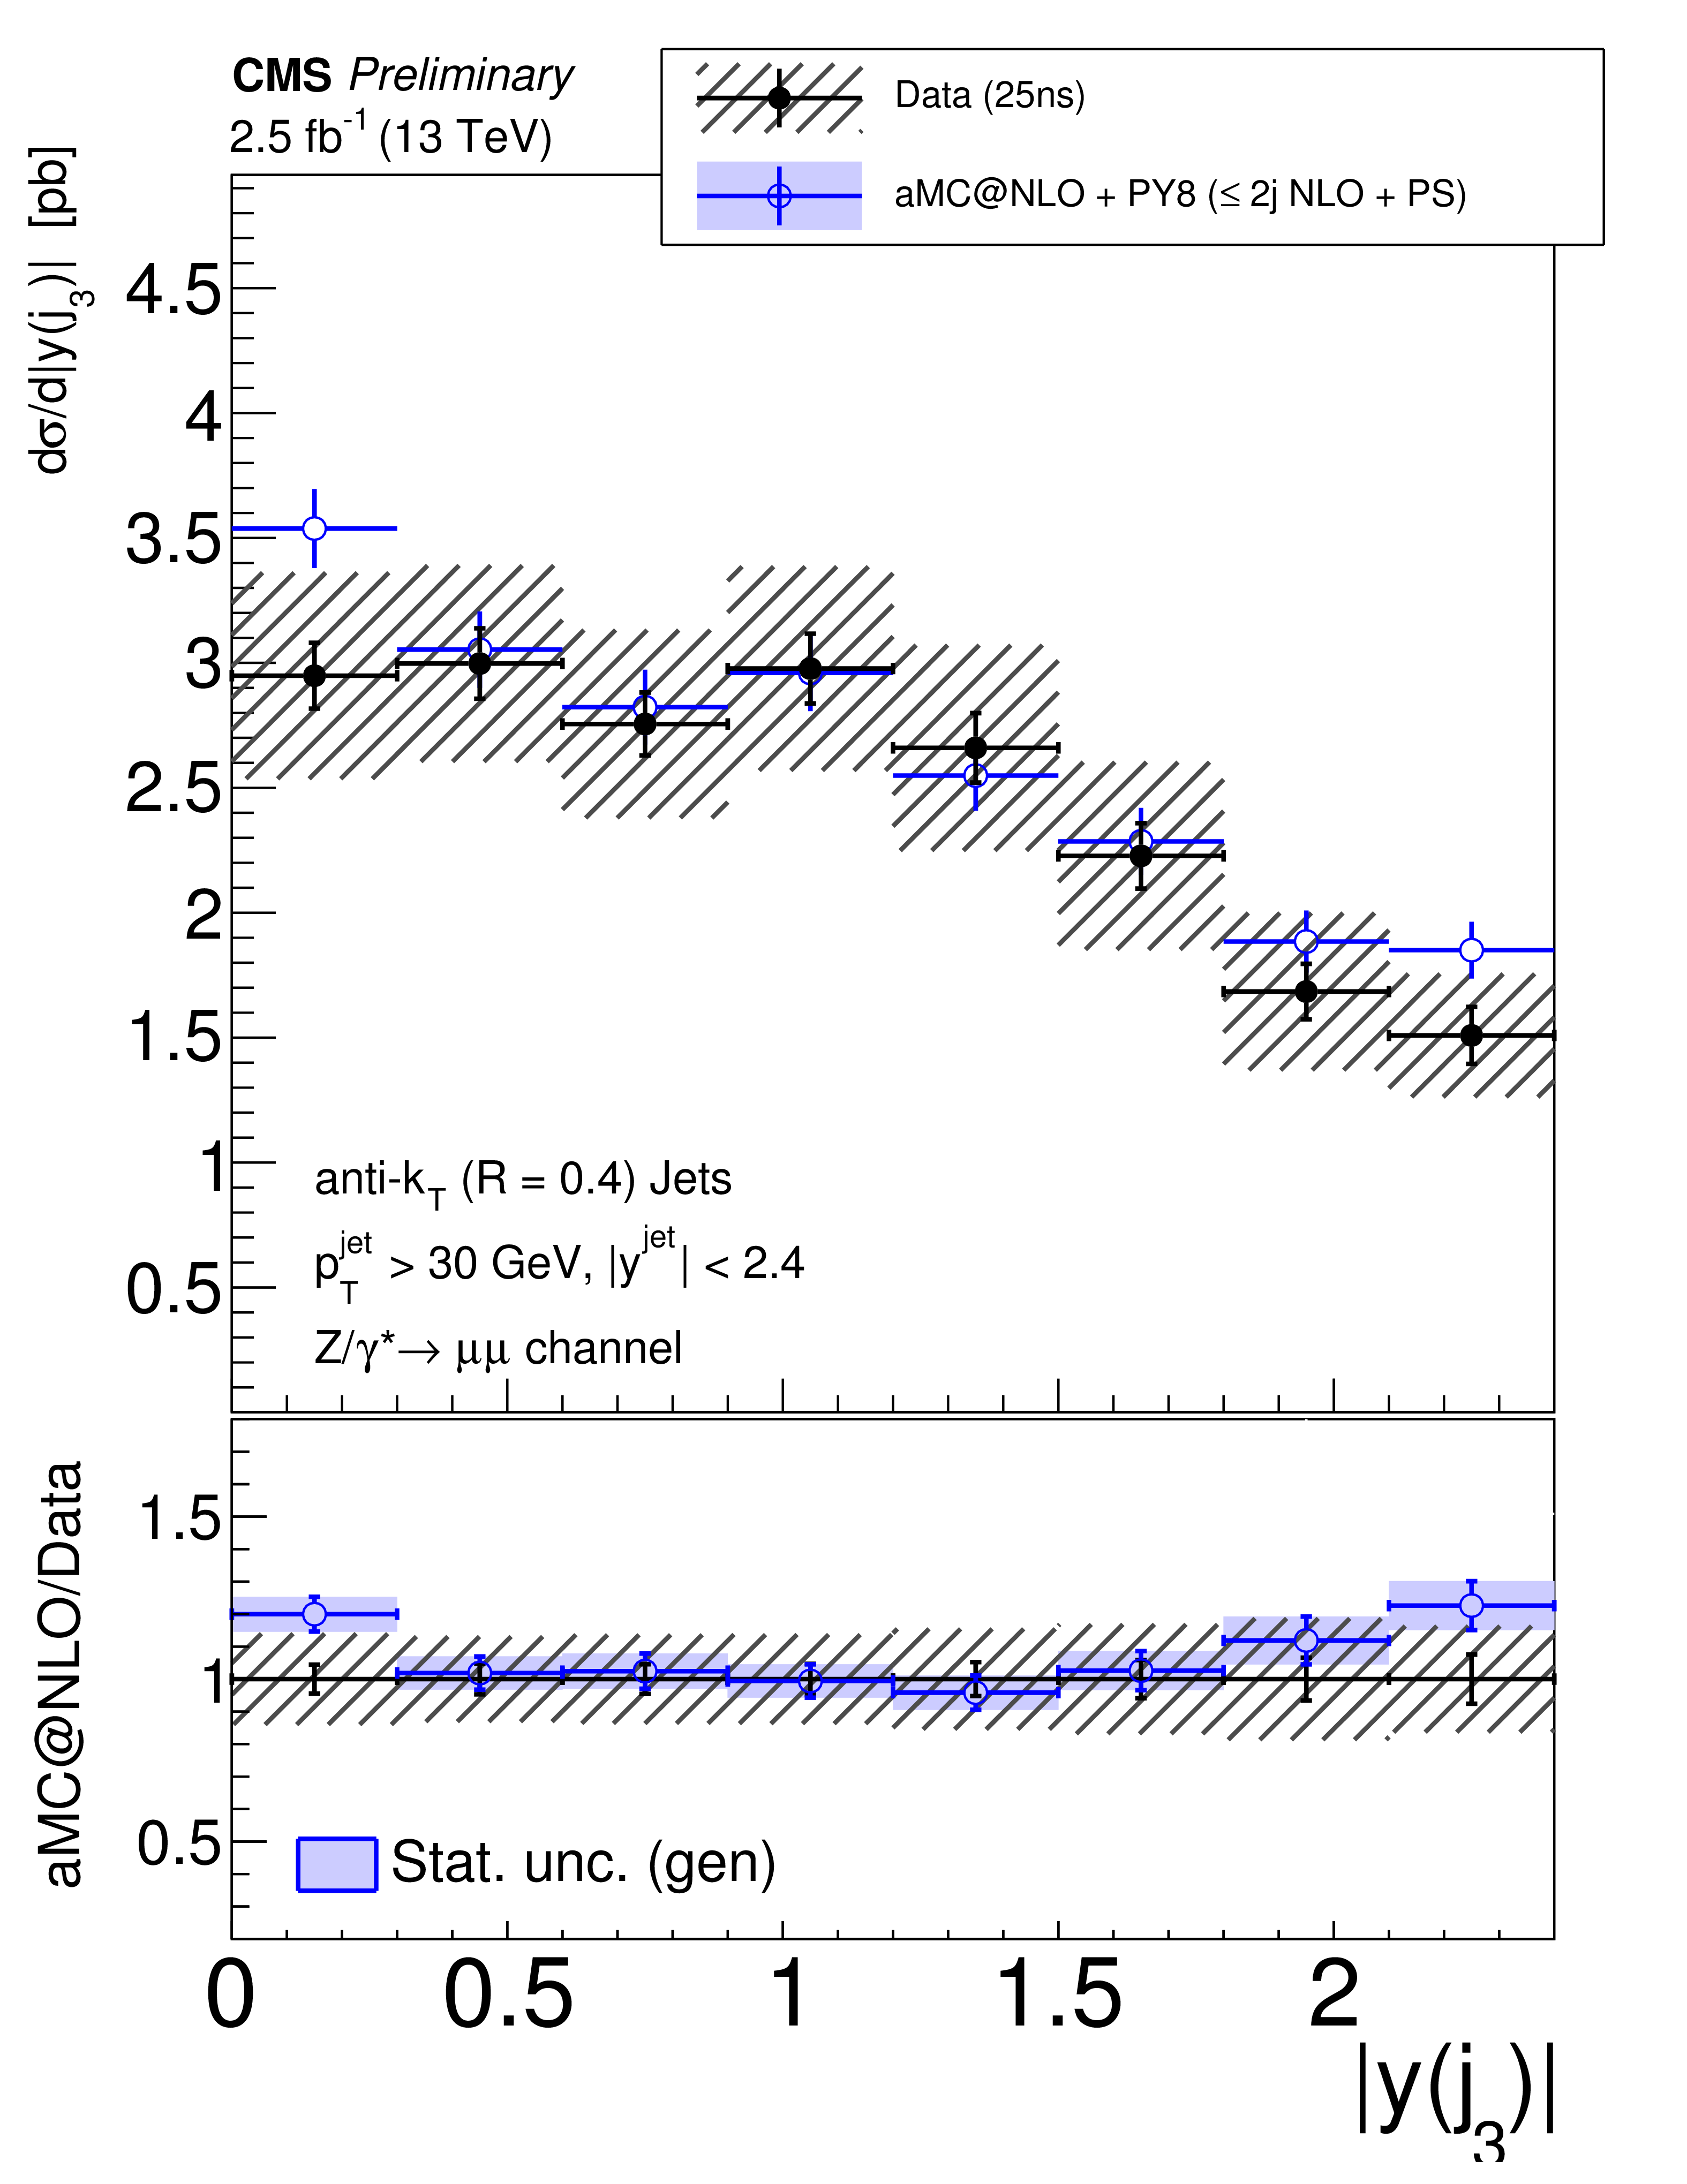
Figure 16:
Measured cross section as a function of the rapidity of the third highest $ p_{\mathrm{T}} $ jet. The error bar represents the statistical uncertainty and the grey hatched band represents the total uncertainty including systematic and statistical uncertainties. |
| Tables | |
png pdf |
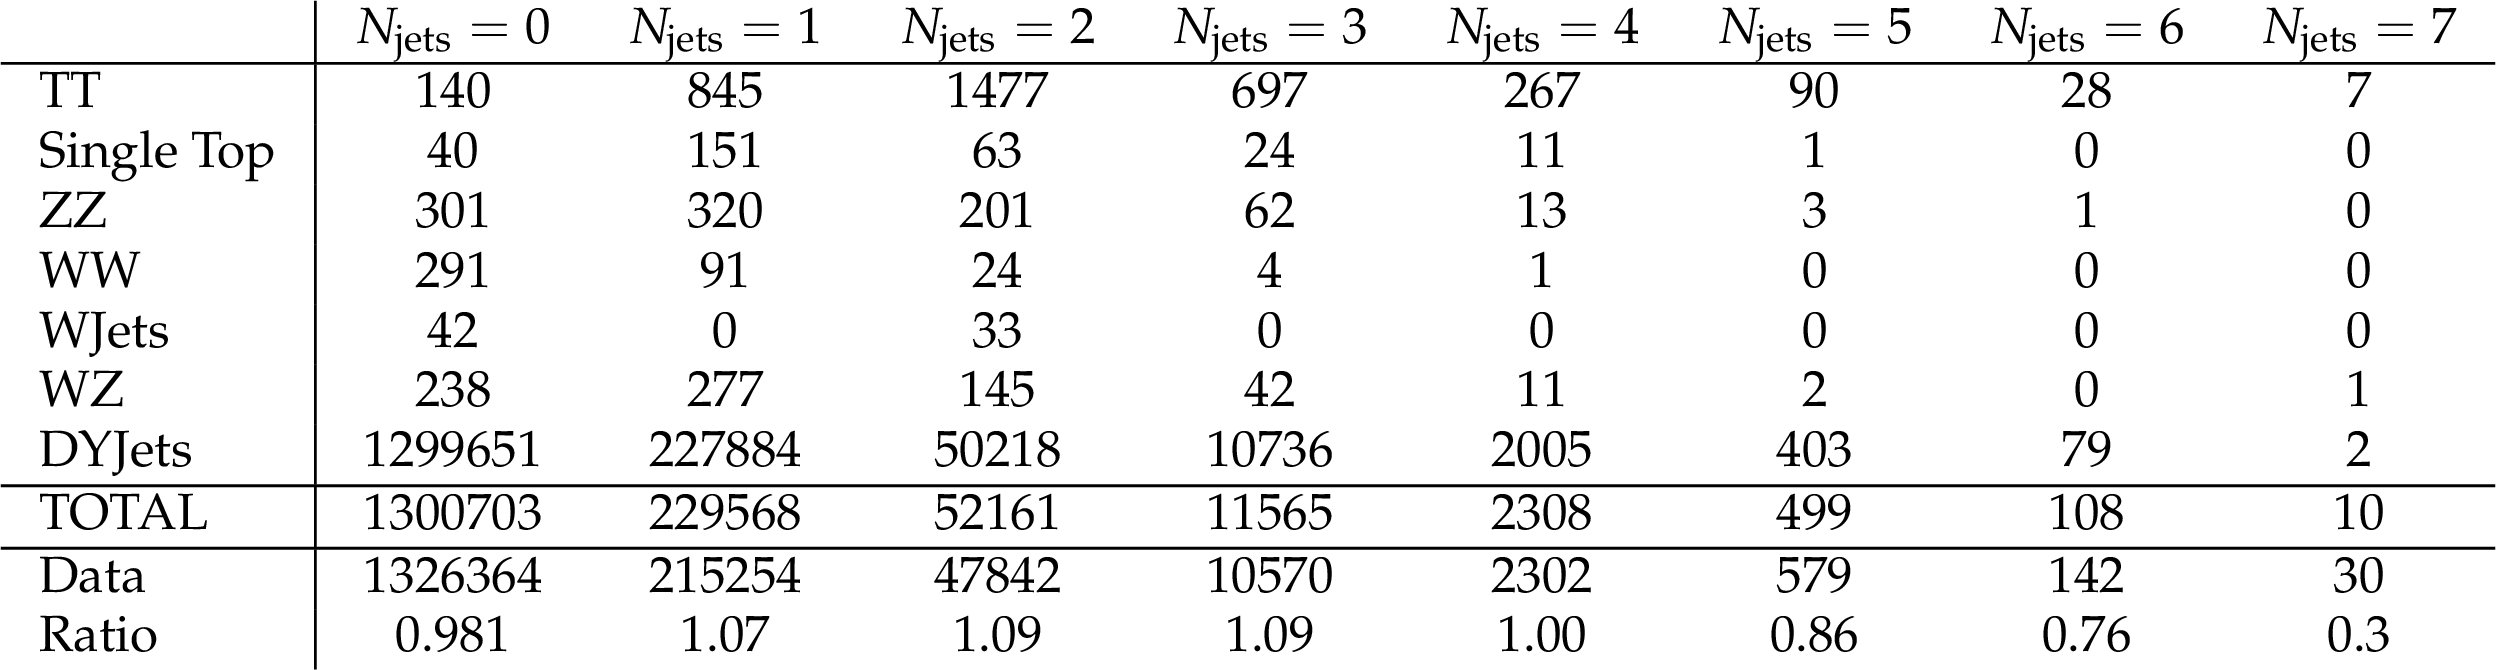
Table 1:
Number of events in data and MC samples for the exclusive jet multiplicity after the full selection. |
| Summary |
|
Measurements of the cross sections and differential cross sections for a Z boson produced in association with jets in pp collisions at a centre-of-mass energy of 13 TeV are presented. The data correspond to an integrated luminosity of 2.5 fb$^{-1}$ and were collected with the CMS detector during the 2015 proton-proton run with 25 ns bunch crossing at the LHC. Cross sections determined using the dimuon decay mode of the Z boson are presented as functions of the jet multiplicity, the $ p_{\mathrm{T}} $ and rapidities of the three leading jets as well as $ H_{\mathrm{T}} $ for inclusive jet multiplicities from one to three. The results are corrected for all detector effects using regularised unfolding and compared with the predictions of NLO pQCD with parton showering and detector simulation. The predictions generally describe the measured cross sections within the uncertainties. |
| Additional Figures | |

png pdf |
Additional Figure 1-a:
Reconstructed data and simulated signal and backgrounds distributions of (a) muon transverse momenta, $p_{\text {T}}(\mu )$, and (b) pseudo-rapidity, $\eta (\mu )$ for $\text {Z}\ + \ge 0 \text { jet}$ events passing the measurement selection. The error bars on the data points correspond to the statistical errors (in the case of the ratio plots, they correspond to the statistical errors coming from both the data and the simulation). |
png pdf |
Additional Figure 1-b:
Reconstructed data and simulated signal and backgrounds distributions of (a) muon transverse momenta, $p_{\text {T}}(\mu )$, and (b) pseudo-rapidity, $\eta (\mu )$ for $\text {Z}\ + \ge 0 \text { jet}$ events passing the measurement selection. The error bars on the data points correspond to the statistical errors (in the case of the ratio plots, they correspond to the statistical errors coming from both the data and the simulation). |
png pdf |
Additional Figure 2-a:
Reconstructed data and simulated signal and backgrounds distributions of the $\text {Z}$ candidate invariant mass (a) and rapidity (b) for $\text {Z}\ + \ge 0 \text { jet}$ events passing the measurement selection. The error bars on the data points correspond to the statistical errors (in the case of the ratio plots, they correspond to the statistical errors coming from both the data and the simulation). |
png pdf |
Additional Figure 2-b:
Reconstructed data and simulated signal and backgrounds distributions of the $\text {Z}$ candidate invariant mass (a) and rapidity (b) for $\text {Z}\ + \ge 0 \text { jet}$ events passing the measurement selection. The error bars on the data points correspond to the statistical errors (in the case of the ratio plots, they correspond to the statistical errors coming from both the data and the simulation). |

png pdf |
Additional Figure 3:
Comparison with two different calculations of the cross section measured as a function of the leading jet transverse momentum. In addition to the comparison with the FxFx merged Z$+$0,1,2 jets NLO calculation from MG5-aMC@NLO and Pythia8 of Fig.11, the measurement is compared with the Z$+$1 jet NNLO prediction from [A1-A3] using the CT14 PDF set [A4]. For the FxFx merged NLO calculation, the total cross section is corrected with the NNLO Z production cross section obtained with FEWZ. The Z$+$1 jet NNLO calculation does not include parton showering, lepton final state radiation, hadronization, and underlying events. The effect of hadronization and underlying events is taken into account by applying to the histogram the corrections presented in the Additional Table1. Turing off the QED final state radiation in the case of the MG5-aMC@NLO FxFx sample leads to a 3% cross section increase with little dependency on the leading jet transverse momentum. The error bars include the statistical uncertainty of the hadronization and underlying event correction. The theoretical uncertainty (denoted ``scale unc.'') has been evaluated by varying at the same time the normalisation and factorisation scales by factors 0.5 and 2. |
png pdf |
Additional Figure 4:
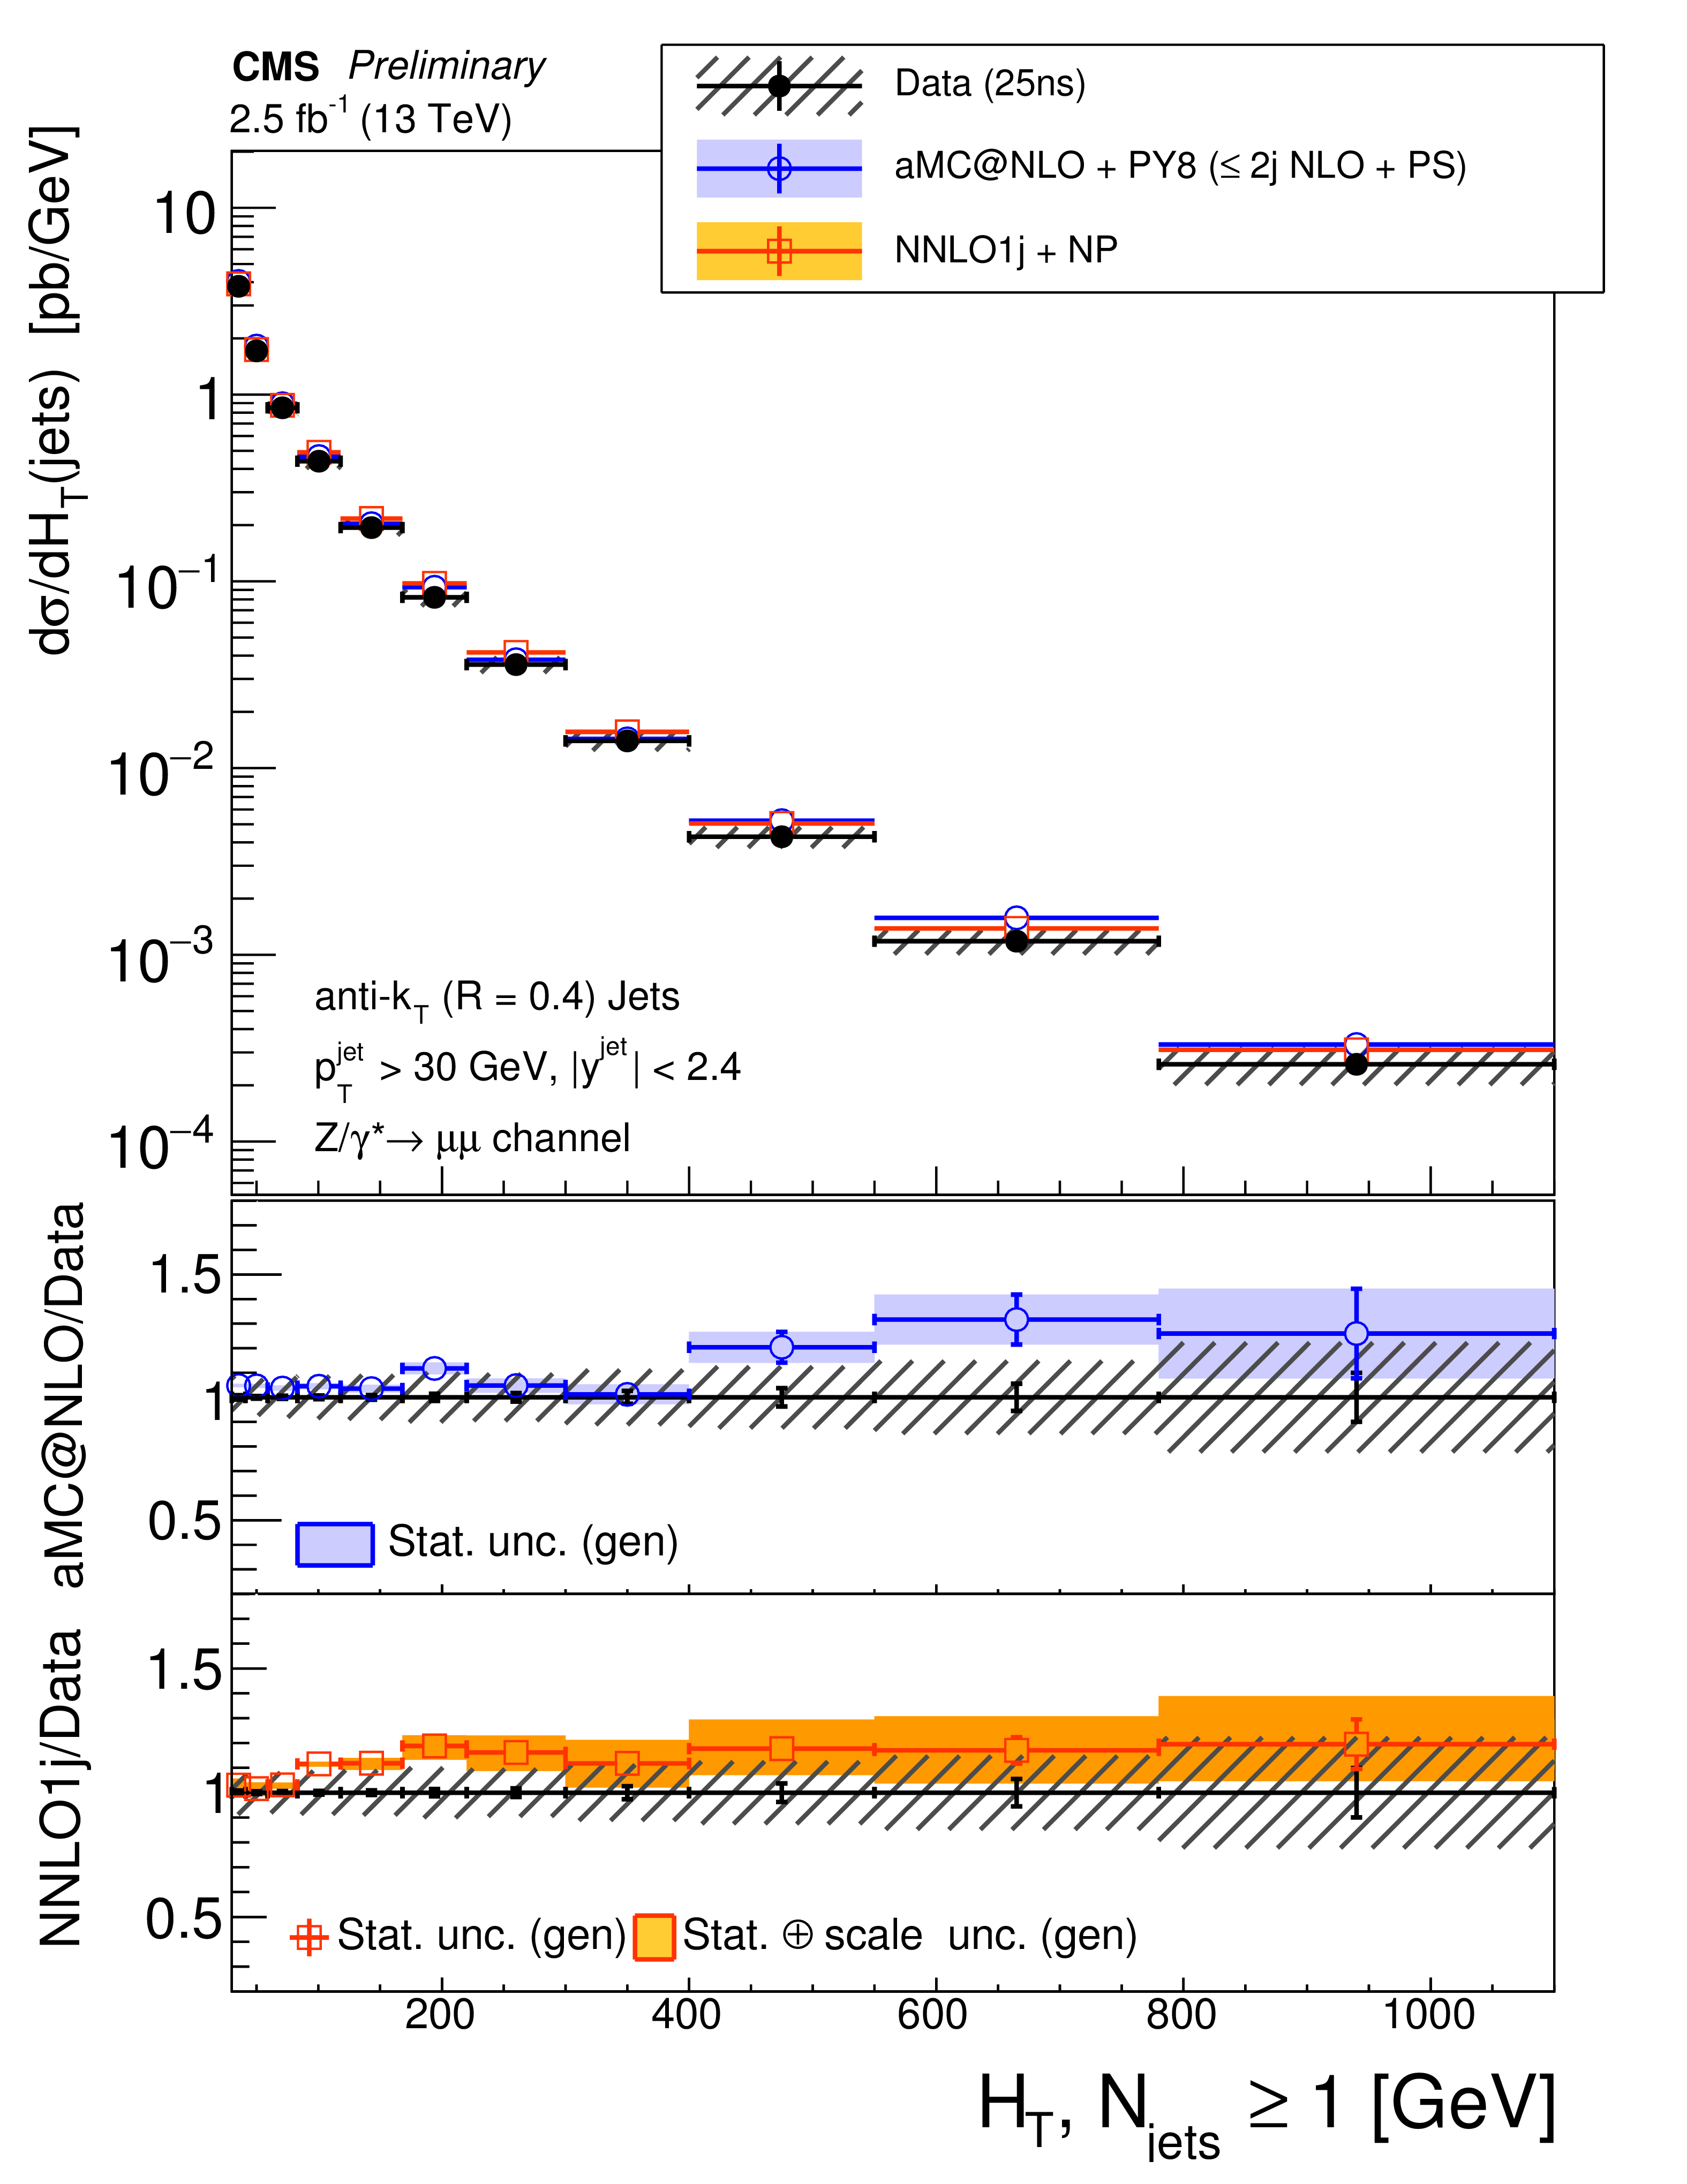
Comparison with two different calculations of the cross section measured as a function of the $H_{\text {T}}$ variable. In addition to the comparison with the FxFx merged Z$+$0,1,2 jets NLO calculation from MG5-aMC@NLO and Pythia8 of Fig.11, the measurement is compared with the Z$+$1 jet NNLO prediction from [A1-A3] using the CT14 PDF set [A4]. For the FxFx merged NLO calculation, the total cross section is corrected with the NNLO Z production cross section obtained with FEWZ. The Z$+$1 jet NNLO calculation does not include parton showering, lepton final state radiation, hadronization, and underlying events. The effect of hadronization and underlying events is taken into account by applying to the histogram the corrections presented in the Additional Table1. Turing off the QED final state radiation in the case of the MG5-aMC@NLO FxFx sample leads to a 3% cross section increase with little dependency on $H_{\text {T}}$. The error bars include the statistical uncertainty of the hadronization and underlying event correction. The theoretical uncertainty (denoted ``scale unc.'') has been evaluated by varying at the same time the normalisation and factorisation scales by factors 0.5 and 2. |
png pdf |
Additional Figure 5:
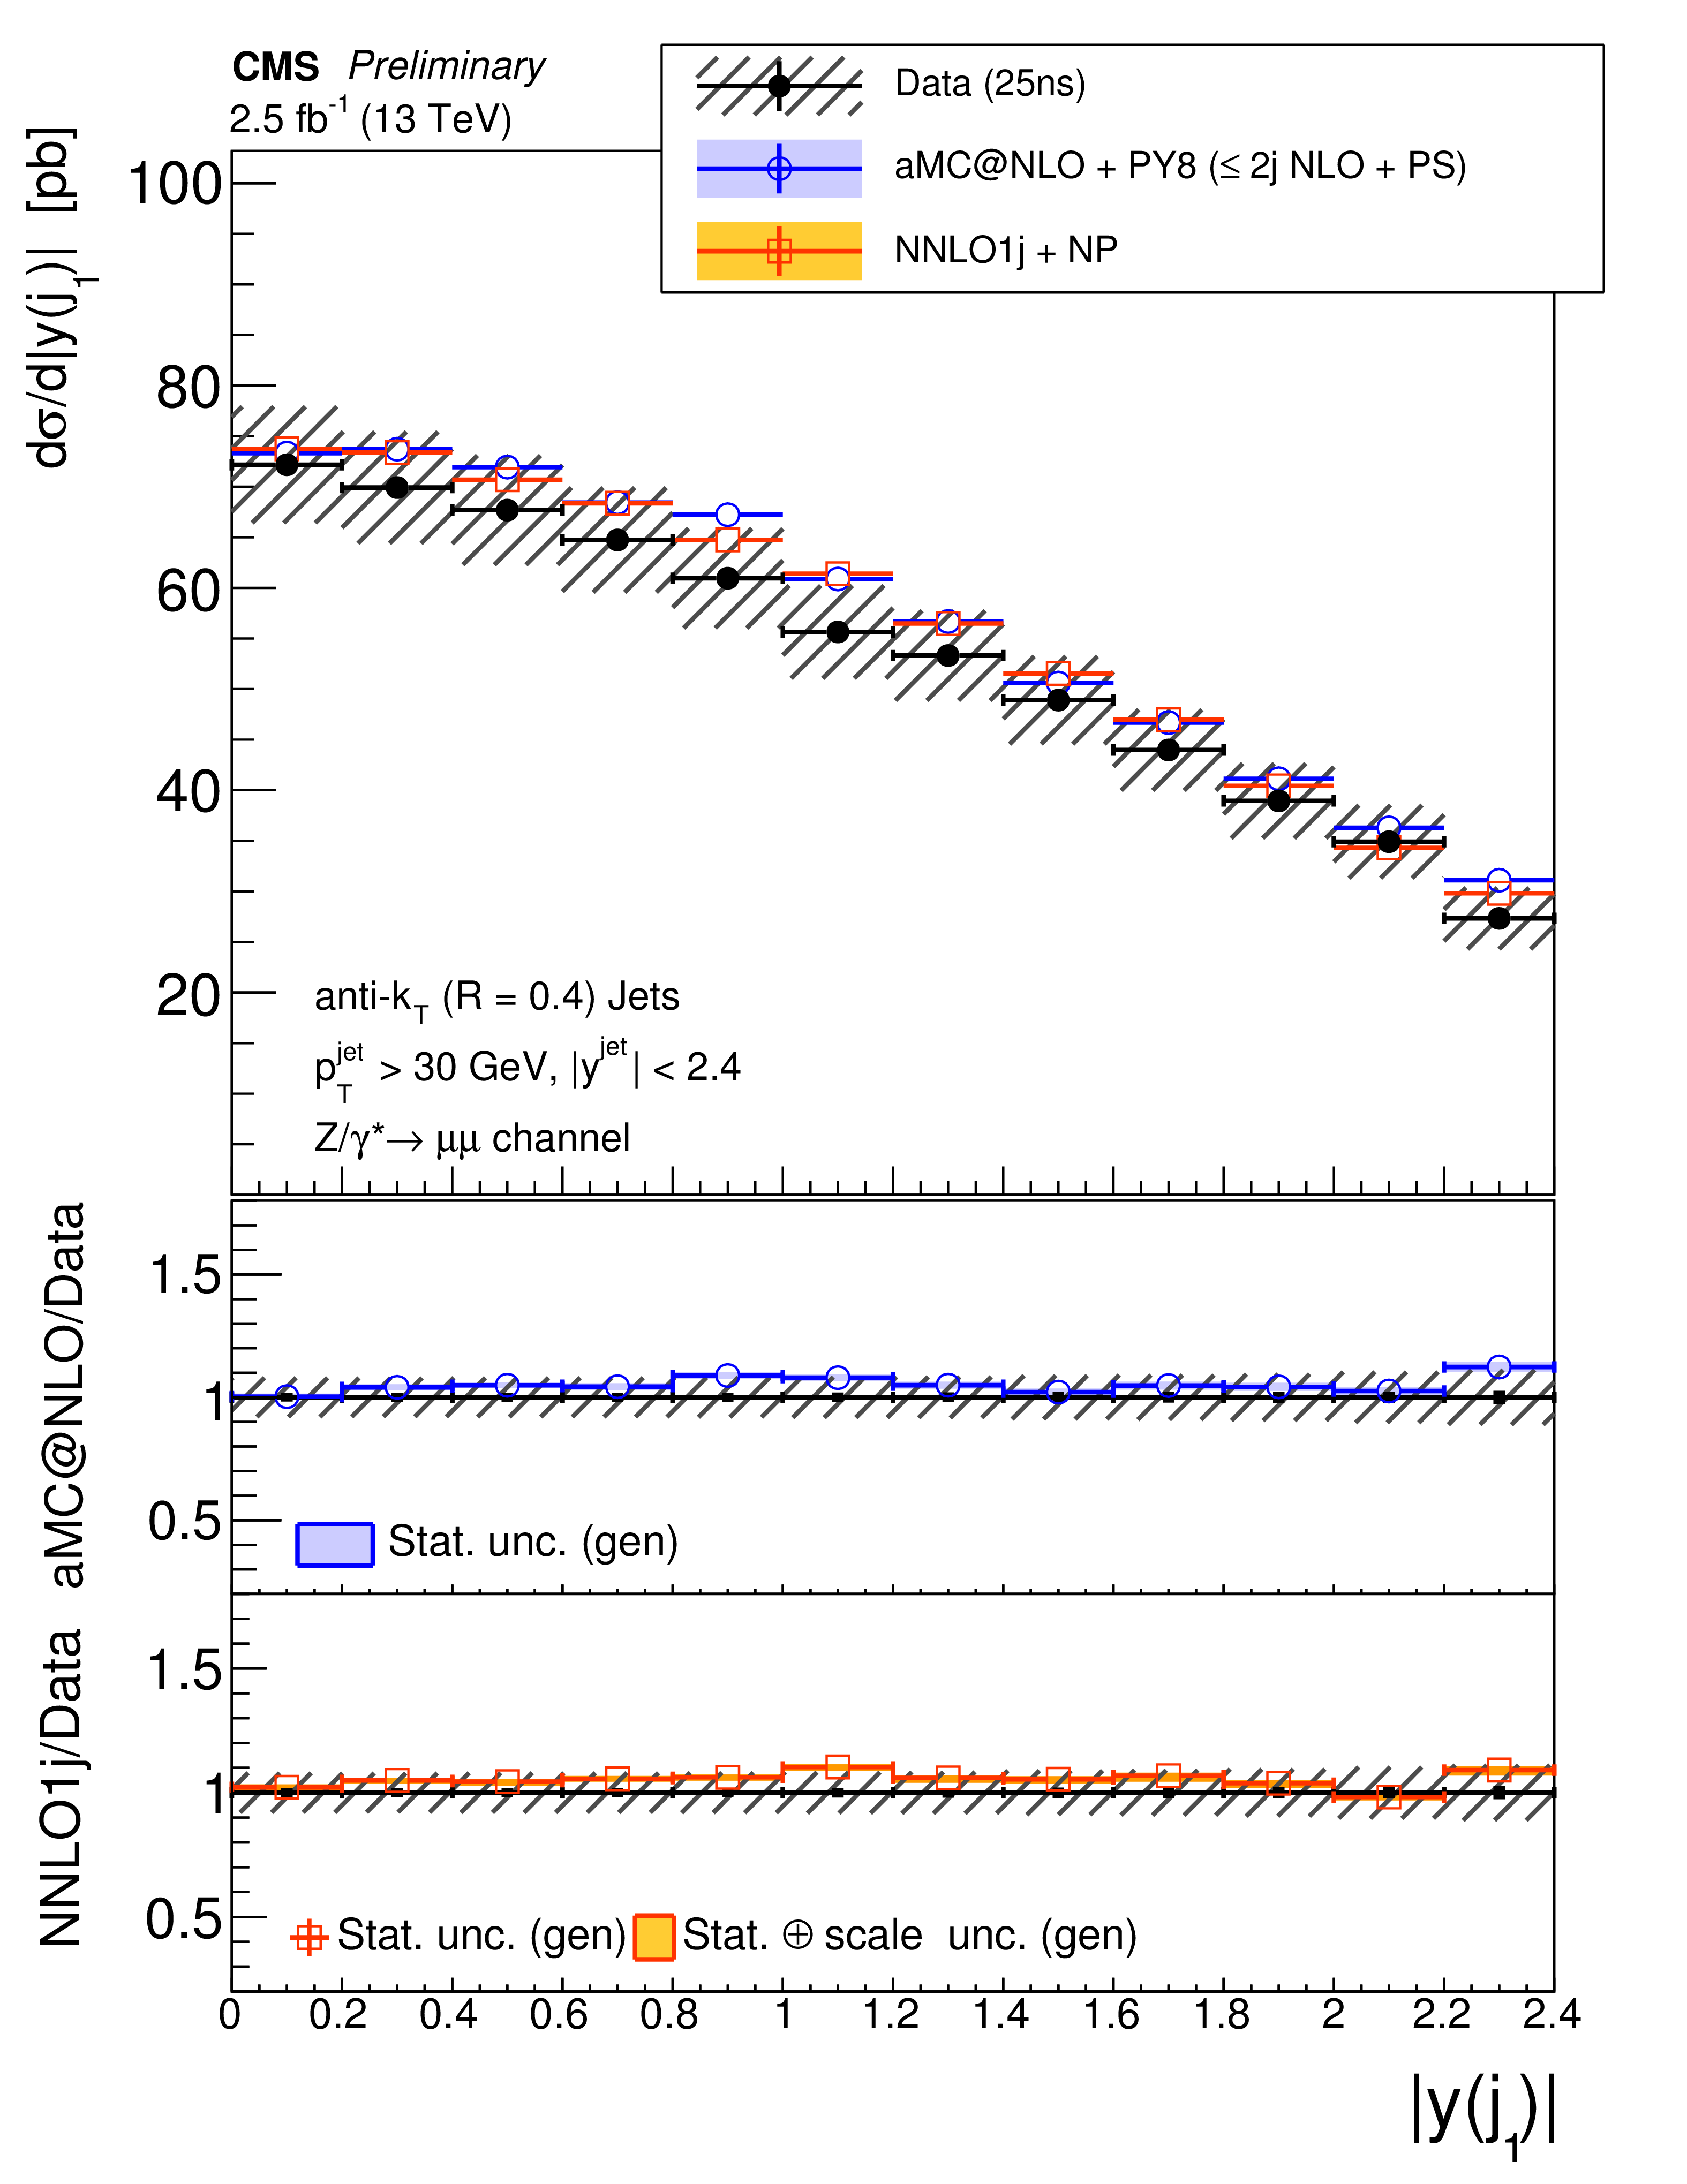
Comparison with two different calculations of the cross section measured as a function of the leading jet rapidity. In addition to the comparison with the FxFx merged Z$+$0,1,2 jets NLO calculation from MG5-aMC@NLO and Pythia8 of Fig.11, the measurement is compared with the Z$+$1 jet NNLO prediction from [A1-A3] using the CT14 PDF set [A4]. For the FxFx merged NLO calculation, the total cross section is corrected with the NNLO Z production cross section obtained with FEWZ. The Z$+$1 jet NNLO calculation does not include parton showering, lepton final state radiation, hadronization, and underlying events. The effect of hadronization and underlying events is taken into account by applying to the histogram the corrections presented in the Auxiliary Table1. Turing off the QED final state radiation in the case of the MG5-aMC@NLO FxFx sample leads to a 3% cross section increase with little dependency on the leading jet rapidity. The error bars include the statistical uncertainty of the hadronization and underlying event correction. The theoretical uncertainty (denoted ``scale unc.'') has been evaluated by varying at the same time the normalisation and factorisation scales by factors 0.5 and 2. |
| Additional Tables | |
png pdf |
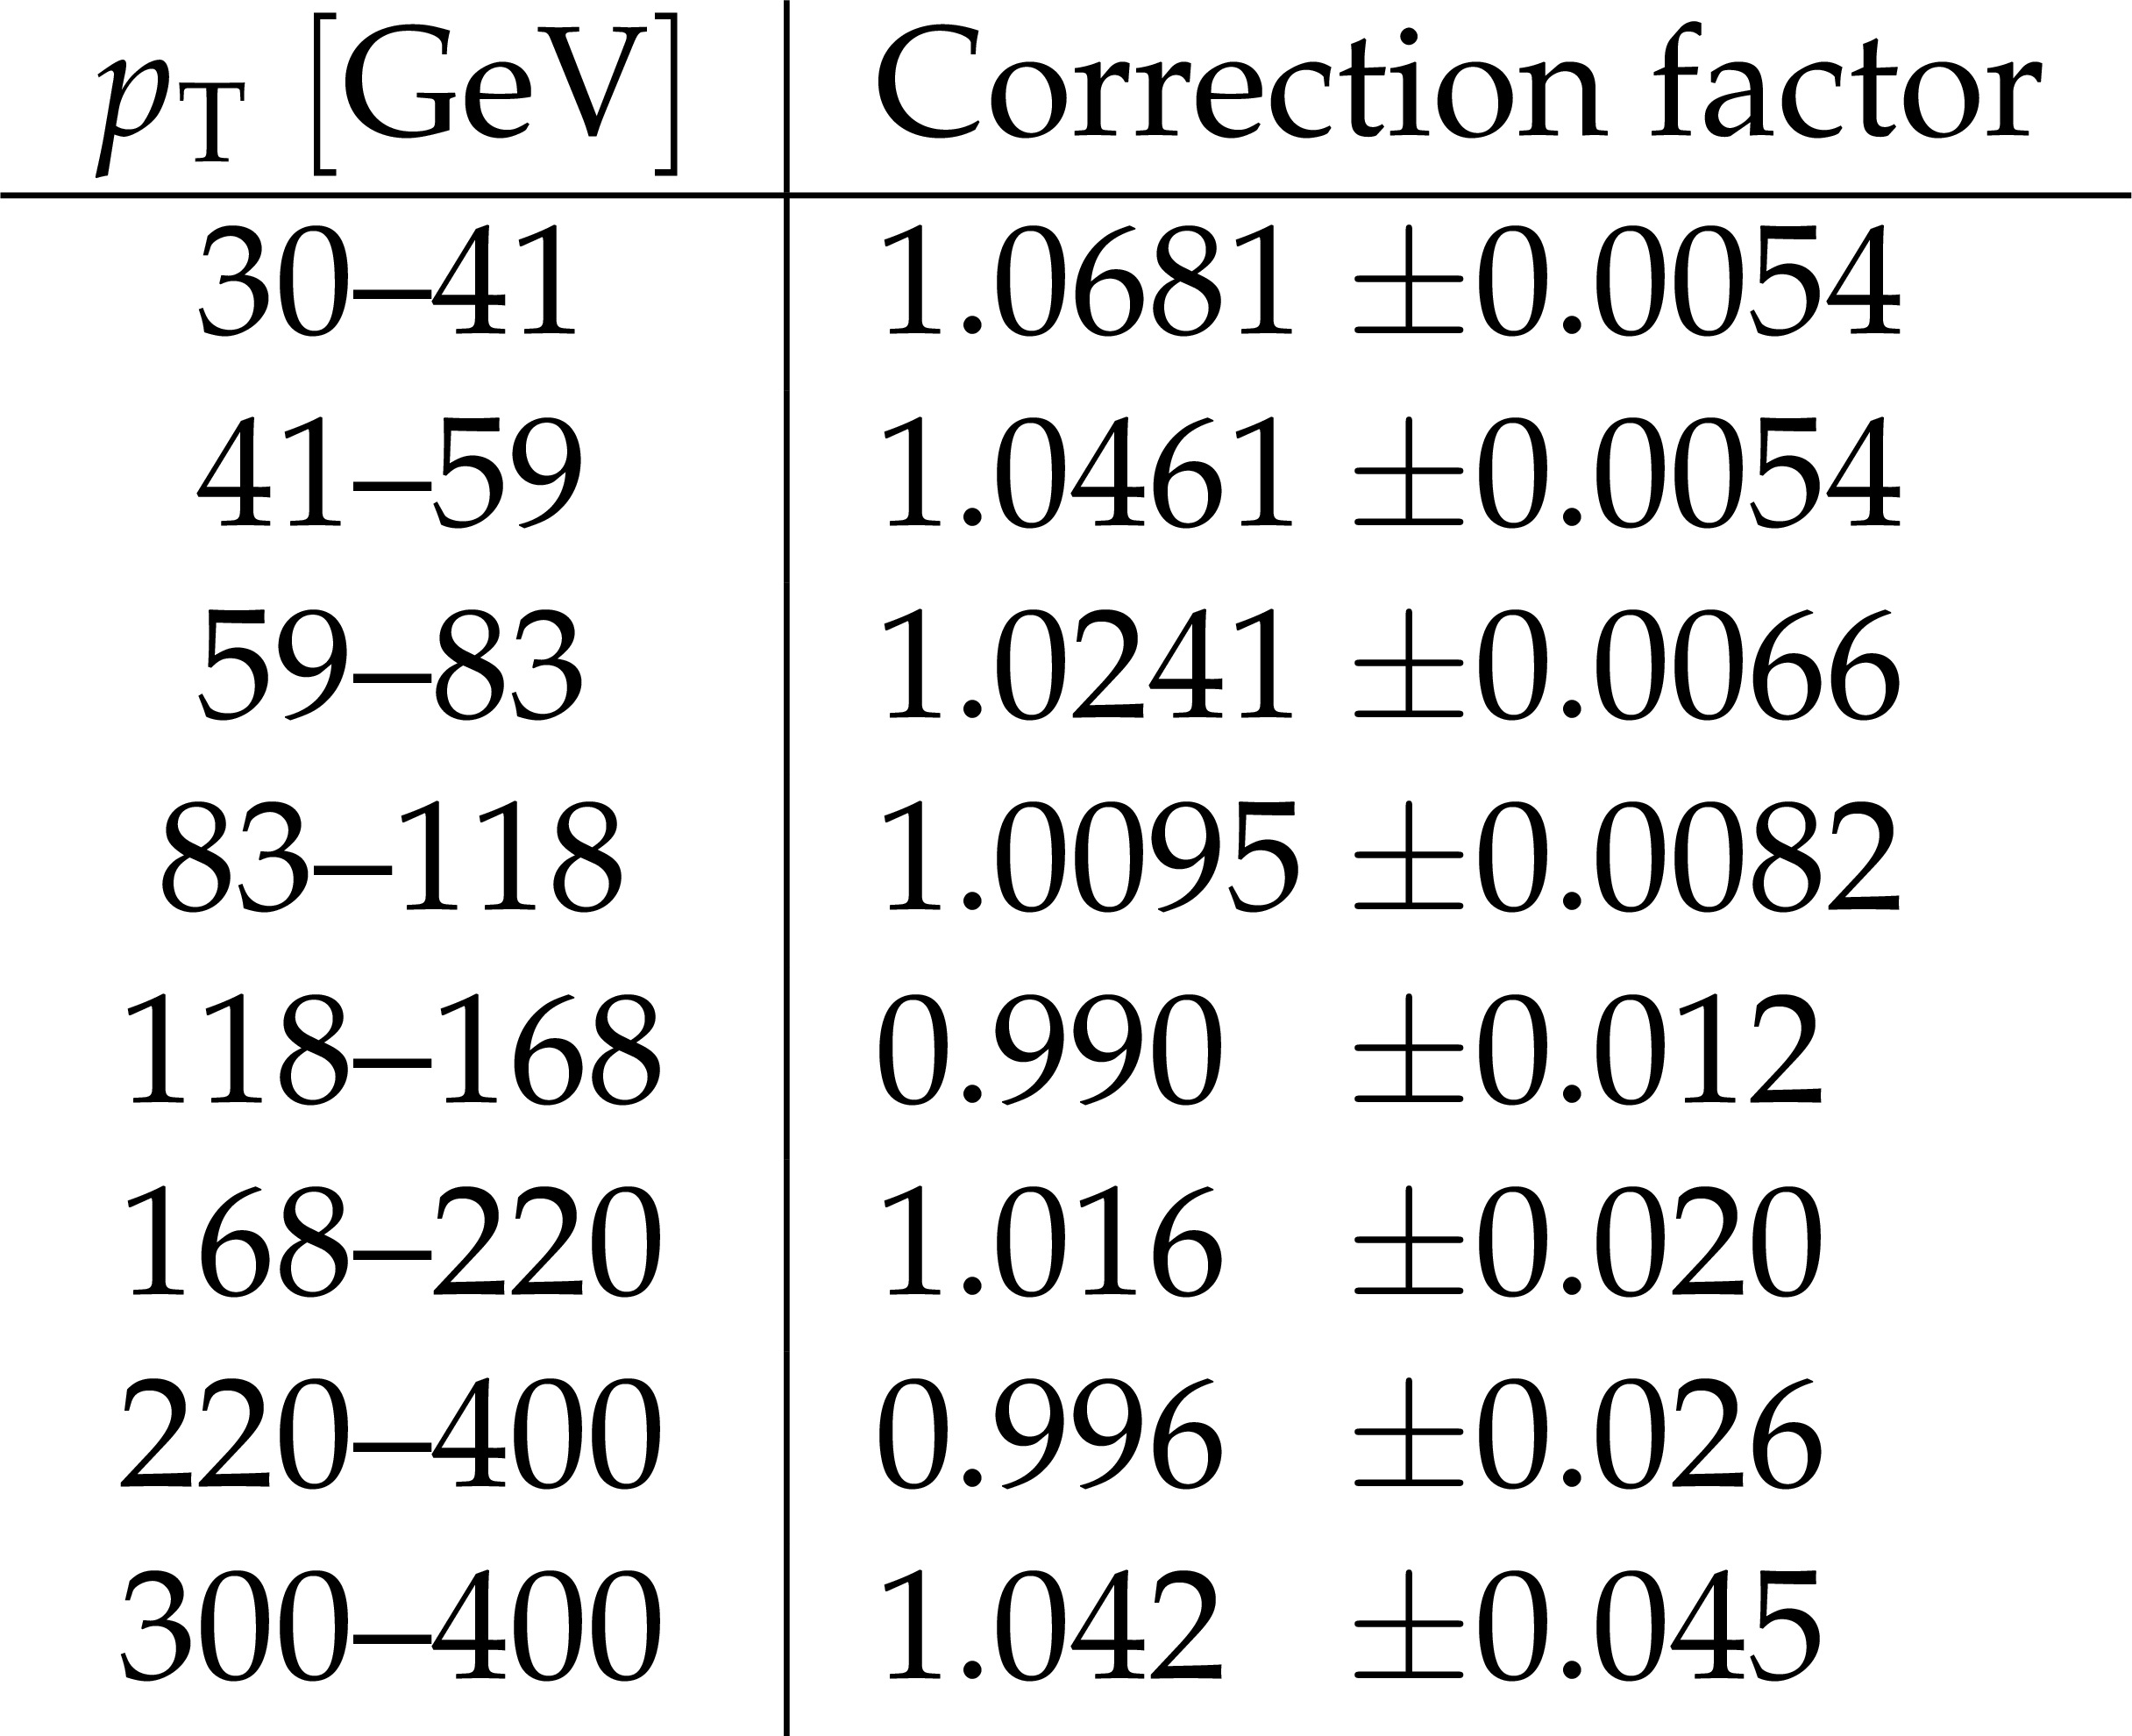
Additional Table 1:
Correction factor for hadronization and underlying events calculated from the FxFx merged Z$+$0,1,2 jets NLO sample generated with MG5-aMC@NLO and Pythia8 and applied to the Z$+$1 jet NNLO prediction of the leading jet transverse momentum spectrum. The CUETP8M1 Pythia8 tune is used. The correction is obtained by turning off the hadronization and the multiparton interaction in the event generation and taking the ratio of the cross sections before and after turning them off. |
png pdf |
Additional Table 2:
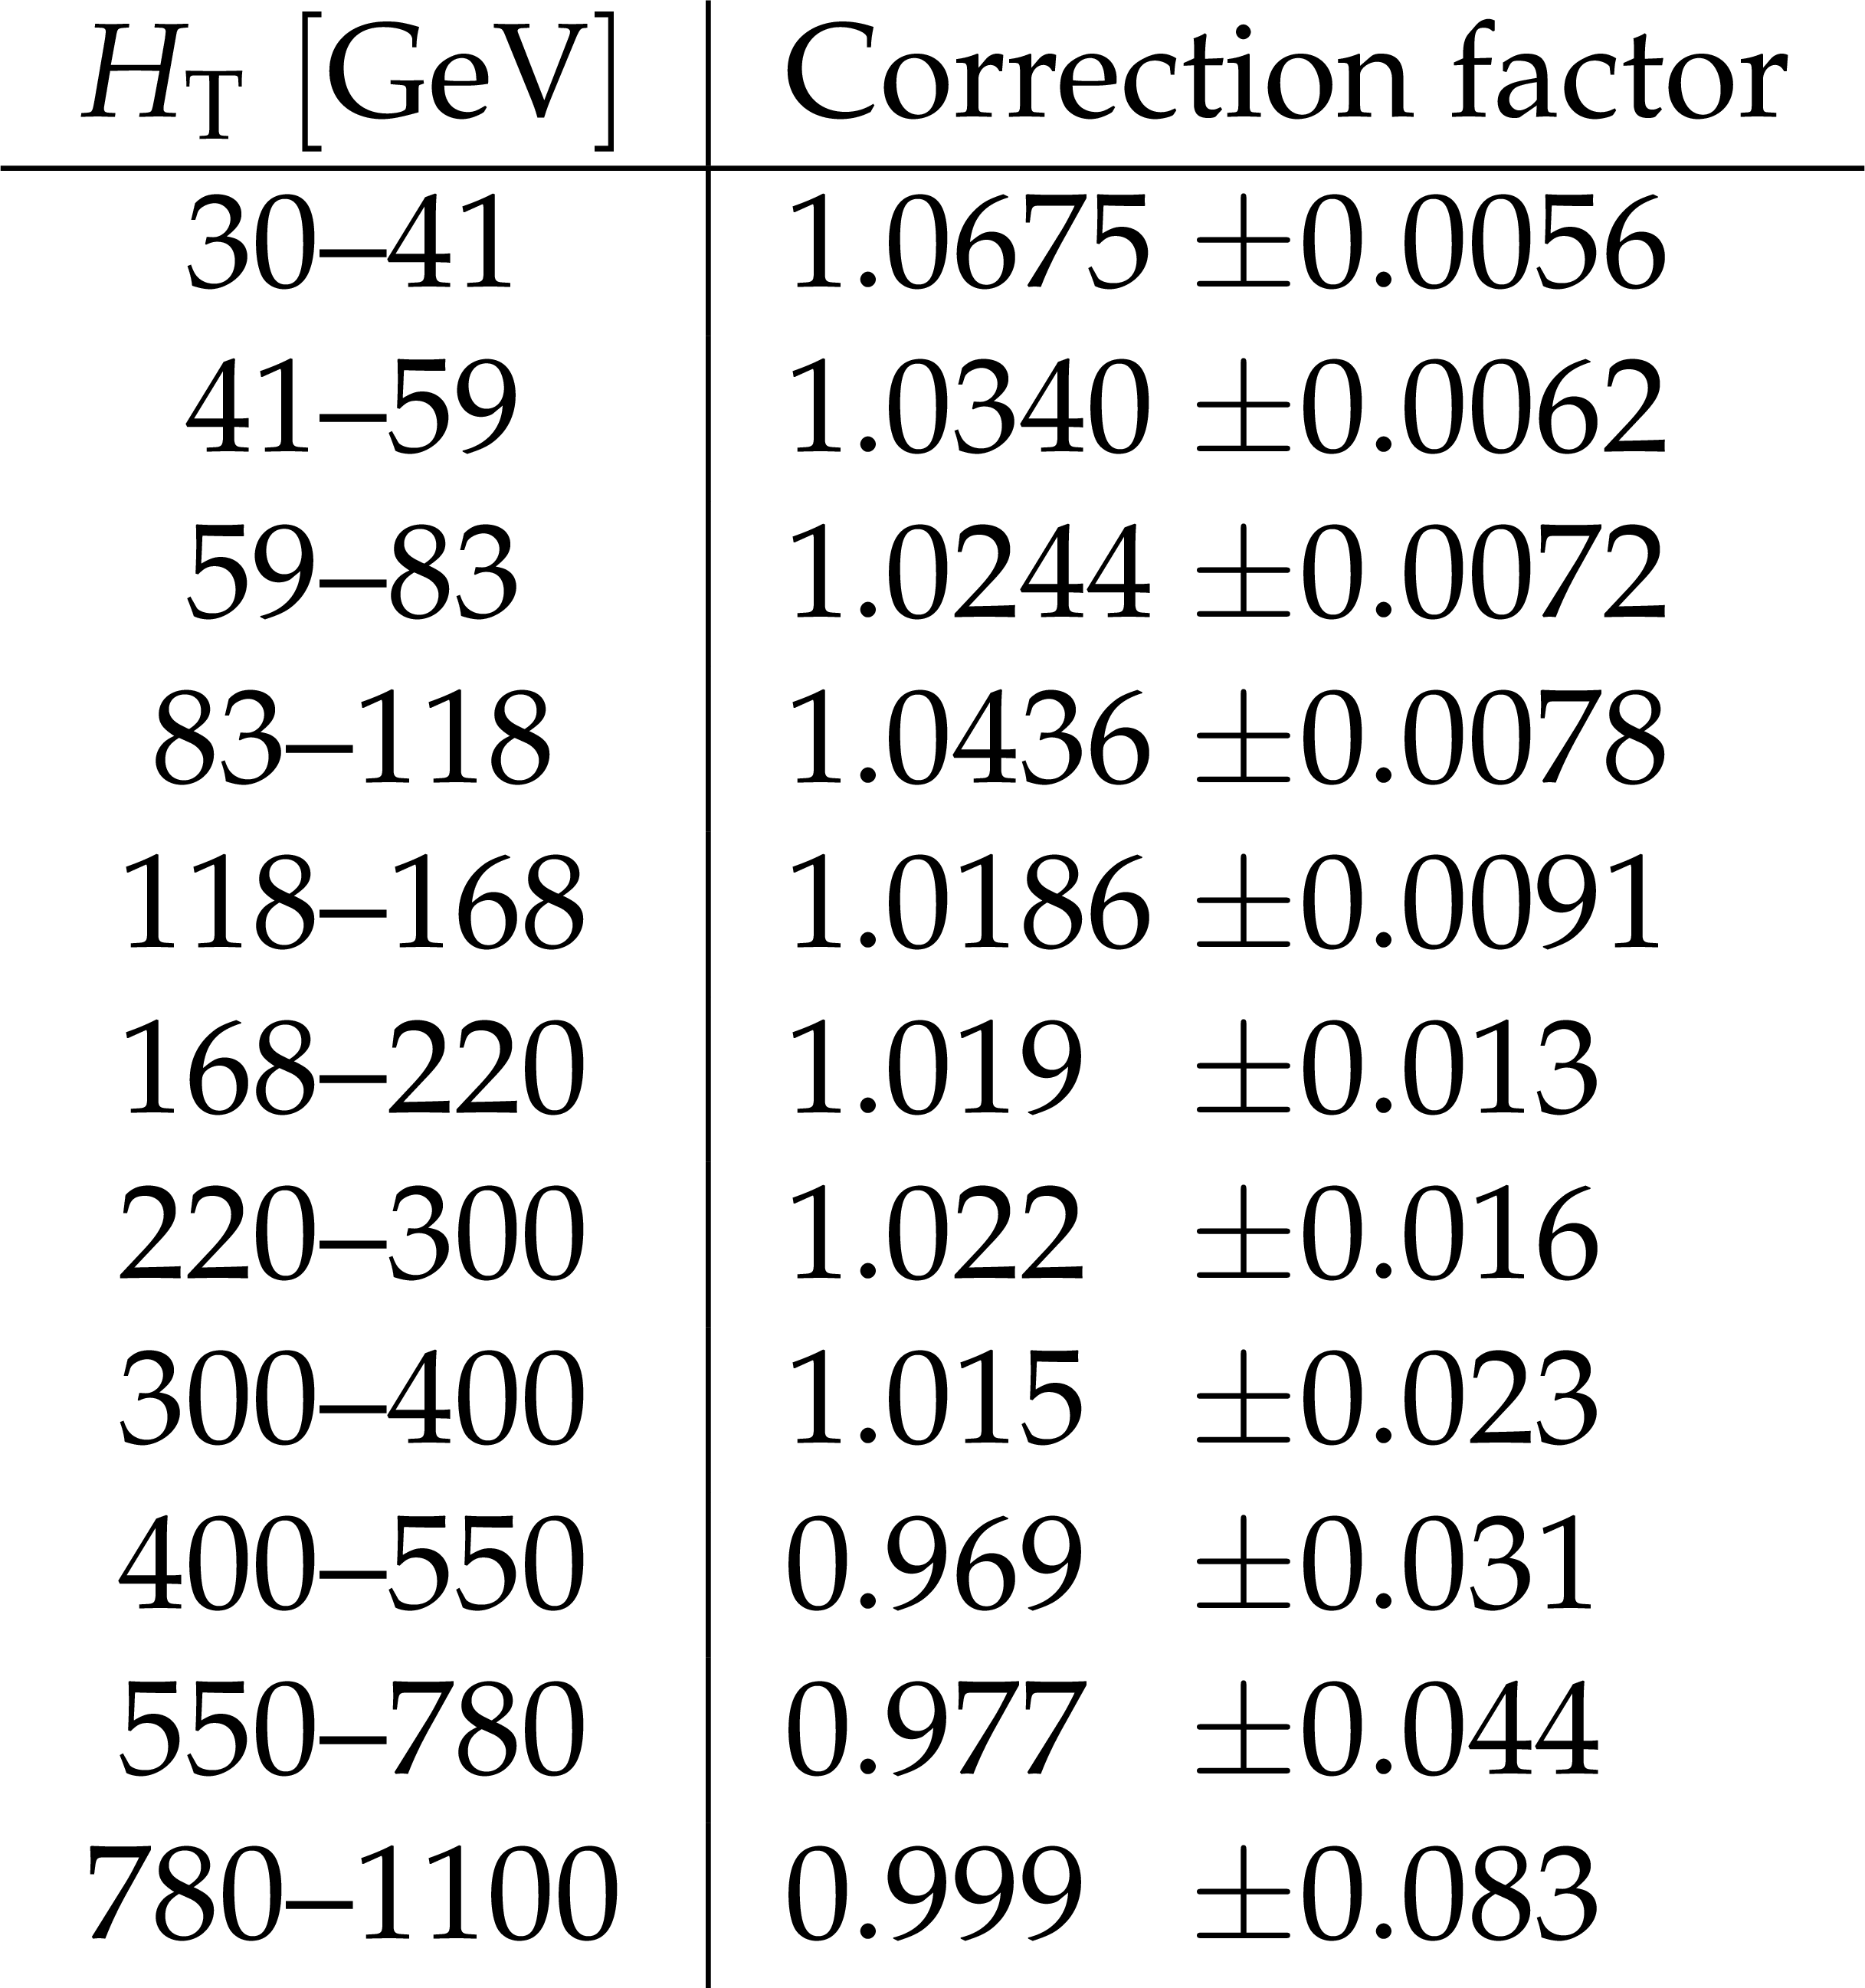
Correction factor for hadronization and underlying events calculated from the FxFx merged Z$+$0,1,2 jets NLO sample generated with MG5-aMC@NLO and Pythia8 and applied to the Z$+$1 jet NNLO prediction of the $H_\text {T}$ spectrum. The CUETP8M1 Pythia8 tune is used. The correction is obtained by turning off the hadronization and the multiparton interaction in the event generation and taking the ratio of the cross sections before and after turning them off. |

png pdf |
Additional Table 3:
Correction factor for hadronization and underlying events calculated from the FxFx merged Z$+$0,1,2 jets NLO sample generated with MG5-aMC@NLO and Pythia8 and applied to the Z$+$1 jet NNLO prediction of leading jet rapidity distribution. The CUETP8M1 Pythia8 tune is used. The correction is obtained by turning off the hadronization and the multiparton interaction in the event generation and taking the ratio of the cross sections before and after turning them off. |
png pdf |
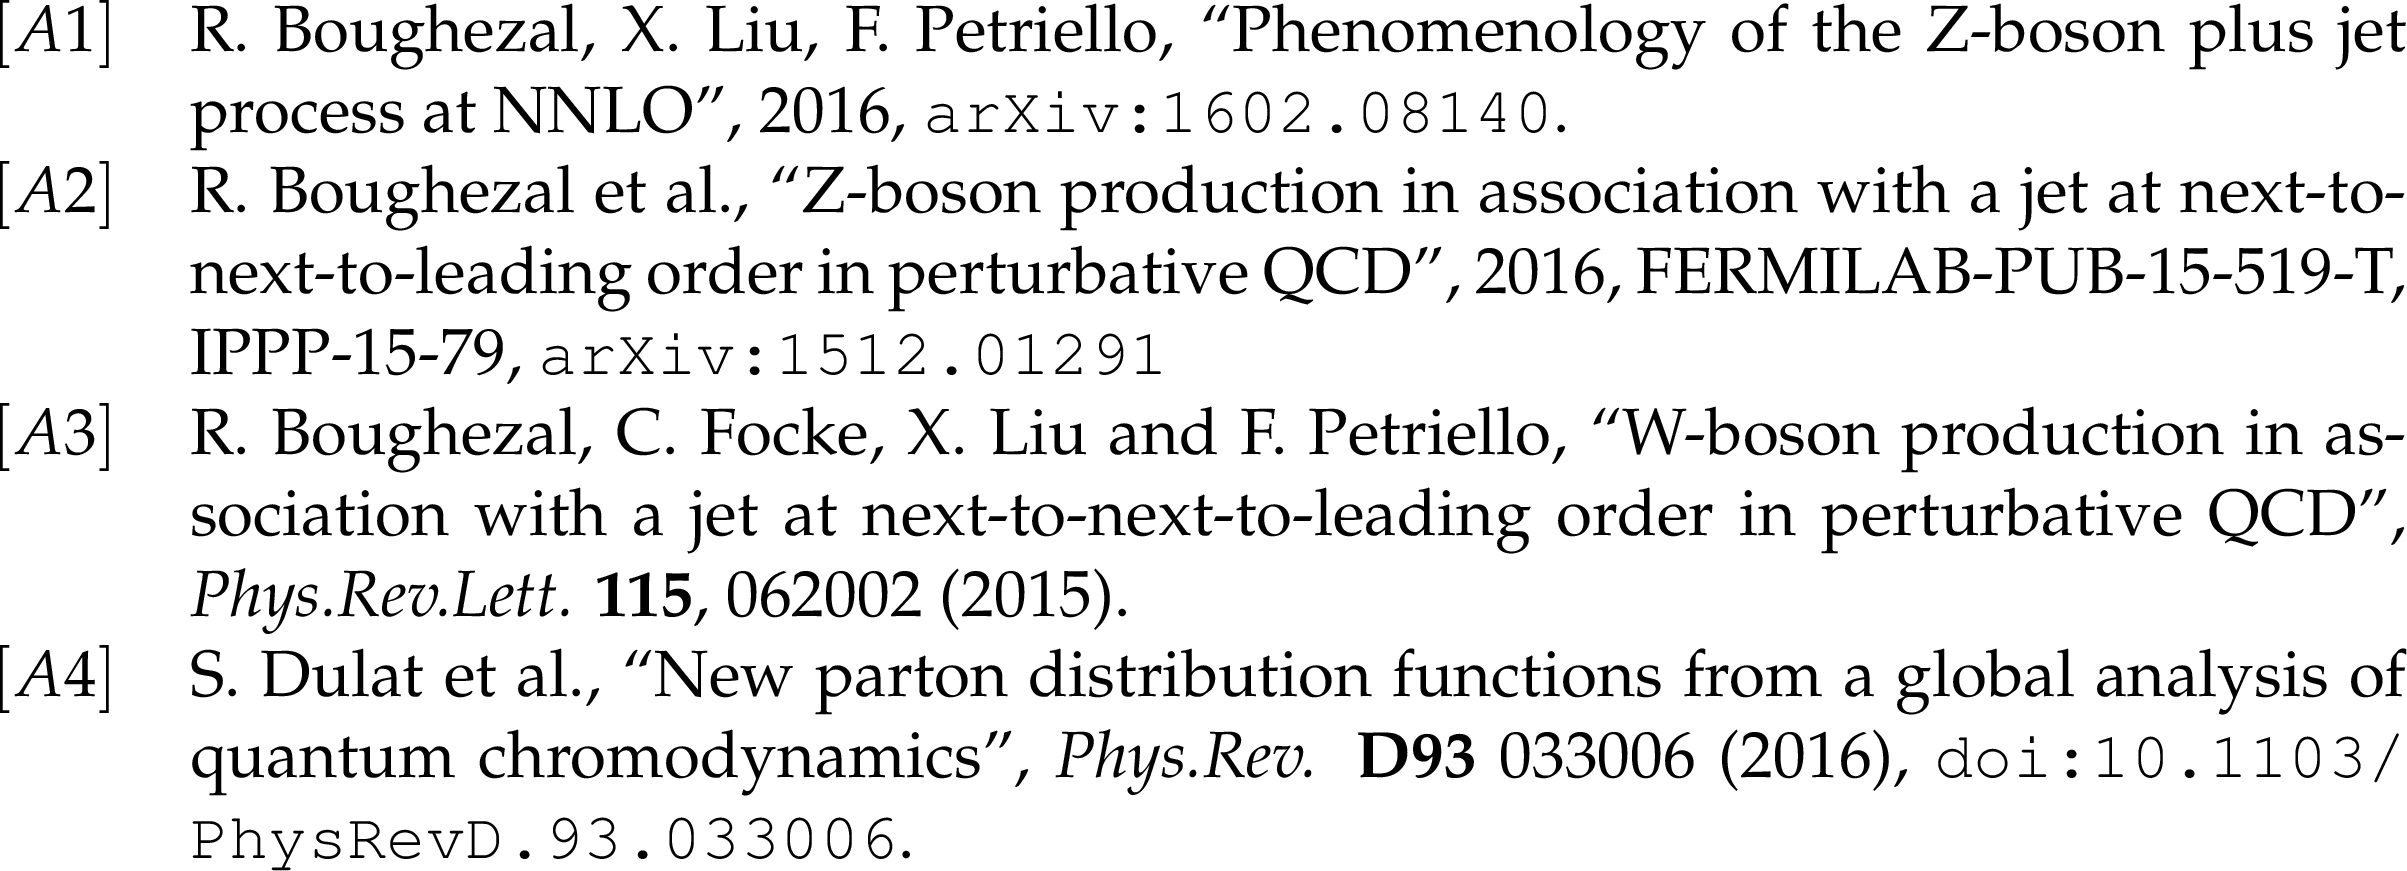
Additional Table 4:
Additional references for the auxiliary material. |
|
|
Compact Muon Solenoid LHC, CERN |
|

|

|

|

|

|