

Compact Muon Solenoid
LHC, CERN
| CMS-PAS-SMP-16-010 | ||
| Measurement of the differential jet production cross section with respect to jet mass and transverse momentum in dijet events from pp collisions at $\sqrt{s}= $ 13 TeV | ||
| CMS Collaboration | ||
| July 2017 | ||
| Abstract: A measurement of the differential jet production cross section as a function of the jet mass and transverse momentum is presented in events with a dijet topology, with and without a jet grooming algorithm applied that selectively removes low-energy portions from a jet. For ungroomed jets, all Monte Carlo event generators are found to predict the jet mass spectrum within uncertainties in the data for intermediate masses of about 10-30% of the jet transverse momentum. Outside of this range, some disagreement is observed. For groomed jets, the jet mass peak is suppressed and the precision in the low and intermediate regions improves, since the grooming algorithm removes the portions of the jet arising from soft radiation that are difficult to model. Semi-analytical calculations beyond next-to-leading logarithmic accuracy of the groomed jet mass are also compared to the data for the first time at a hadron collider. These calculations are found to predict the data within their uncertainties below a jet mass of about 30% of a jet's transverse momentum, where wide jets start to be split into two. Below jet masses of 20 GeV the predicted cross sections tend to be somewhat smaller than measured in data. | ||
|
Links:
CDS record (PDF) ;
inSPIRE record ;
CADI line (restricted) ;
These preliminary results are superseded in this paper, JHEP 11 (2018) 113. The superseded preliminary plots can be found here. |
||
| Figures | |
png pdf |
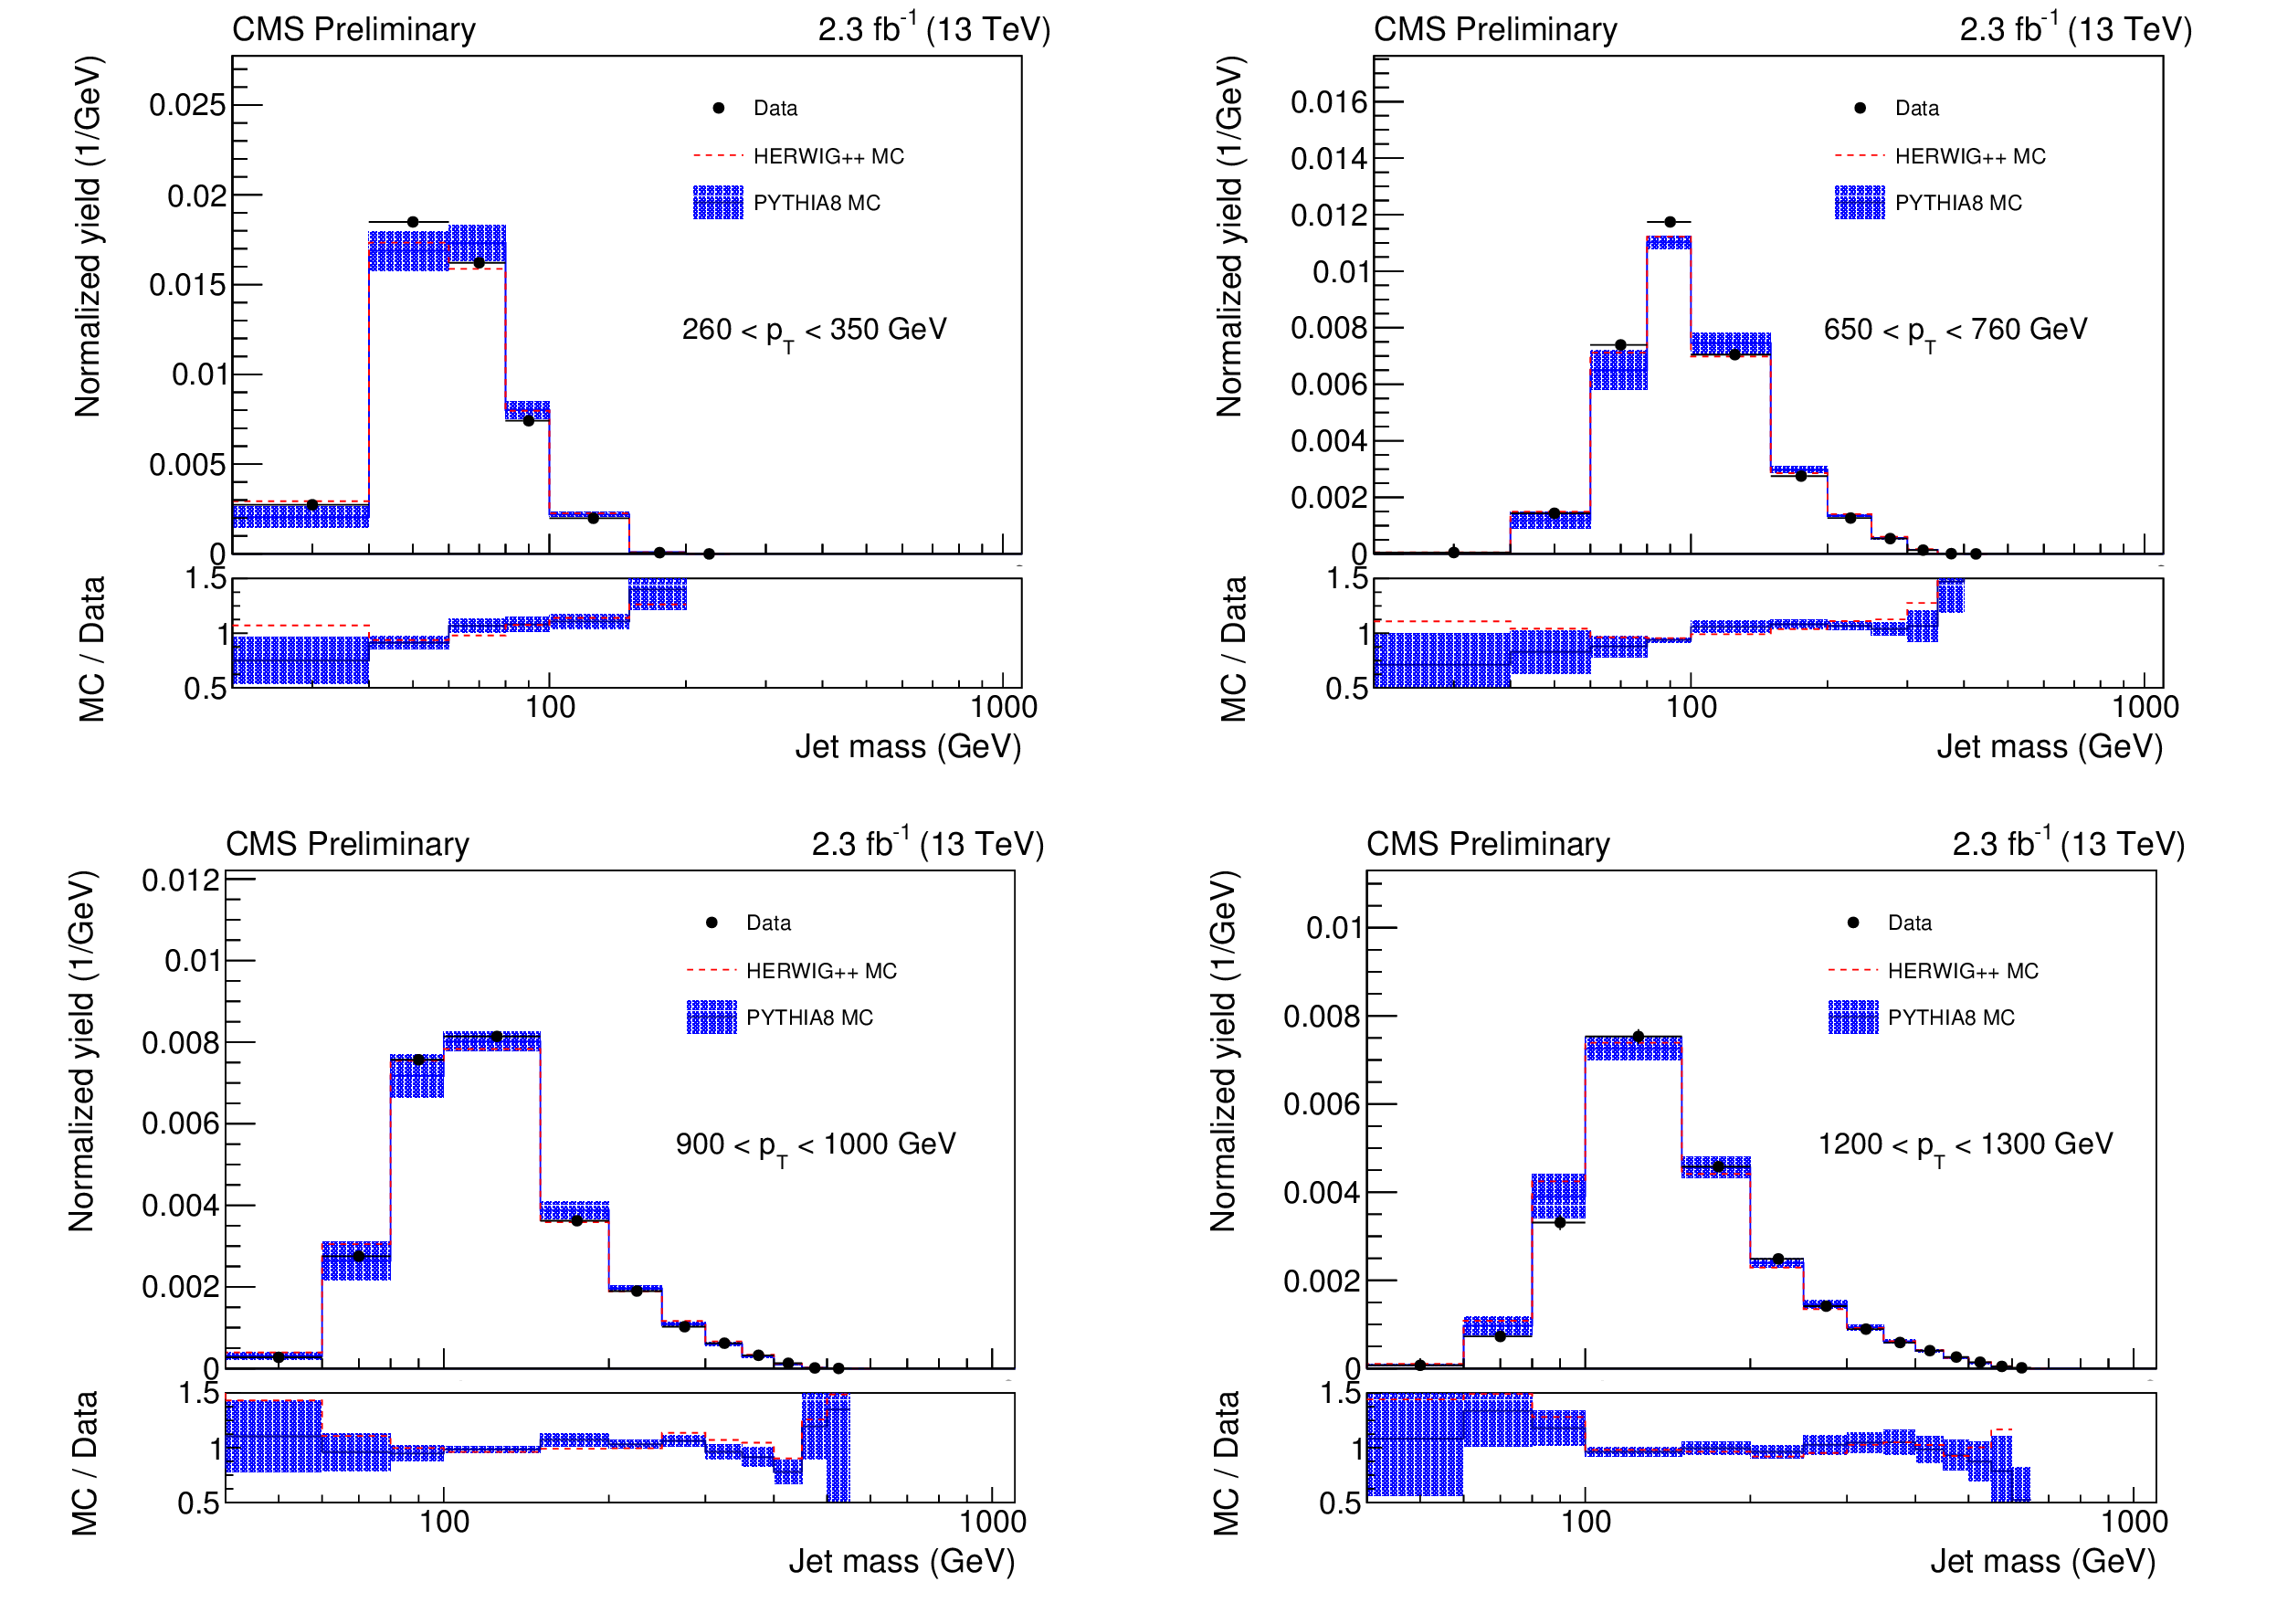
Figure 1:
Comparison of data to MC simulation for ungroomed jets for various $ {p_{\mathrm {T}}} $ bins at the detector level. The data are shown in black points along with their statistical uncertainties and the experimental systematic uncertainties. The PYTHIA8 results before unfolding are shown as a blue histogram, including systematic uncertainties from the simulation before unfolding in the hatched blue area. The HERWIG++ results before unfolding are shown without uncertainties as a dashed red histogram. |
png pdf |
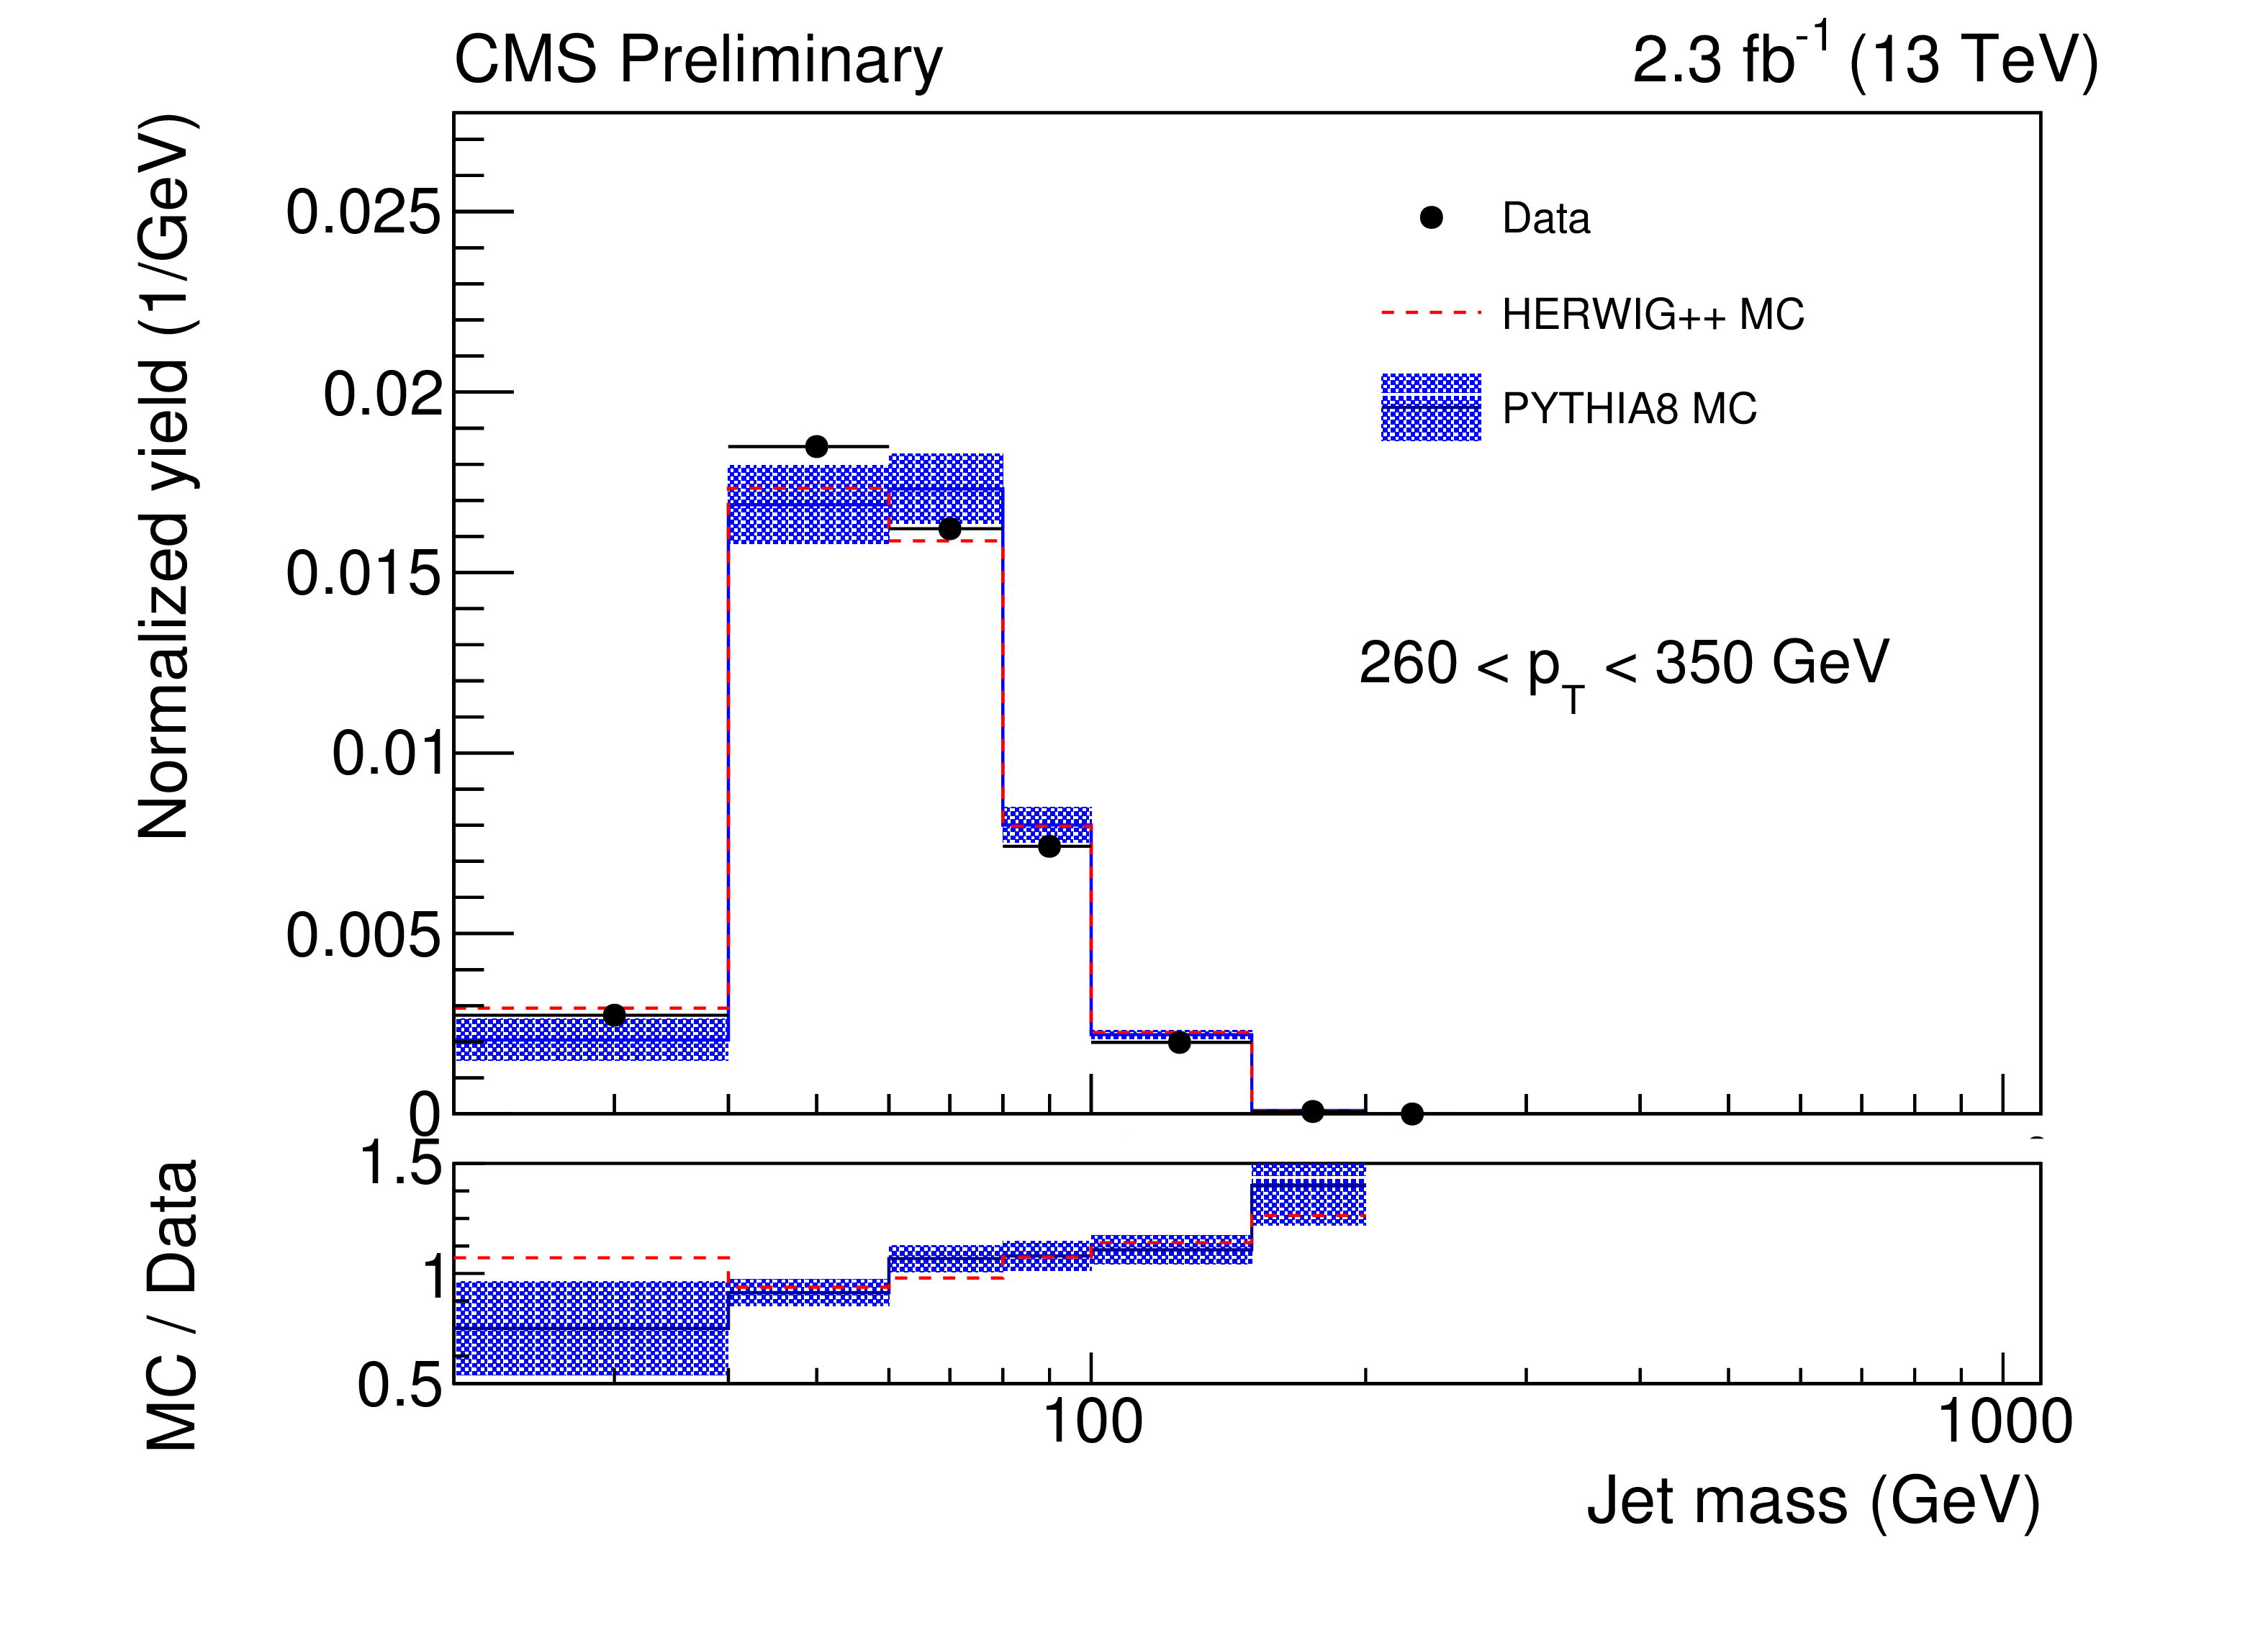
Figure 1-a:
Comparison of data to MC simulation for ungroomed jets for $ {p_{\mathrm {T}}} $ bin 260 $ < {p_{\mathrm {T}}} < $ 350 GeV at the detector level. The data are shown in black points along with their statistical uncertainties and the experimental systematic uncertainties. The PYTHIA8 results before unfolding are shown as a blue histogram, including systematic uncertainties from the simulation before unfolding in the hatched blue area. The HERWIG++ results before unfolding are shown without uncertainties as a dashed red histogram. |

png pdf |
Figure 1-b:
Comparison of data to MC simulation for ungroomed jets for $ {p_{\mathrm {T}}} $ bin 650 $ < {p_{\mathrm {T}}} < $ 760 GeV at the detector level. The data are shown in black points along with their statistical uncertainties and the experimental systematic uncertainties. The PYTHIA8 results before unfolding are shown as a blue histogram, including systematic uncertainties from the simulation before unfolding in the hatched blue area. The HERWIG++ results before unfolding are shown without uncertainties as a dashed red histogram. |

png pdf |
Figure 1-c:
Comparison of data to MC simulation for ungroomed jets for $ {p_{\mathrm {T}}} $ bin 900 $ < {p_{\mathrm {T}}} < $ 1000 GeV at the detector level. The data are shown in black points along with their statistical uncertainties and the experimental systematic uncertainties. The PYTHIA8 results before unfolding are shown as a blue histogram, including systematic uncertainties from the simulation before unfolding in the hatched blue area. The HERWIG++ results before unfolding are shown without uncertainties as a dashed red histogram. |

png pdf |
Figure 1-d:
Comparison of data to MC simulation for ungroomed jets for $ {p_{\mathrm {T}}} $ bin 1200 $ < {p_{\mathrm {T}}} < $ 1300 GeV at the detector level. The data are shown in black points along with their statistical uncertainties and the experimental systematic uncertainties. The PYTHIA8 results before unfolding are shown as a blue histogram, including systematic uncertainties from the simulation before unfolding in the hatched blue area. The HERWIG++ results before unfolding are shown without uncertainties as a dashed red histogram. |

png pdf |
Figure 2:
Comparison of data to MC simulation for groomed jets for various $ {p_{\mathrm {T}}} $ bins at the detector level. The data are shown in black points along with their statistical uncertainties and the experimental systematic uncertainties. The PYTHIA8 results before unfolding are shown as a blue histogram, including systematic uncertainties from the simulation before unfolding in the hatched blue area. The HERWIG++ results before unfolding are shown without uncertainties as a dashed red histogram. |

png pdf |
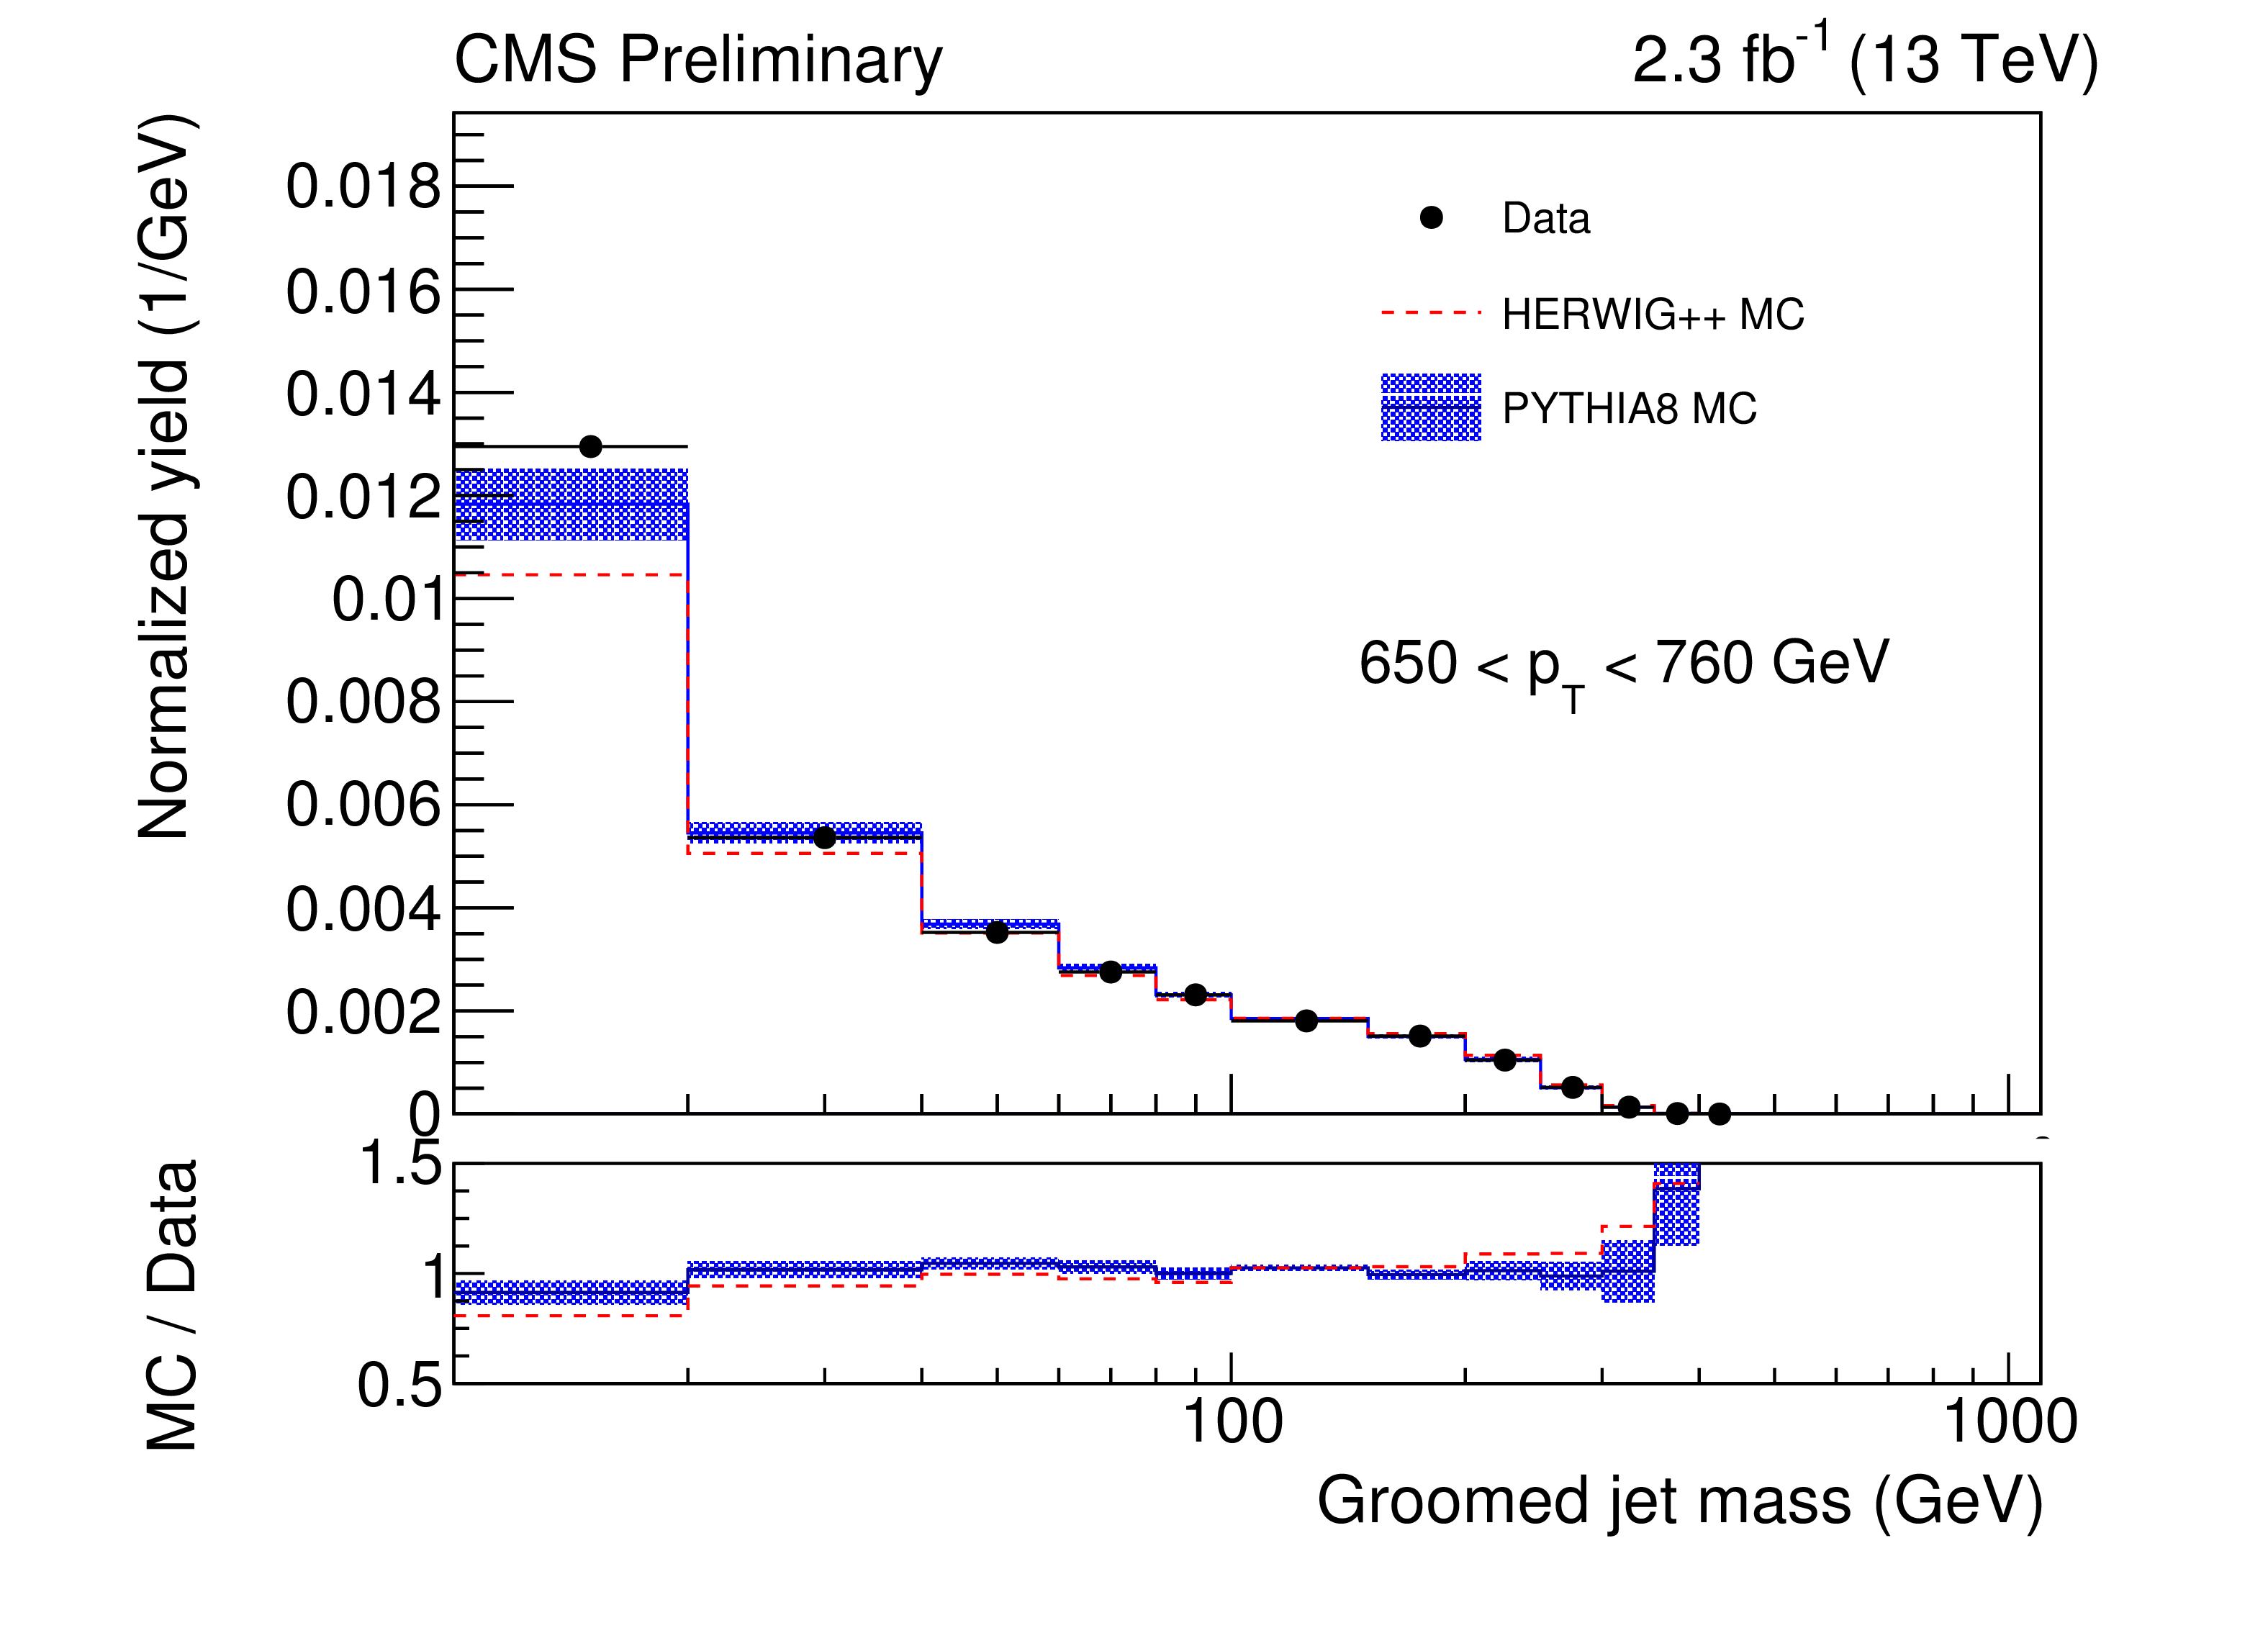
Figure 2-a:
Comparison of data to MC simulation for groomed jets for $ {p_{\mathrm {T}}} $ bin 260 $ < {p_{\mathrm {T}}} < $ 350 GeV at the detector level. The data are shown in black points along with their statistical uncertainties and the experimental systematic uncertainties. The PYTHIA8 results before unfolding are shown as a blue histogram, including systematic uncertainties from the simulation before unfolding in the hatched blue area. The HERWIG++ results before unfolding are shown without uncertainties as a dashed red histogram. |
png pdf |
Figure 2-b:
Comparison of data to MC simulation for groomed jets for $ {p_{\mathrm {T}}} $ bin 650 $ < {p_{\mathrm {T}}} < $ 760 GeV at the detector level. The data are shown in black points along with their statistical uncertainties and the experimental systematic uncertainties. The PYTHIA8 results before unfolding are shown as a blue histogram, including systematic uncertainties from the simulation before unfolding in the hatched blue area. The HERWIG++ results before unfolding are shown without uncertainties as a dashed red histogram. |

png pdf |
Figure 2-c:
Comparison of data to MC simulation for groomed jets for $ {p_{\mathrm {T}}} $ bin 900 $ < {p_{\mathrm {T}}} < $ 1000 GeV at the detector level. The data are shown in black points along with their statistical uncertainties and the experimental systematic uncertainties. The PYTHIA8 results before unfolding are shown as a blue histogram, including systematic uncertainties from the simulation before unfolding in the hatched blue area. The HERWIG++ results before unfolding are shown without uncertainties as a dashed red histogram. |

png pdf |
Figure 2-d:
Comparison of data to MC simulation for groomed jets for $ {p_{\mathrm {T}}} $ bin 1200 $ < {p_{\mathrm {T}}} < $ 1300 GeV at the detector level. The data are shown in black points along with their statistical uncertainties and the experimental systematic uncertainties. The PYTHIA8 results before unfolding are shown as a blue histogram, including systematic uncertainties from the simulation before unfolding in the hatched blue area. The HERWIG++ results before unfolding are shown without uncertainties as a dashed red histogram. |
png pdf |
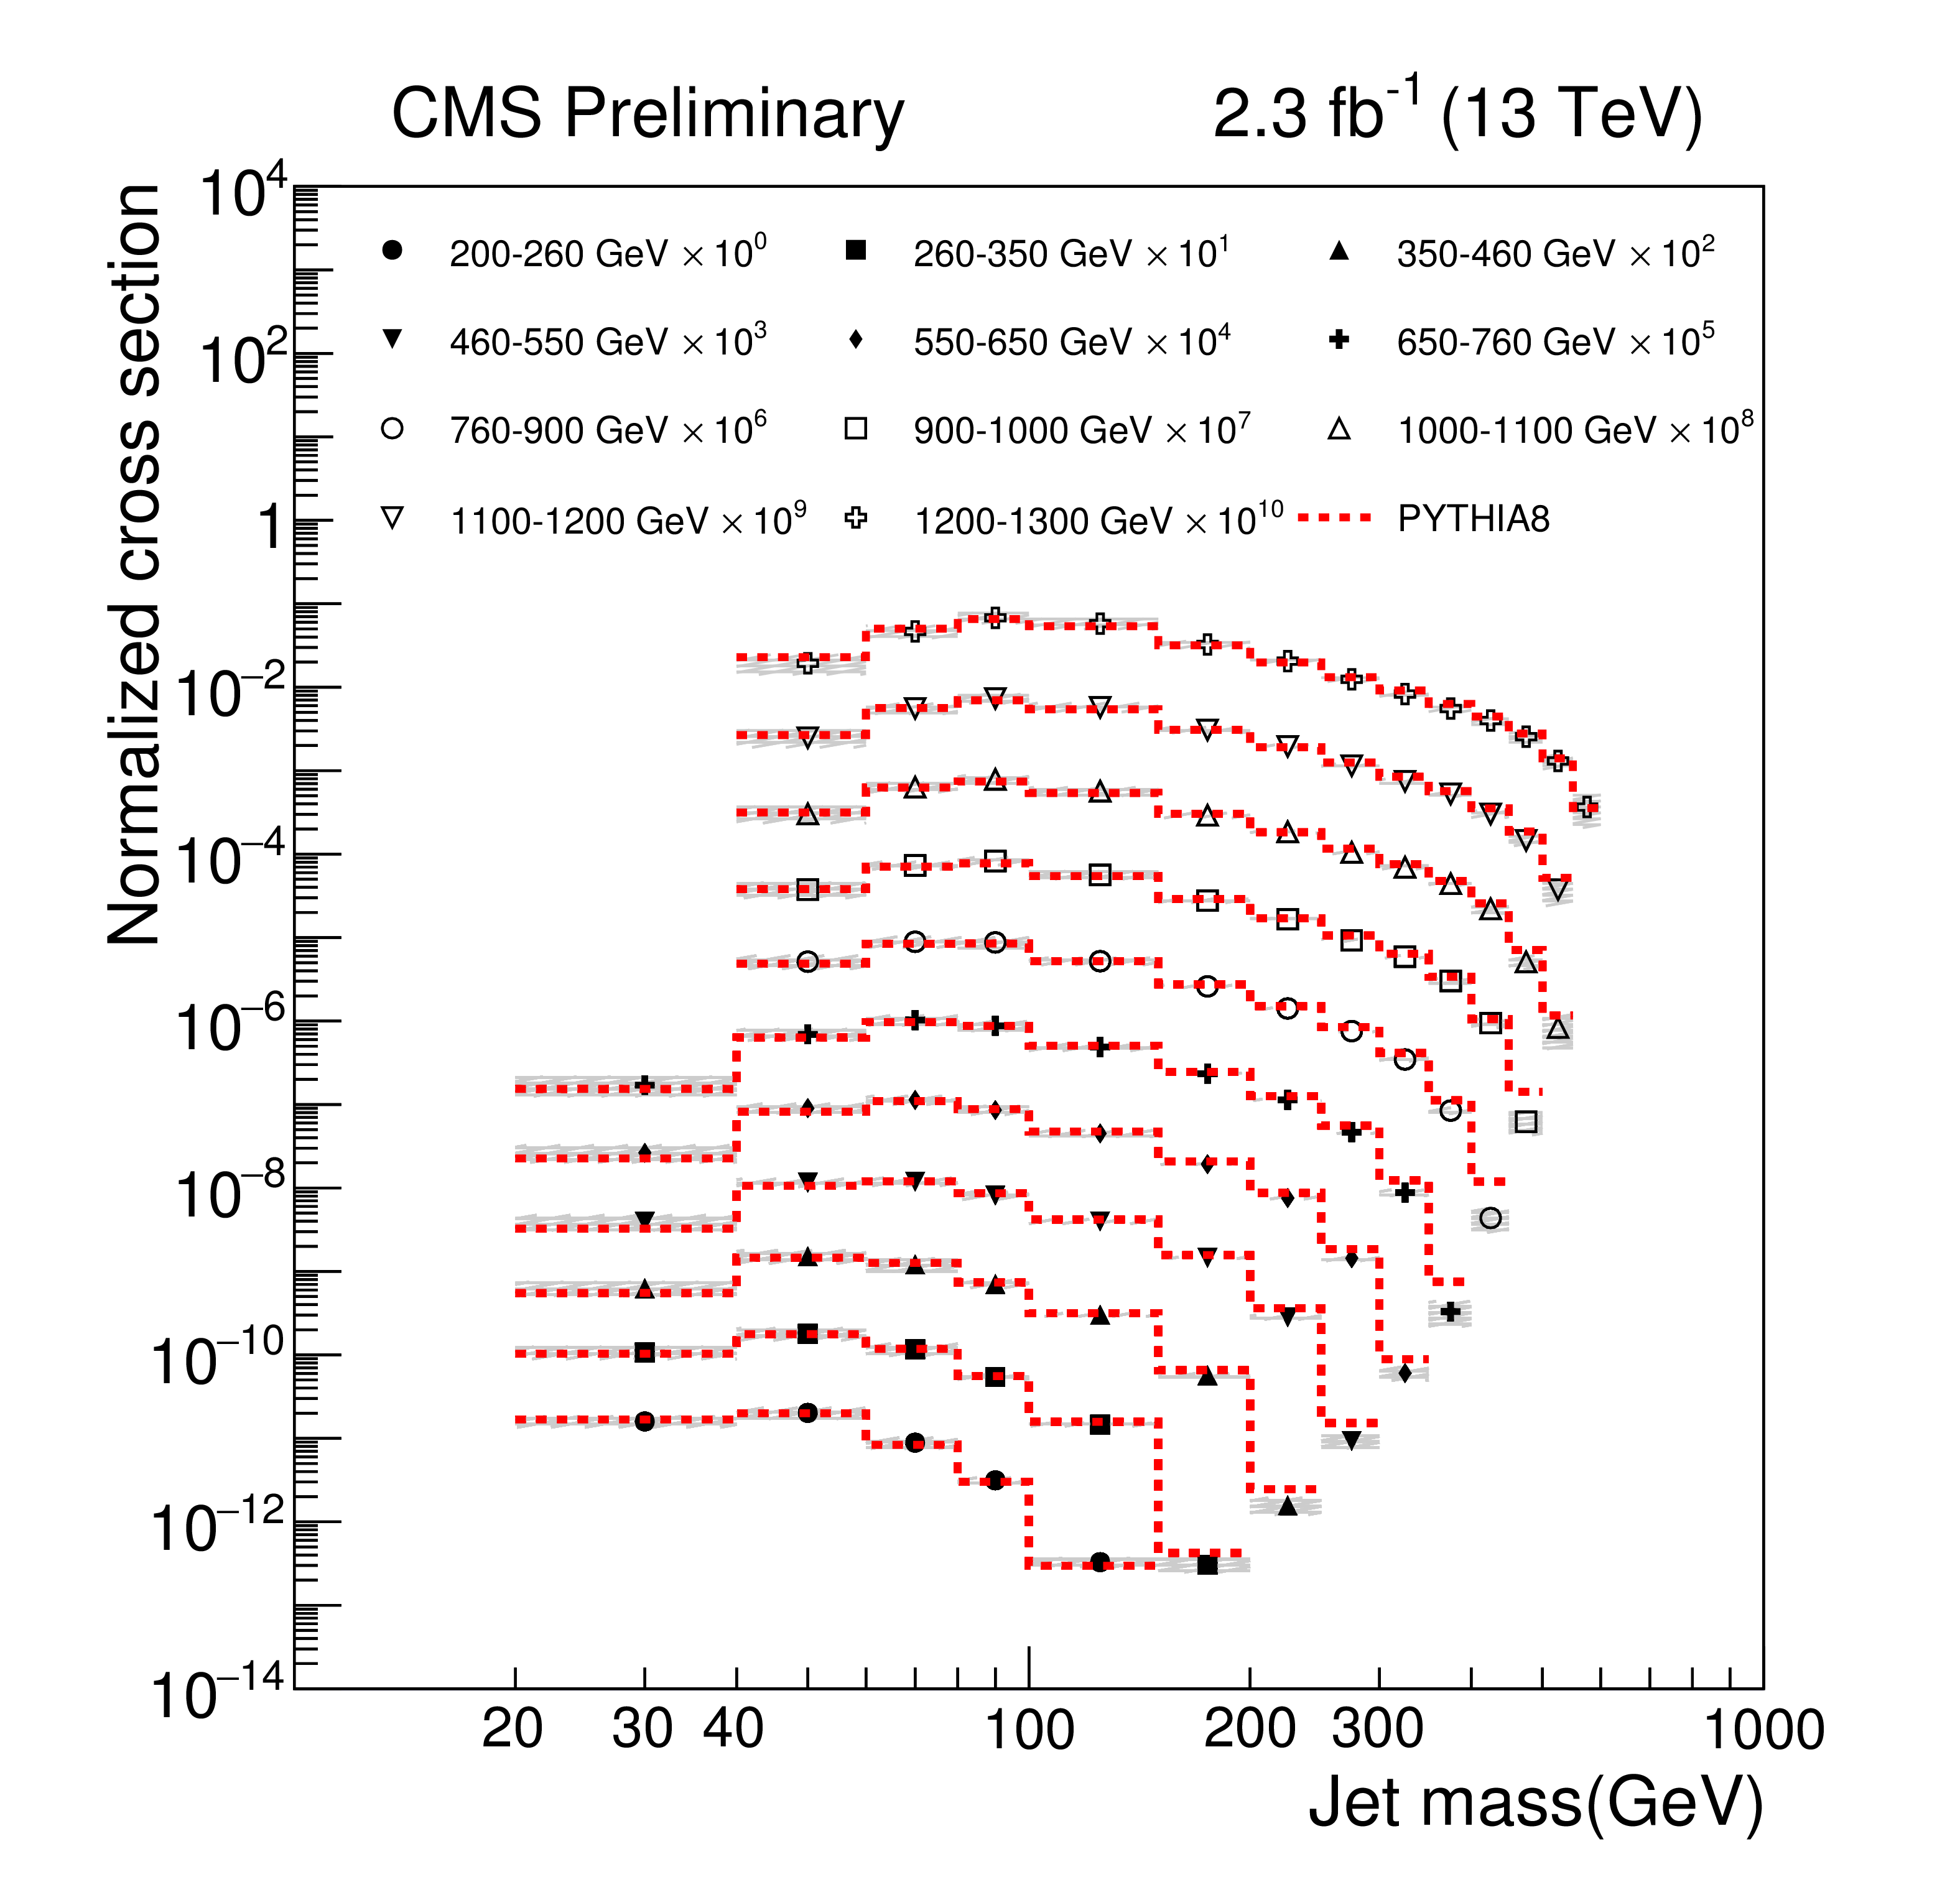
Figure 3:
Results of unfolding ungroomed jets for all $ {p_{\mathrm {T}}} $ bins. Bins with total uncertainty larger than 60% are not shown. The data are shown in markers for each $ {p_{\mathrm {T}}} $ bin, scaled by a factor for better visibility. The total uncertainties (statistical added to systematic in quadrature) are shown in grey bands. The predictions from PYTHIA8 are shown as a dashed red line. |
png pdf |
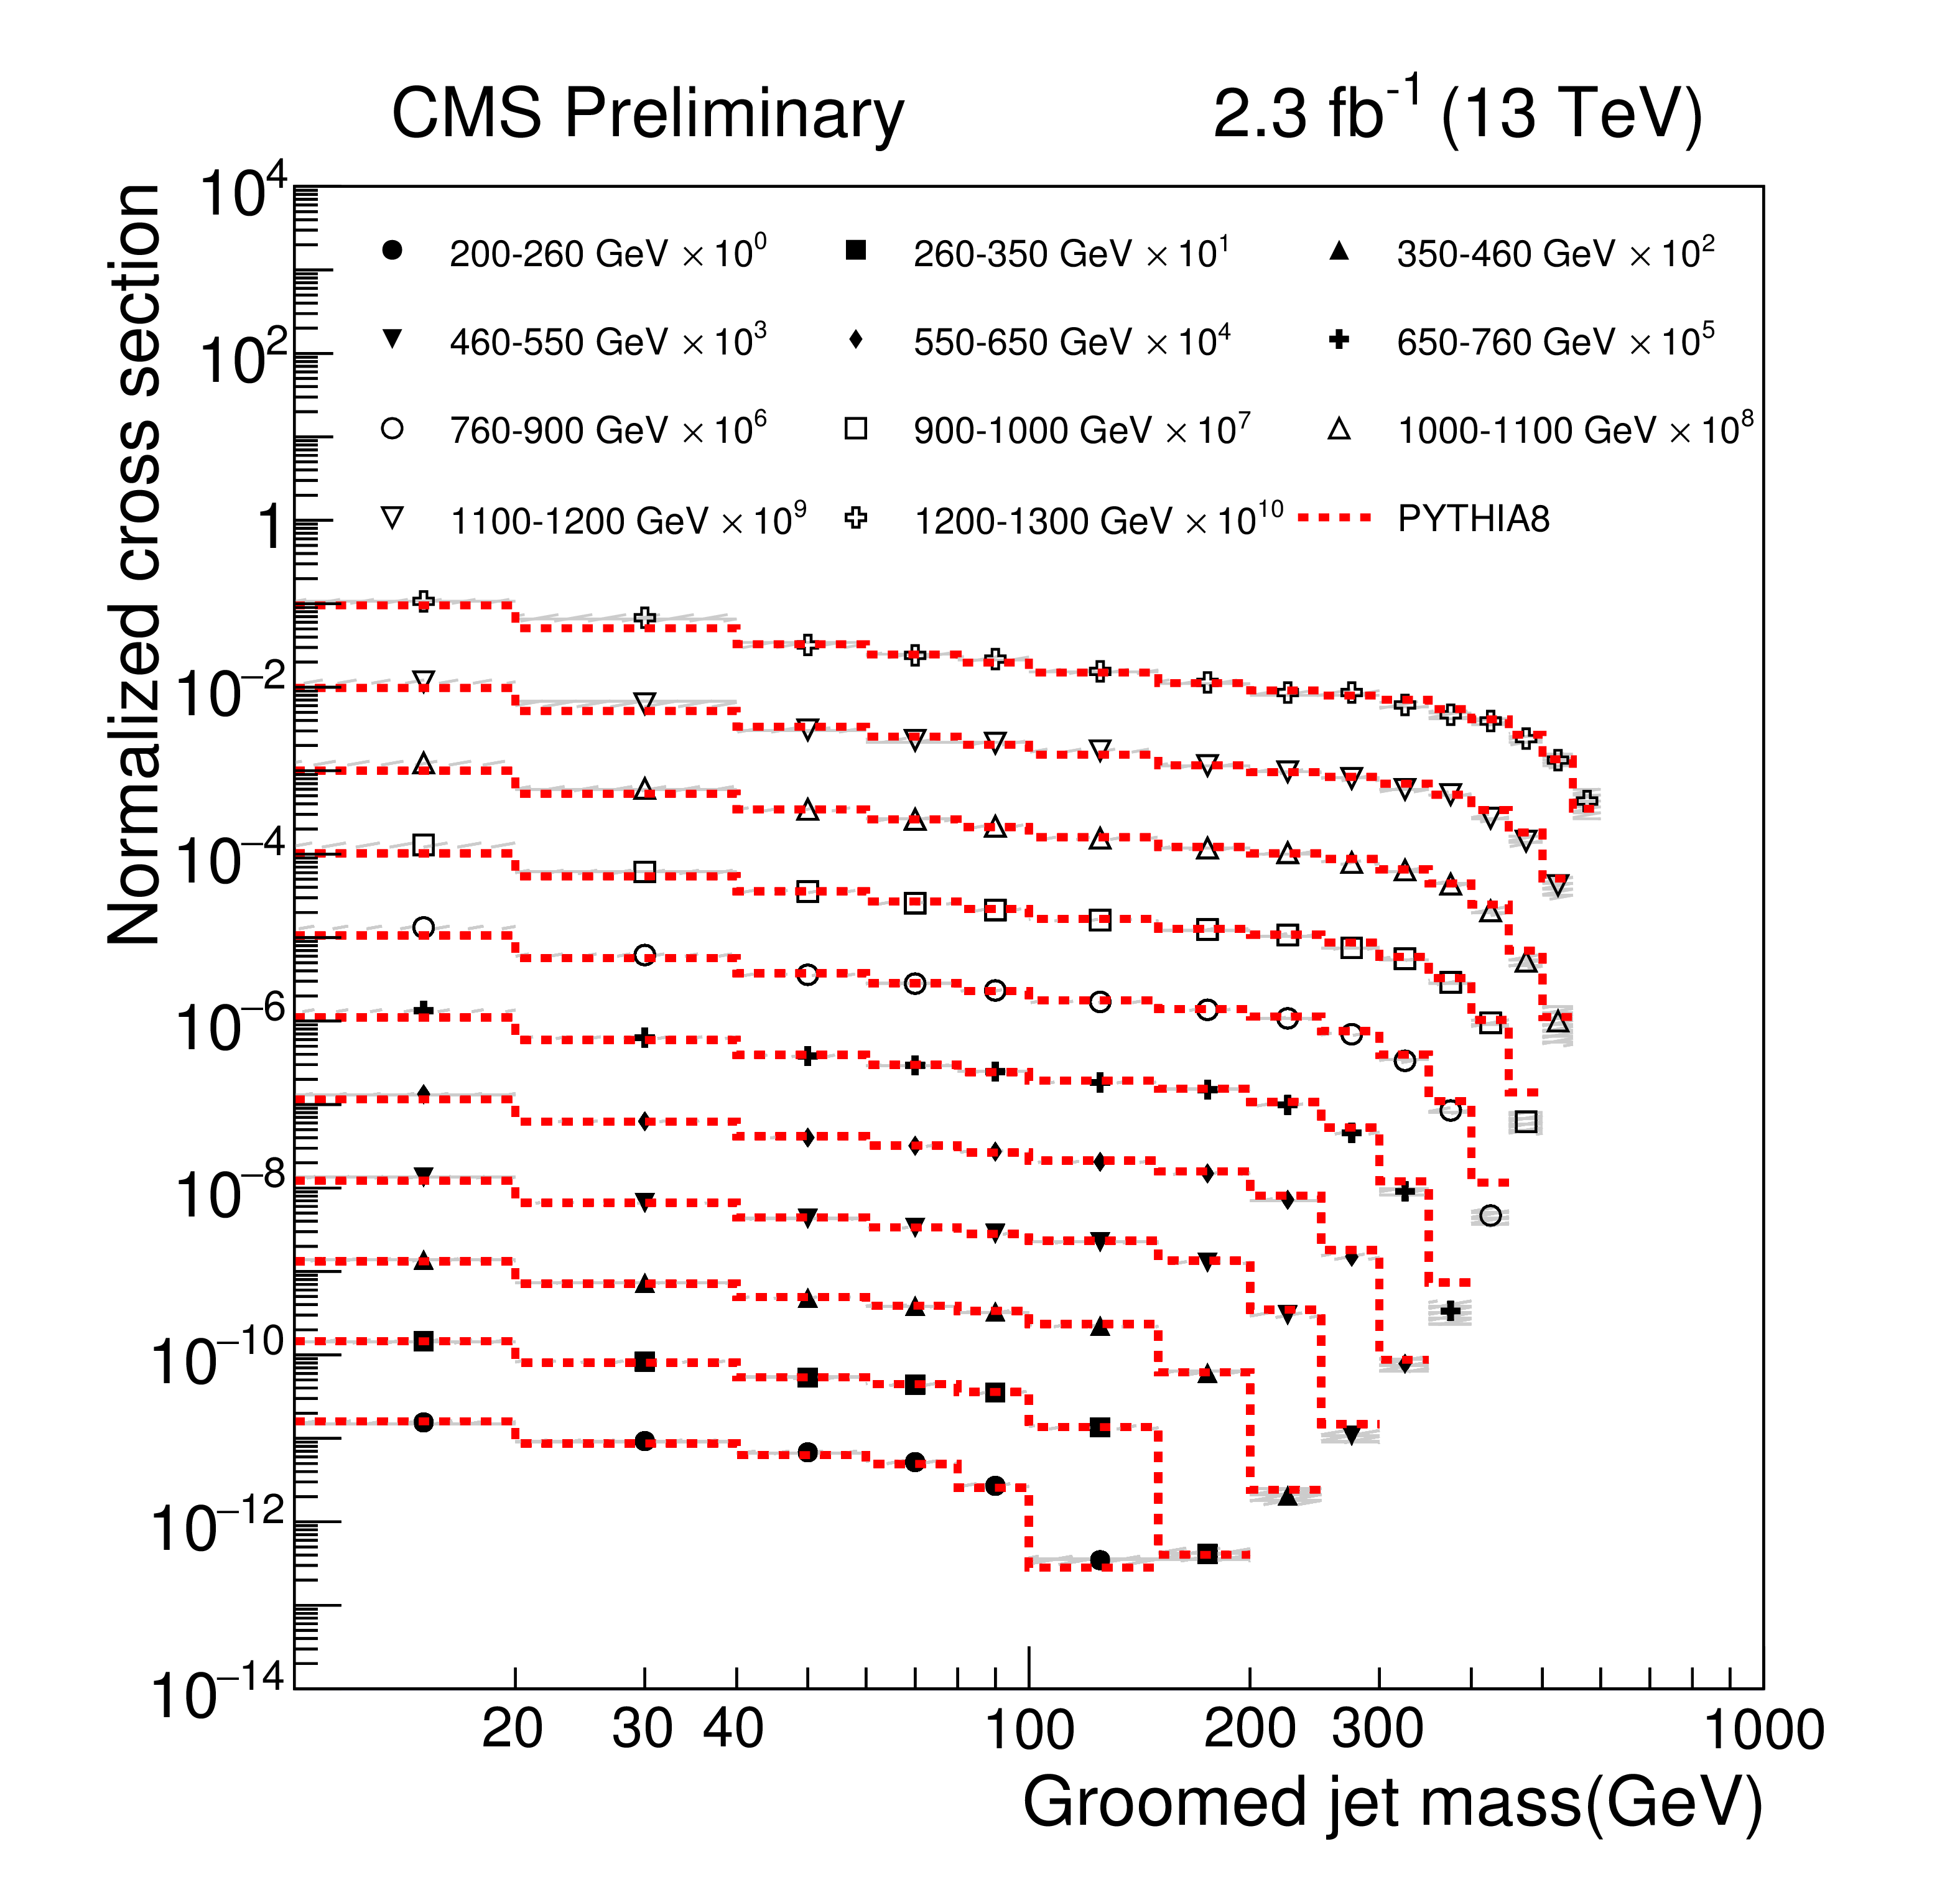
Figure 4:
Results of unfolding groomed jets for all $ {p_{\mathrm {T}}} $ bins. Bins with total uncertainty larger than 60% are not shown. The data are shown in markers for each $ {p_{\mathrm {T}}} $ bin, scaled by a factor for better visibility. The total uncertainties (statistical added to systematic in quadrature) are shown in grey bands. The predictions from PYTHIA8 are shown as a dashed red line. |

png pdf |
Figure 5:
Results of unfolding the ungroomed jets for various $ {p_{\mathrm {T}}} $ bins. The data are shown in black points, with dark grey bands for the statistical uncertainty (Stat. Unc.) and in light grey bands for the total uncertainty (Stat. + Sys. Unc., added in quadrature). The predictions from PYTHIA8, HERWIG++, and POWHEG+PYTHIA are shown in dashed black, dash-dot-dotted red, and dash-dotted green histograms, respectively, with no uncertainties shown. |

png pdf |
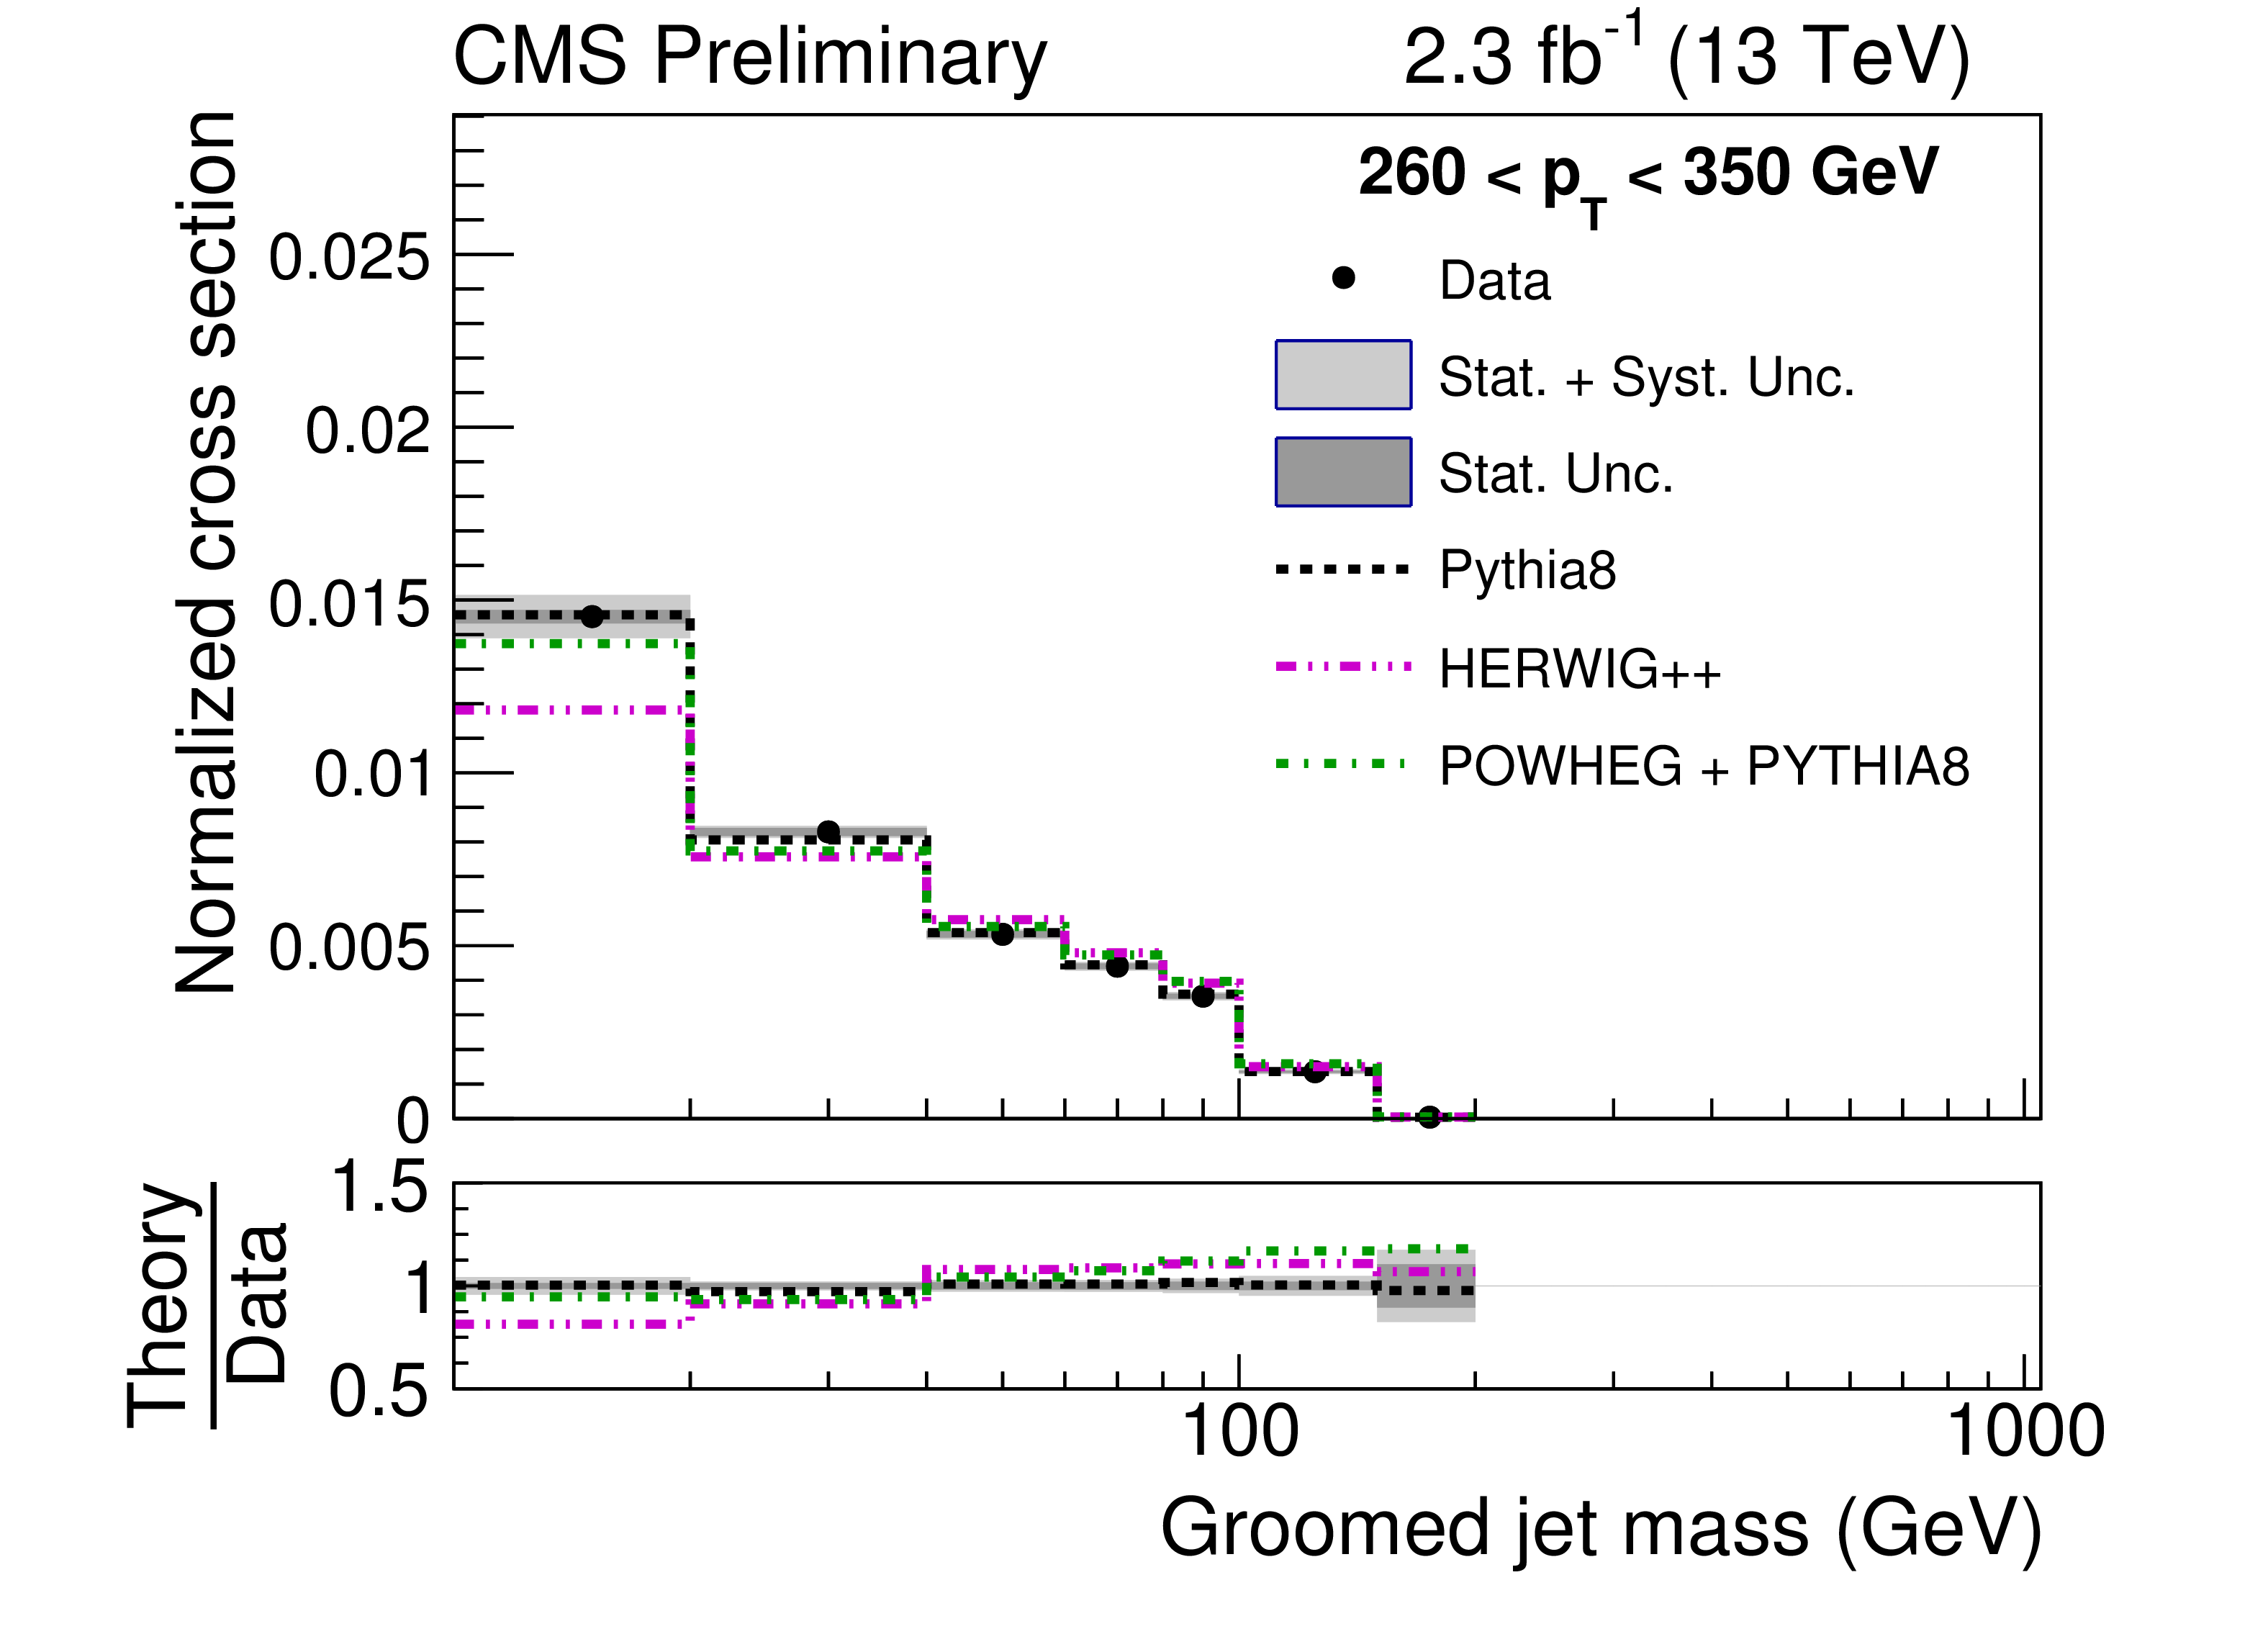
Figure 5-a:
Results of unfolding the ungroomed jets for $ {p_{\mathrm {T}}} $ bin 260 $ < {p_{\mathrm {T}}} < $ 350 GeV. The data are shown in black points, with dark grey bands for the statistical uncertainty (Stat. Unc.) and in light grey bands for the total uncertainty (Stat. + Sys. Unc., added in quadrature). The predictions from PYTHIA8, HERWIG++, and POWHEG+PYTHIA are shown in dashed black, dash-dot-dotted red, and dash-dotted green histograms, respectively, with no uncertainties shown. |
png pdf |
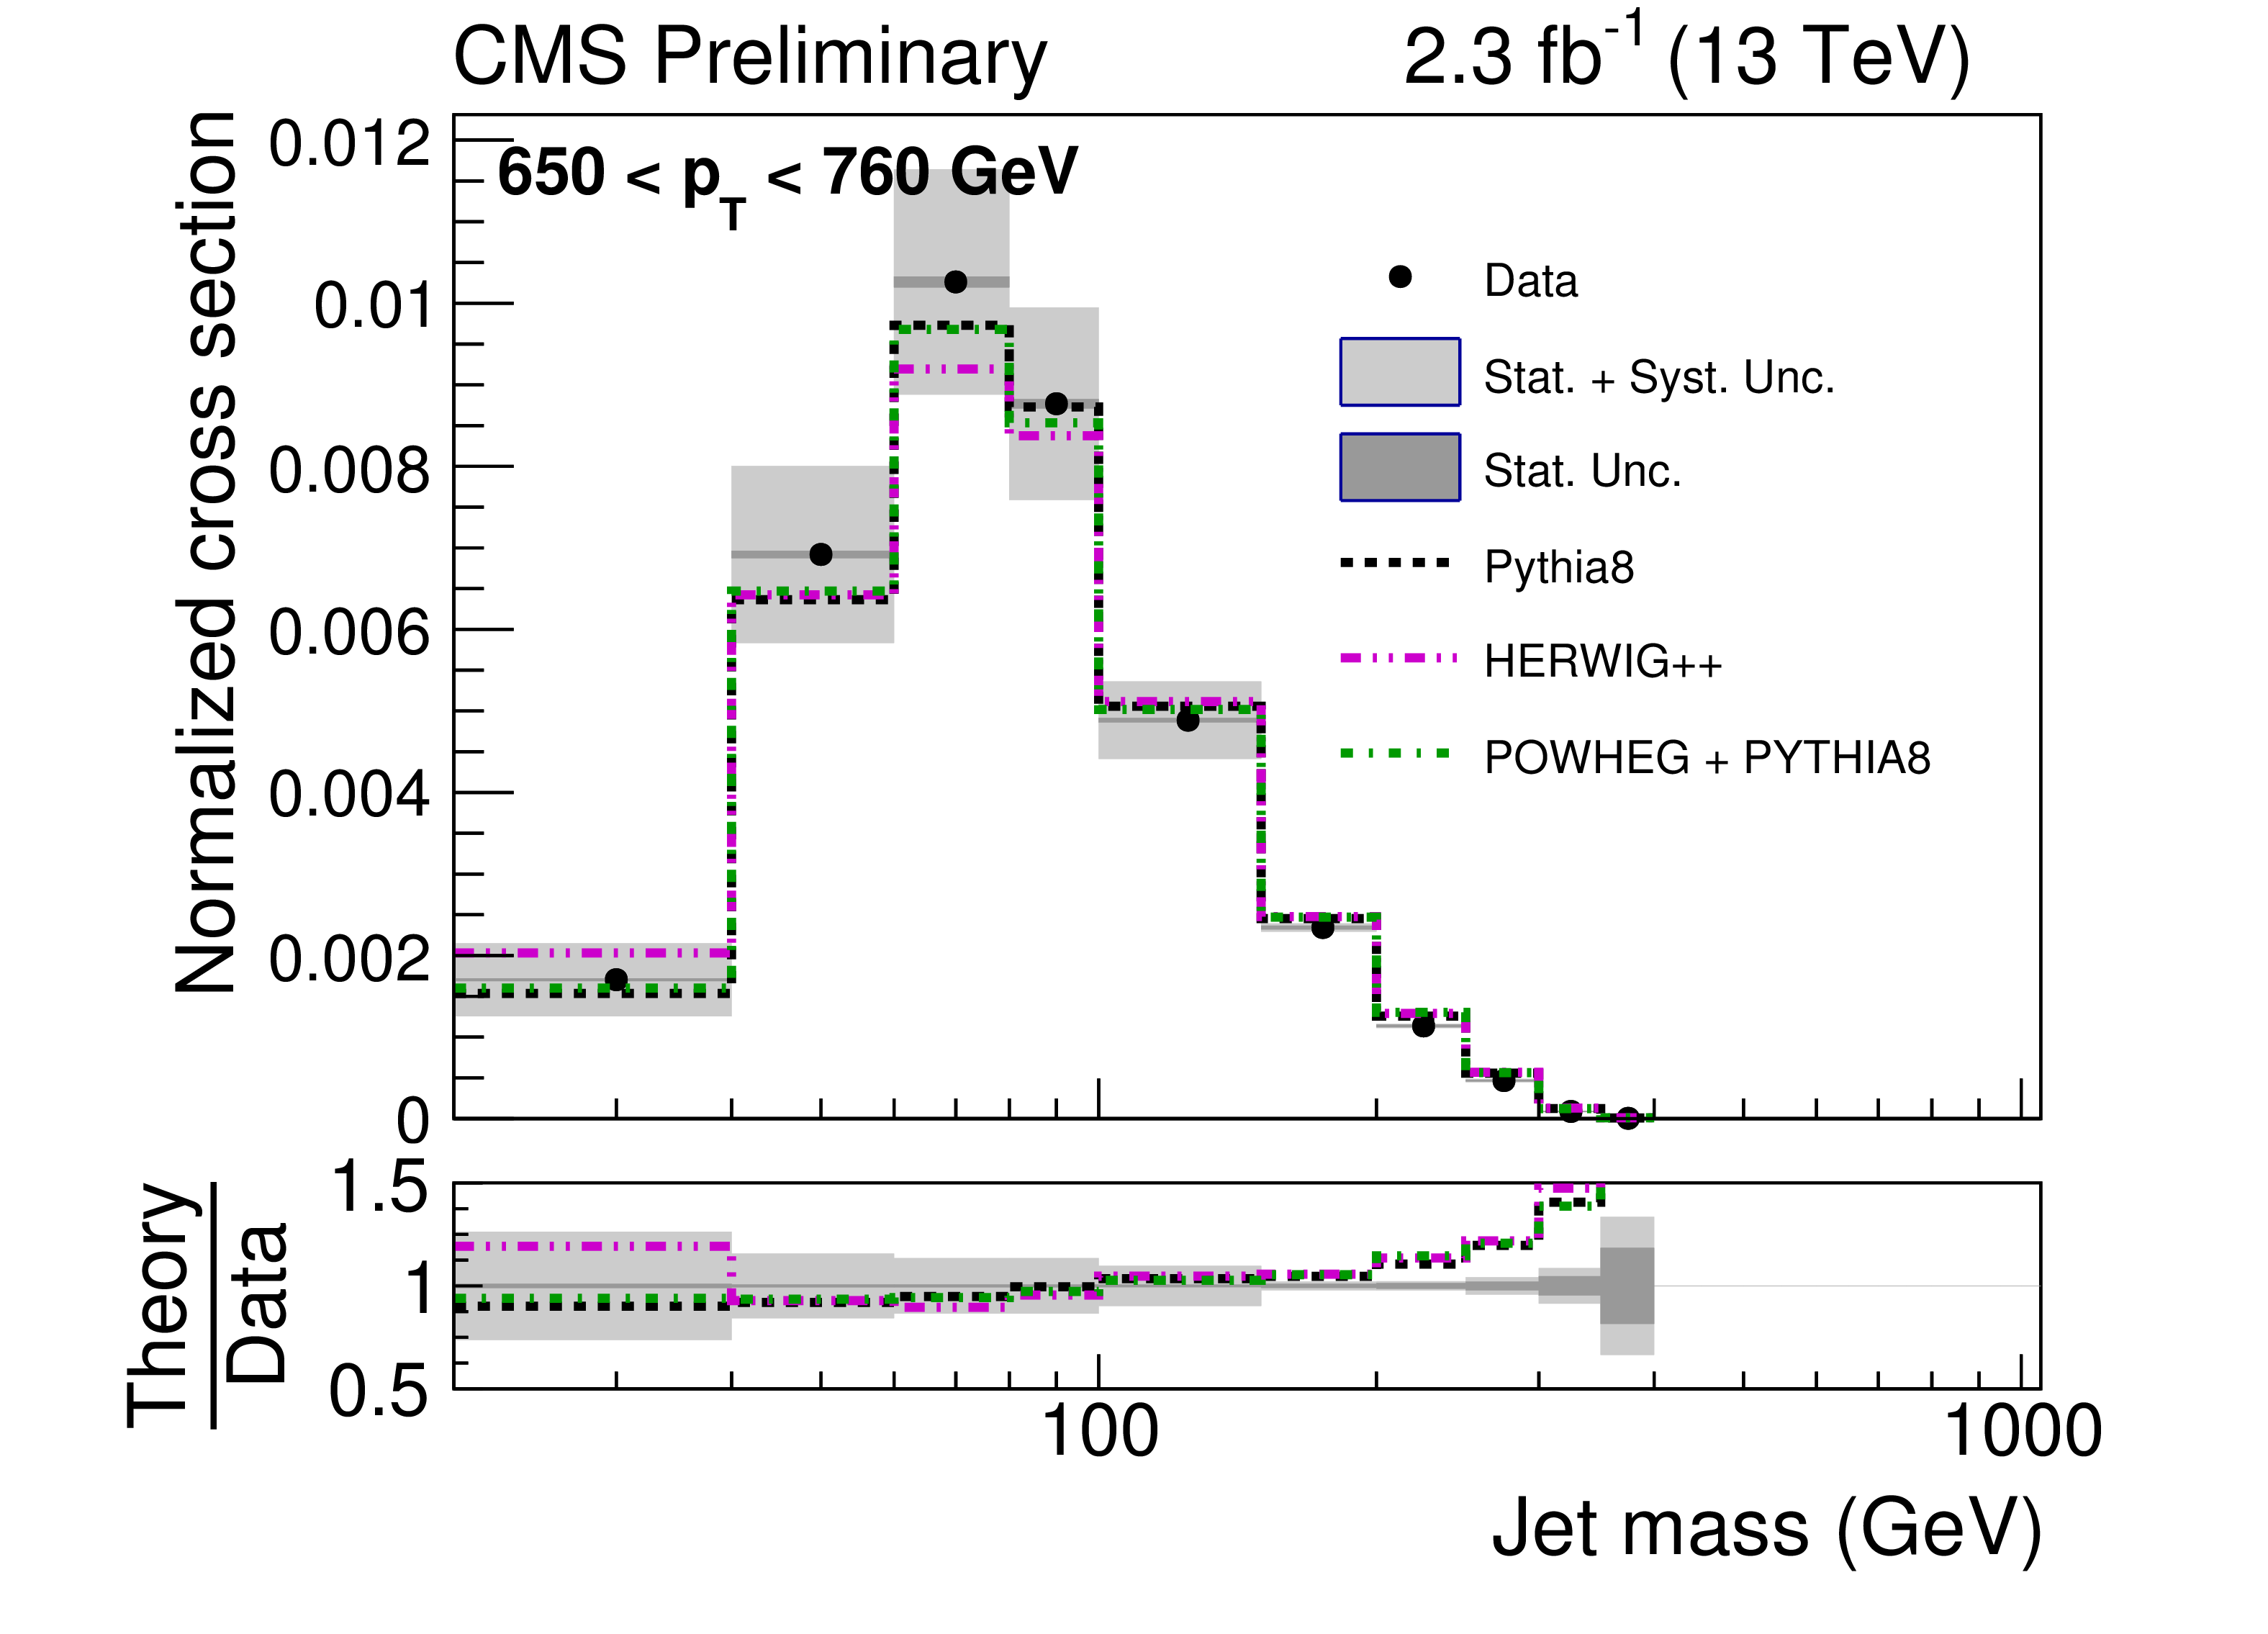
Figure 5-b:
Results of unfolding the ungroomed jets for $ {p_{\mathrm {T}}} $ bin 650 $ < {p_{\mathrm {T}}} < $ 760 GeV. The data are shown in black points, with dark grey bands for the statistical uncertainty (Stat. Unc.) and in light grey bands for the total uncertainty (Stat. + Sys. Unc., added in quadrature). The predictions from PYTHIA8, HERWIG++, and POWHEG+PYTHIA are shown in dashed black, dash-dot-dotted red, and dash-dotted green histograms, respectively, with no uncertainties shown. |

png pdf |
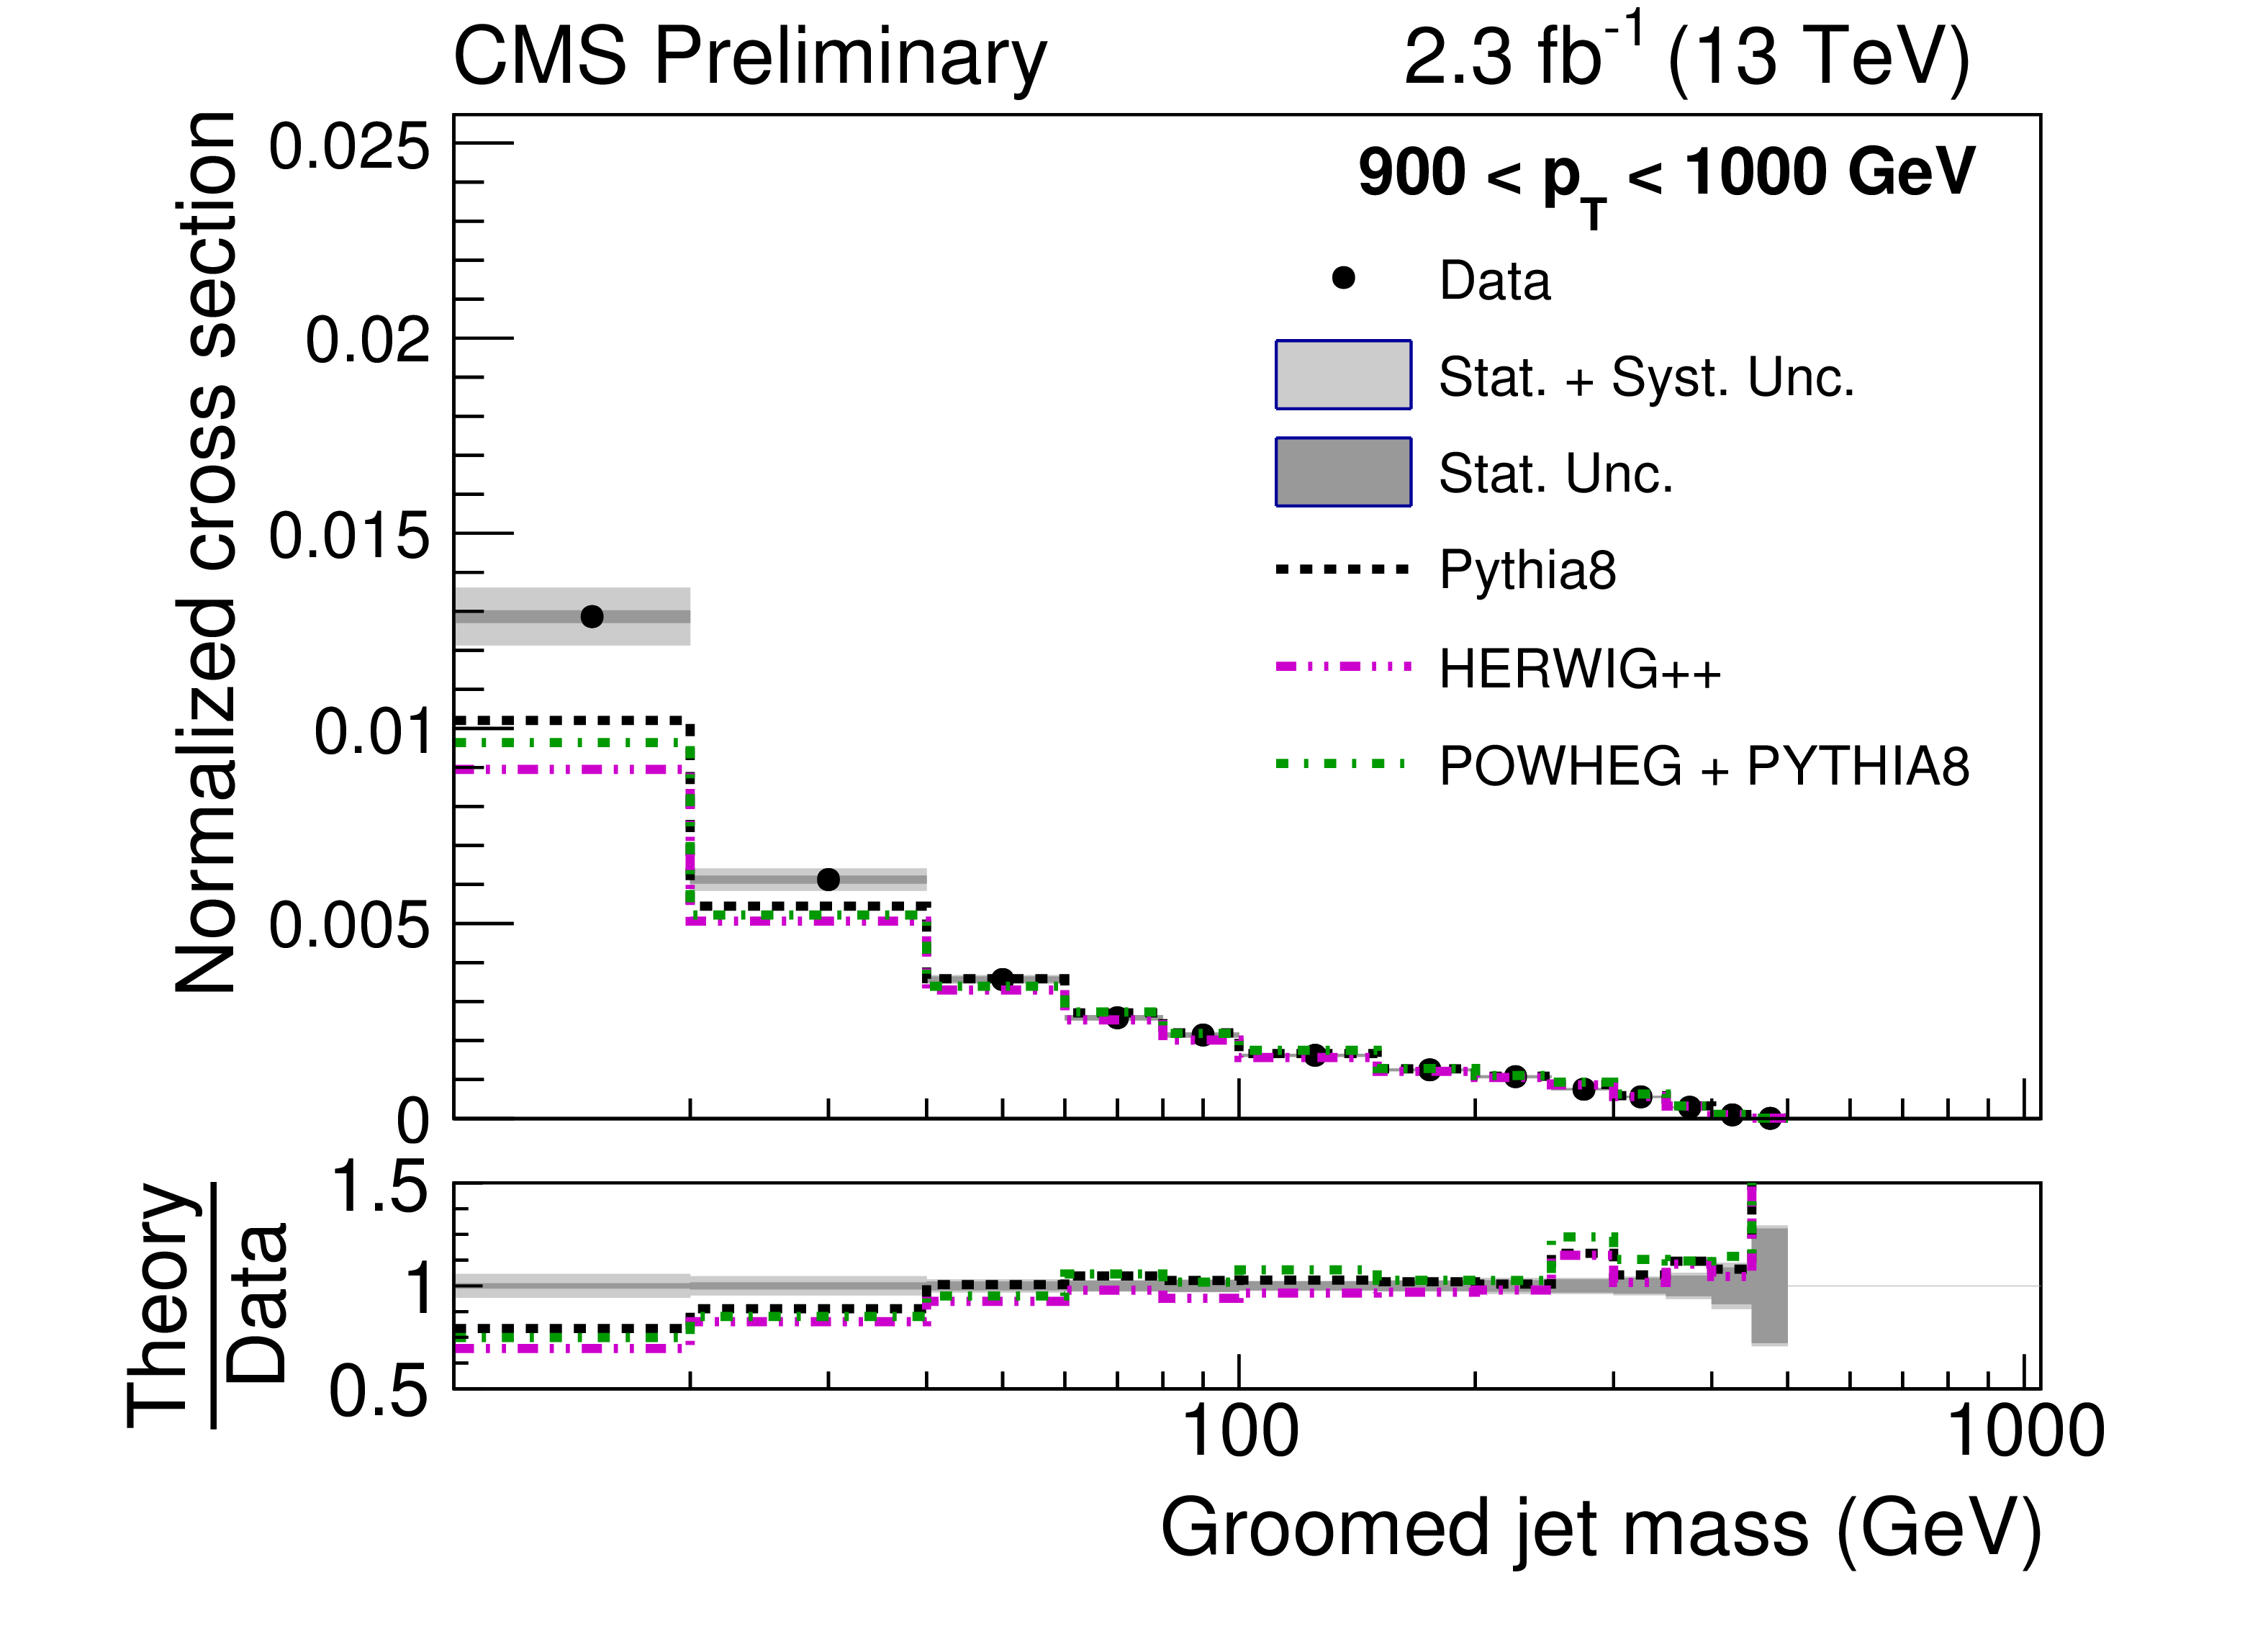
Figure 5-c:
Results of unfolding the ungroomed jets for $ {p_{\mathrm {T}}} $ bin 900 $ < {p_{\mathrm {T}}} < $ 1000 GeV. The data are shown in black points, with dark grey bands for the statistical uncertainty (Stat. Unc.) and in light grey bands for the total uncertainty (Stat. + Sys. Unc., added in quadrature). The predictions from PYTHIA8, HERWIG++, and POWHEG+PYTHIA are shown in dashed black, dash-dot-dotted red, and dash-dotted green histograms, respectively, with no uncertainties shown. |

png pdf |
Figure 5-d:
Results of unfolding the ungroomed jets for $ {p_{\mathrm {T}}} $ bin 1200 $ < {p_{\mathrm {T}}} < $ 1300 GeV. The data are shown in black points, with dark grey bands for the statistical uncertainty (Stat. Unc.) and in light grey bands for the total uncertainty (Stat. + Sys. Unc., added in quadrature). The predictions from PYTHIA8, HERWIG++, and POWHEG+PYTHIA are shown in dashed black, dash-dot-dotted red, and dash-dotted green histograms, respectively, with no uncertainties shown. |
png pdf |
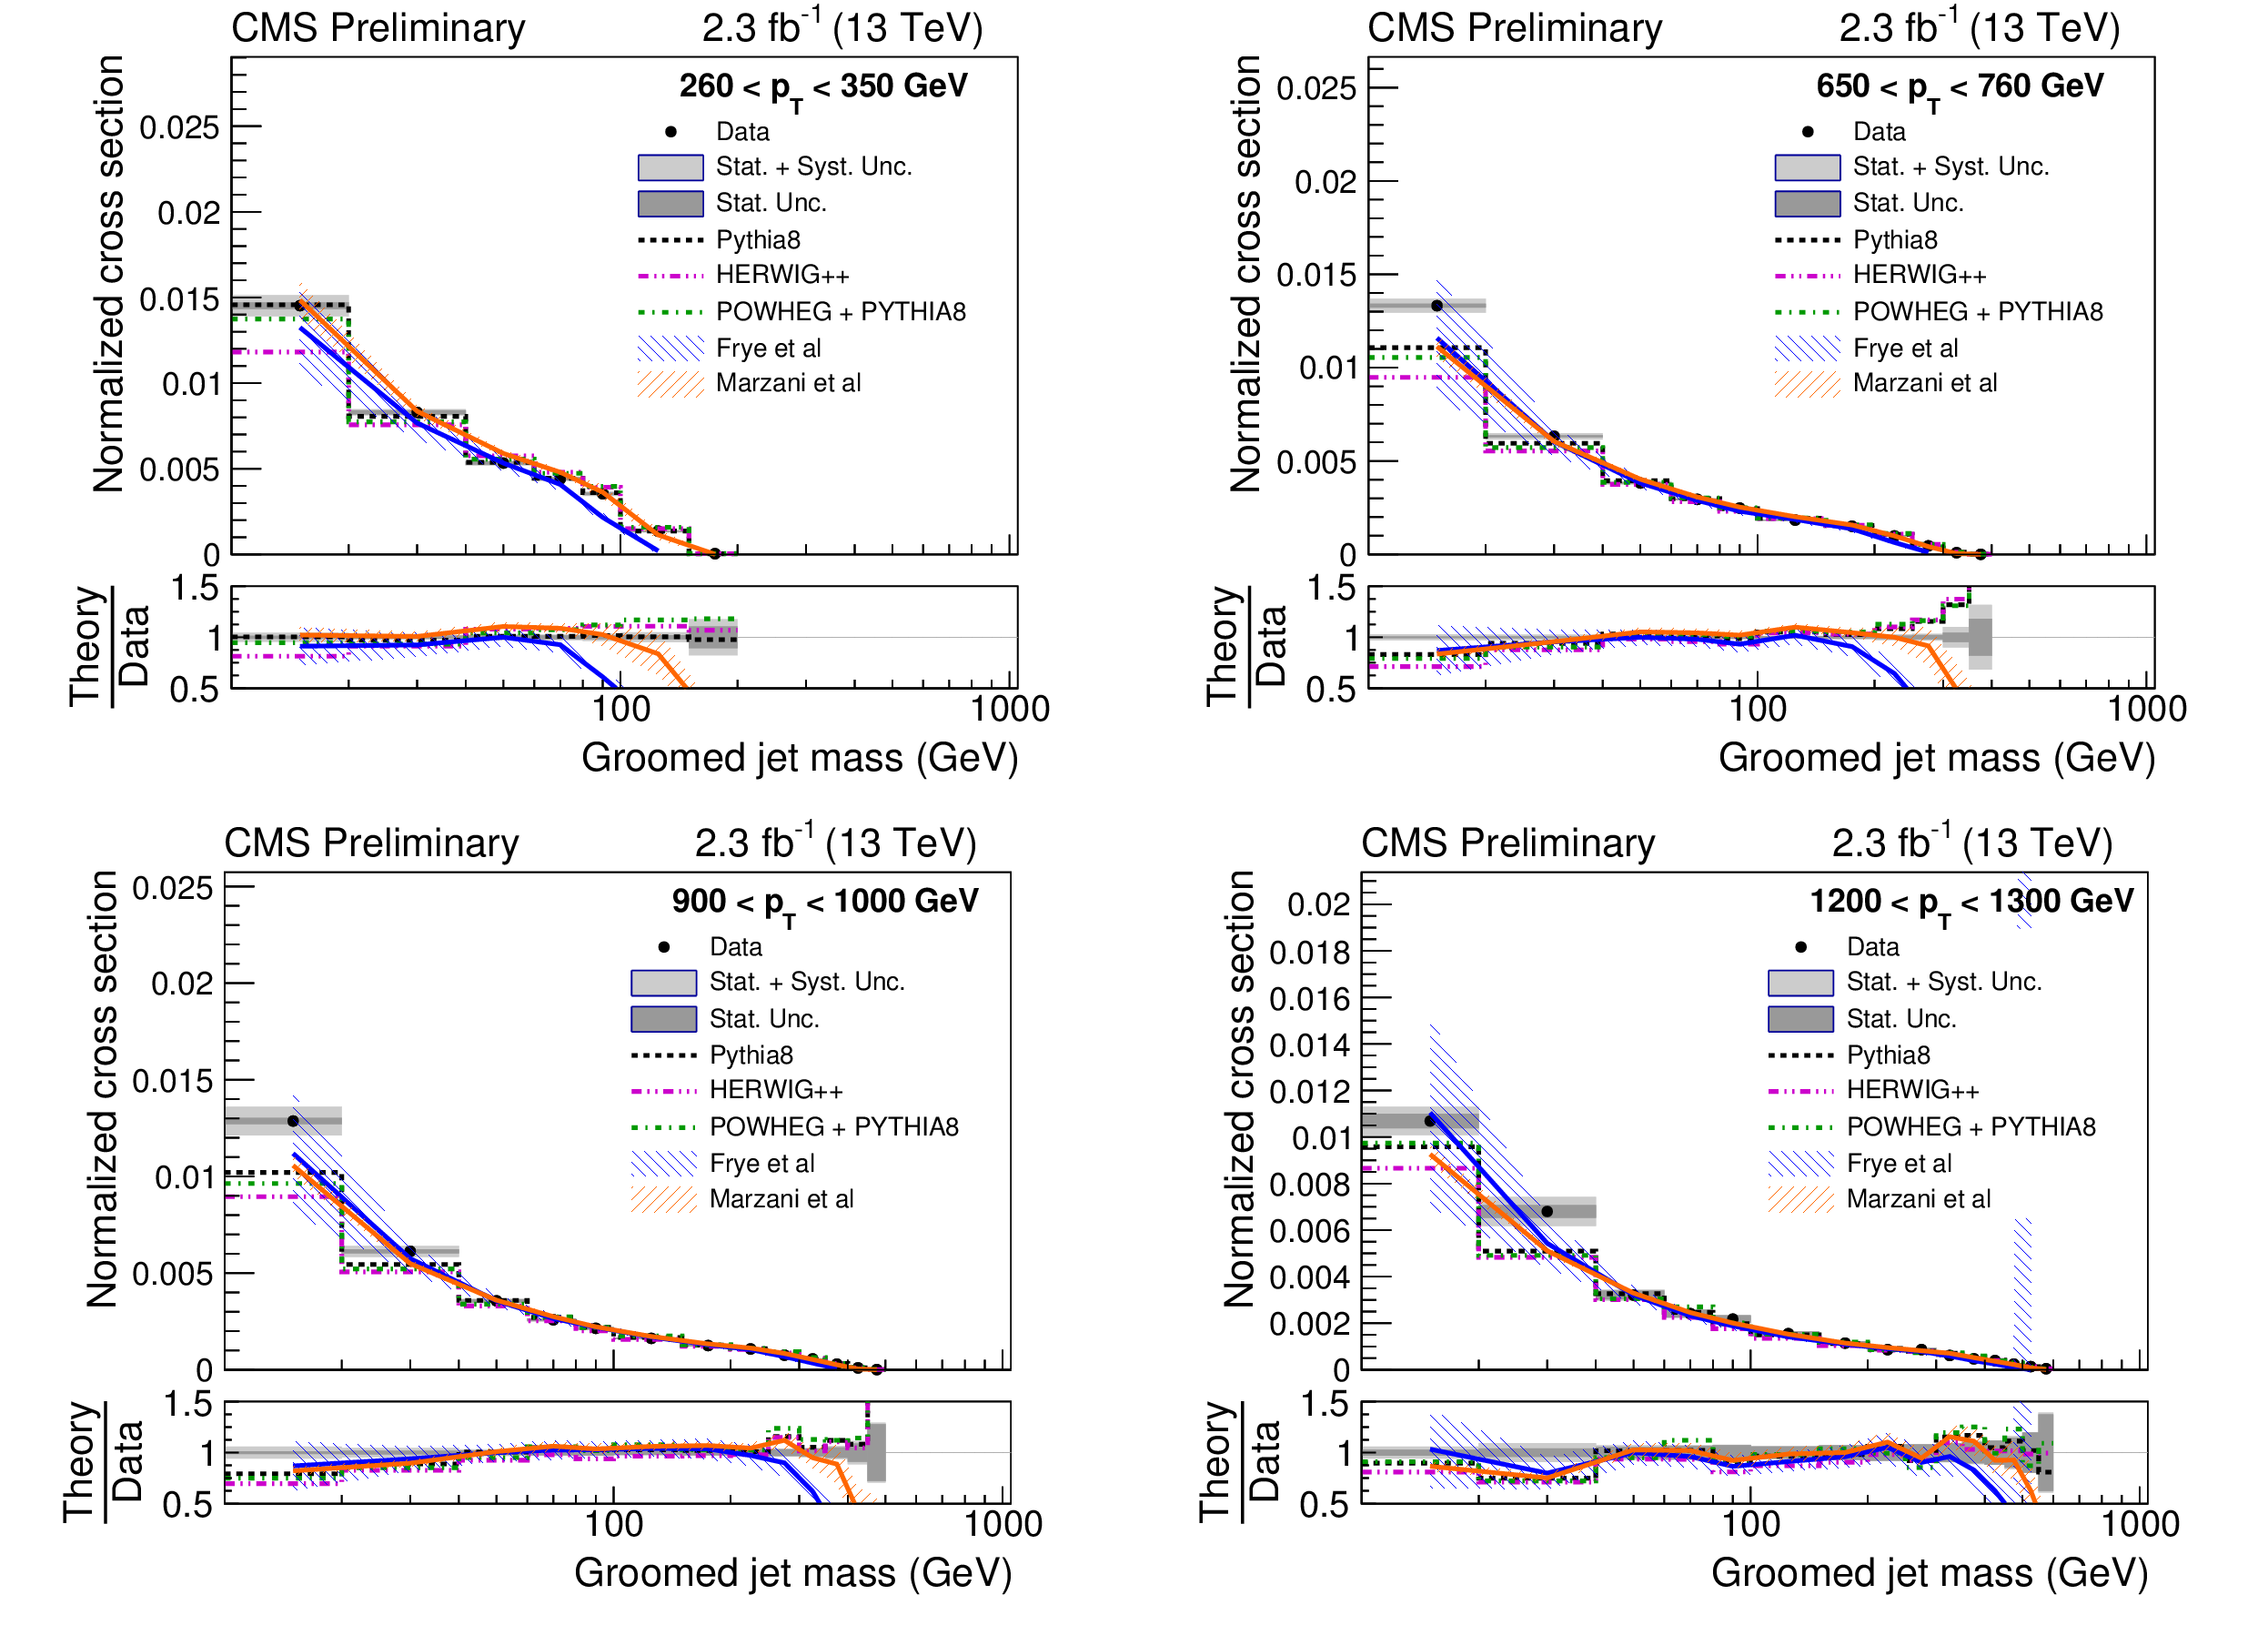
Figure 6:
Results of unfolding groomed jets for various $ {p_{\mathrm {T}}} $ bins. The data are shown in black points, with dark grey bands for the statistical uncertainty (Stat. Unc.) and in light grey bands for the total uncertainty (Stat. + Sys. Unc., added in quadrature). The predictions from PYTHIA8, HERWIG++, and POWHEG+PYTHIA are shown in dashed black, dash-dot-dotted red, and dash-dotted green histograms, respectively, with no uncertainties shown. The predictions from Ref. [11] (Frye et. al.) are shown in blue hatched histograms with $+45^\circ $ hatching. The uncertainties include scale variations and an estimate of nonperturbative effects. The predictions from Ref. [12] (Marzani et. al.) are shown in an orange hatched histogram with $-45^\circ $ hatching. The uncertainties only include effects from scale variations, since nonperturbative corrections have been considered directly in the calculation. |

png pdf |
Figure 6-a:
Results of unfolding groomed jets for $ {p_{\mathrm {T}}} $ bin 260 $ < {p_{\mathrm {T}}} < $ 350 GeV. The data are shown in black points, with dark grey bands for the statistical uncertainty (Stat. Unc.) and in light grey bands for the total uncertainty (Stat. + Sys. Unc., added in quadrature). The predictions from PYTHIA8, HERWIG++, and POWHEG+PYTHIA are shown in dashed black, dash-dot-dotted red, and dash-dotted green histograms, respectively, with no uncertainties shown. The predictions from Ref. [11] (Frye et. al.) are shown in blue hatched histograms with $+45^\circ $ hatching. The uncertainties include scale variations and an estimate of nonperturbative effects. The predictions from Ref. [12] (Marzani et. al.) are shown in an orange hatched histogram with $-45^\circ $ hatching. The uncertainties only include effects from scale variations, since nonperturbative corrections have been considered directly in the calculation. |

png pdf |
Figure 6-b:
Results of unfolding groomed jets for $ {p_{\mathrm {T}}} $ bin 650 $ < {p_{\mathrm {T}}} < $ 760 GeV. The data are shown in black points, with dark grey bands for the statistical uncertainty (Stat. Unc.) and in light grey bands for the total uncertainty (Stat. + Sys. Unc., added in quadrature). The predictions from PYTHIA8, HERWIG++, and POWHEG+PYTHIA are shown in dashed black, dash-dot-dotted red, and dash-dotted green histograms, respectively, with no uncertainties shown. The predictions from Ref. [11] (Frye et. al.) are shown in blue hatched histograms with $+45^\circ $ hatching. The uncertainties include scale variations and an estimate of nonperturbative effects. The predictions from Ref. [12] (Marzani et. al.) are shown in an orange hatched histogram with $-45^\circ $ hatching. The uncertainties only include effects from scale variations, since nonperturbative corrections have been considered directly in the calculation. |

png pdf |
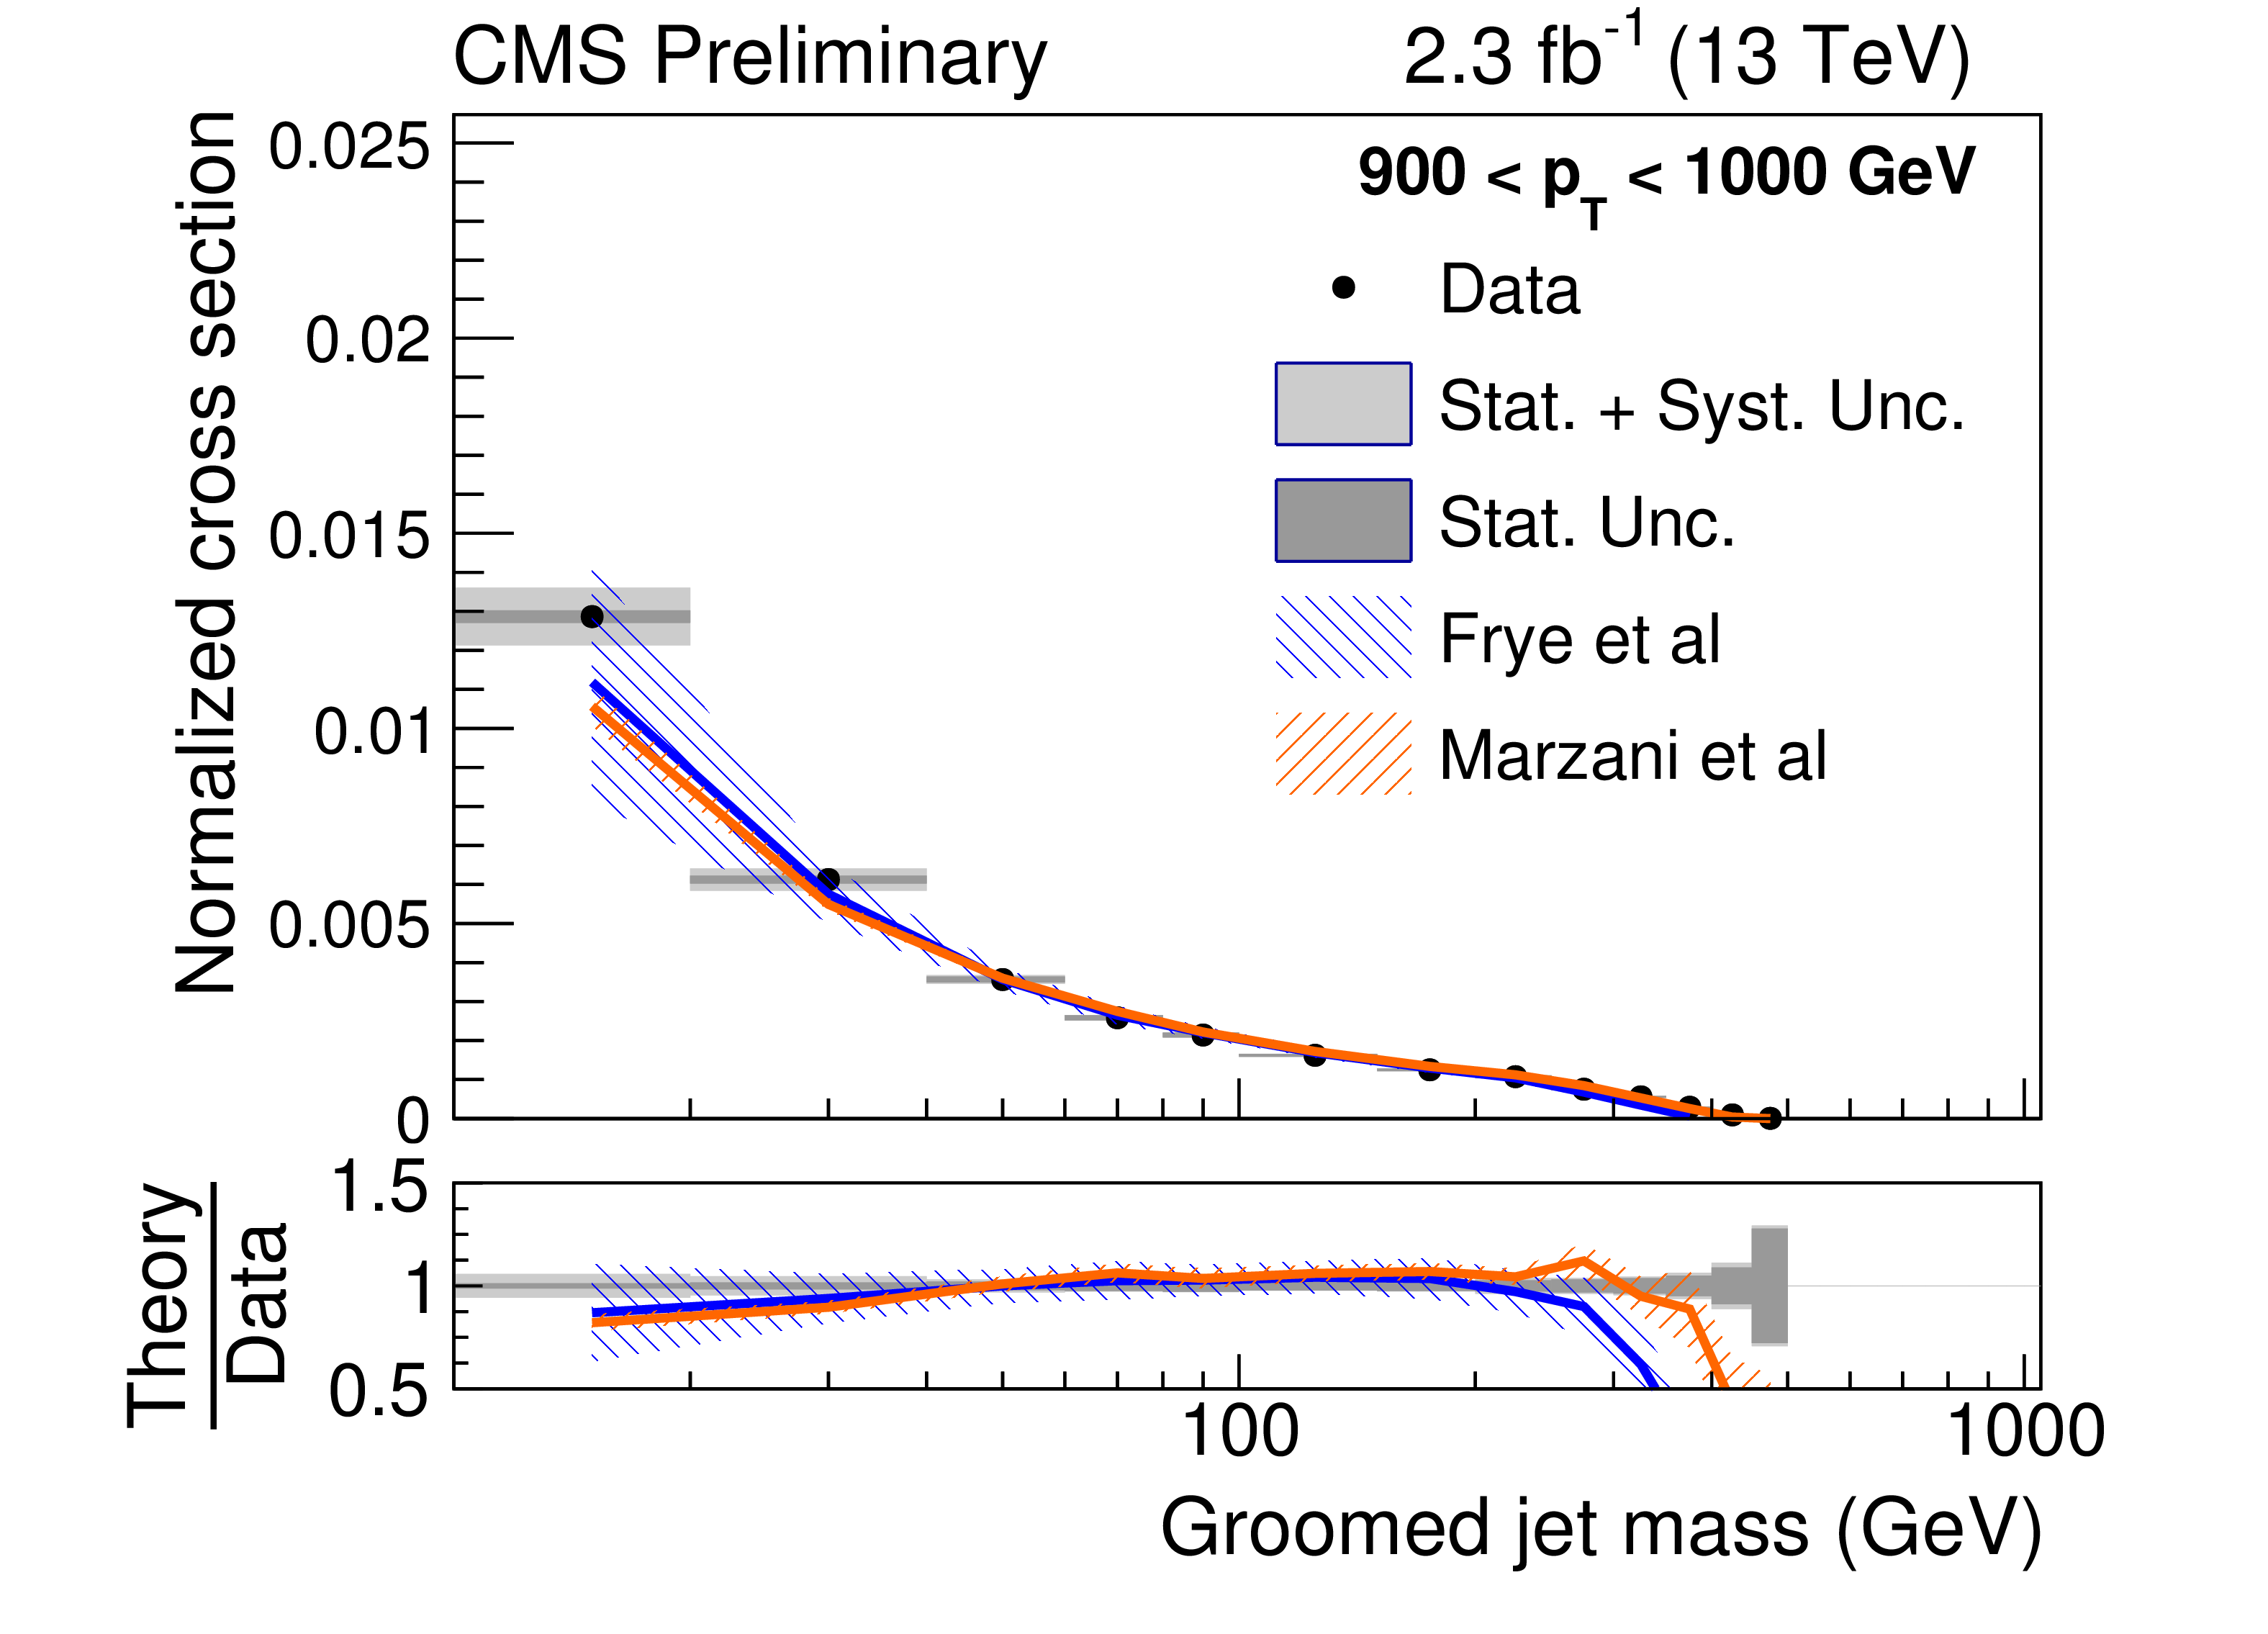
Figure 6-c:
Results of unfolding groomed jets for $ {p_{\mathrm {T}}} $ bin 900 $ < {p_{\mathrm {T}}} < $ 1000 GeV. The data are shown in black points, with dark grey bands for the statistical uncertainty (Stat. Unc.) and in light grey bands for the total uncertainty (Stat. + Sys. Unc., added in quadrature). The predictions from PYTHIA8, HERWIG++, and POWHEG+PYTHIA are shown in dashed black, dash-dot-dotted red, and dash-dotted green histograms, respectively, with no uncertainties shown. The predictions from Ref. [11] (Frye et. al.) are shown in blue hatched histograms with $+45^\circ $ hatching. The uncertainties include scale variations and an estimate of nonperturbative effects. The predictions from Ref. [12] (Marzani et. al.) are shown in an orange hatched histogram with $-45^\circ $ hatching. The uncertainties only include effects from scale variations, since nonperturbative corrections have been considered directly in the calculation. |
png pdf |
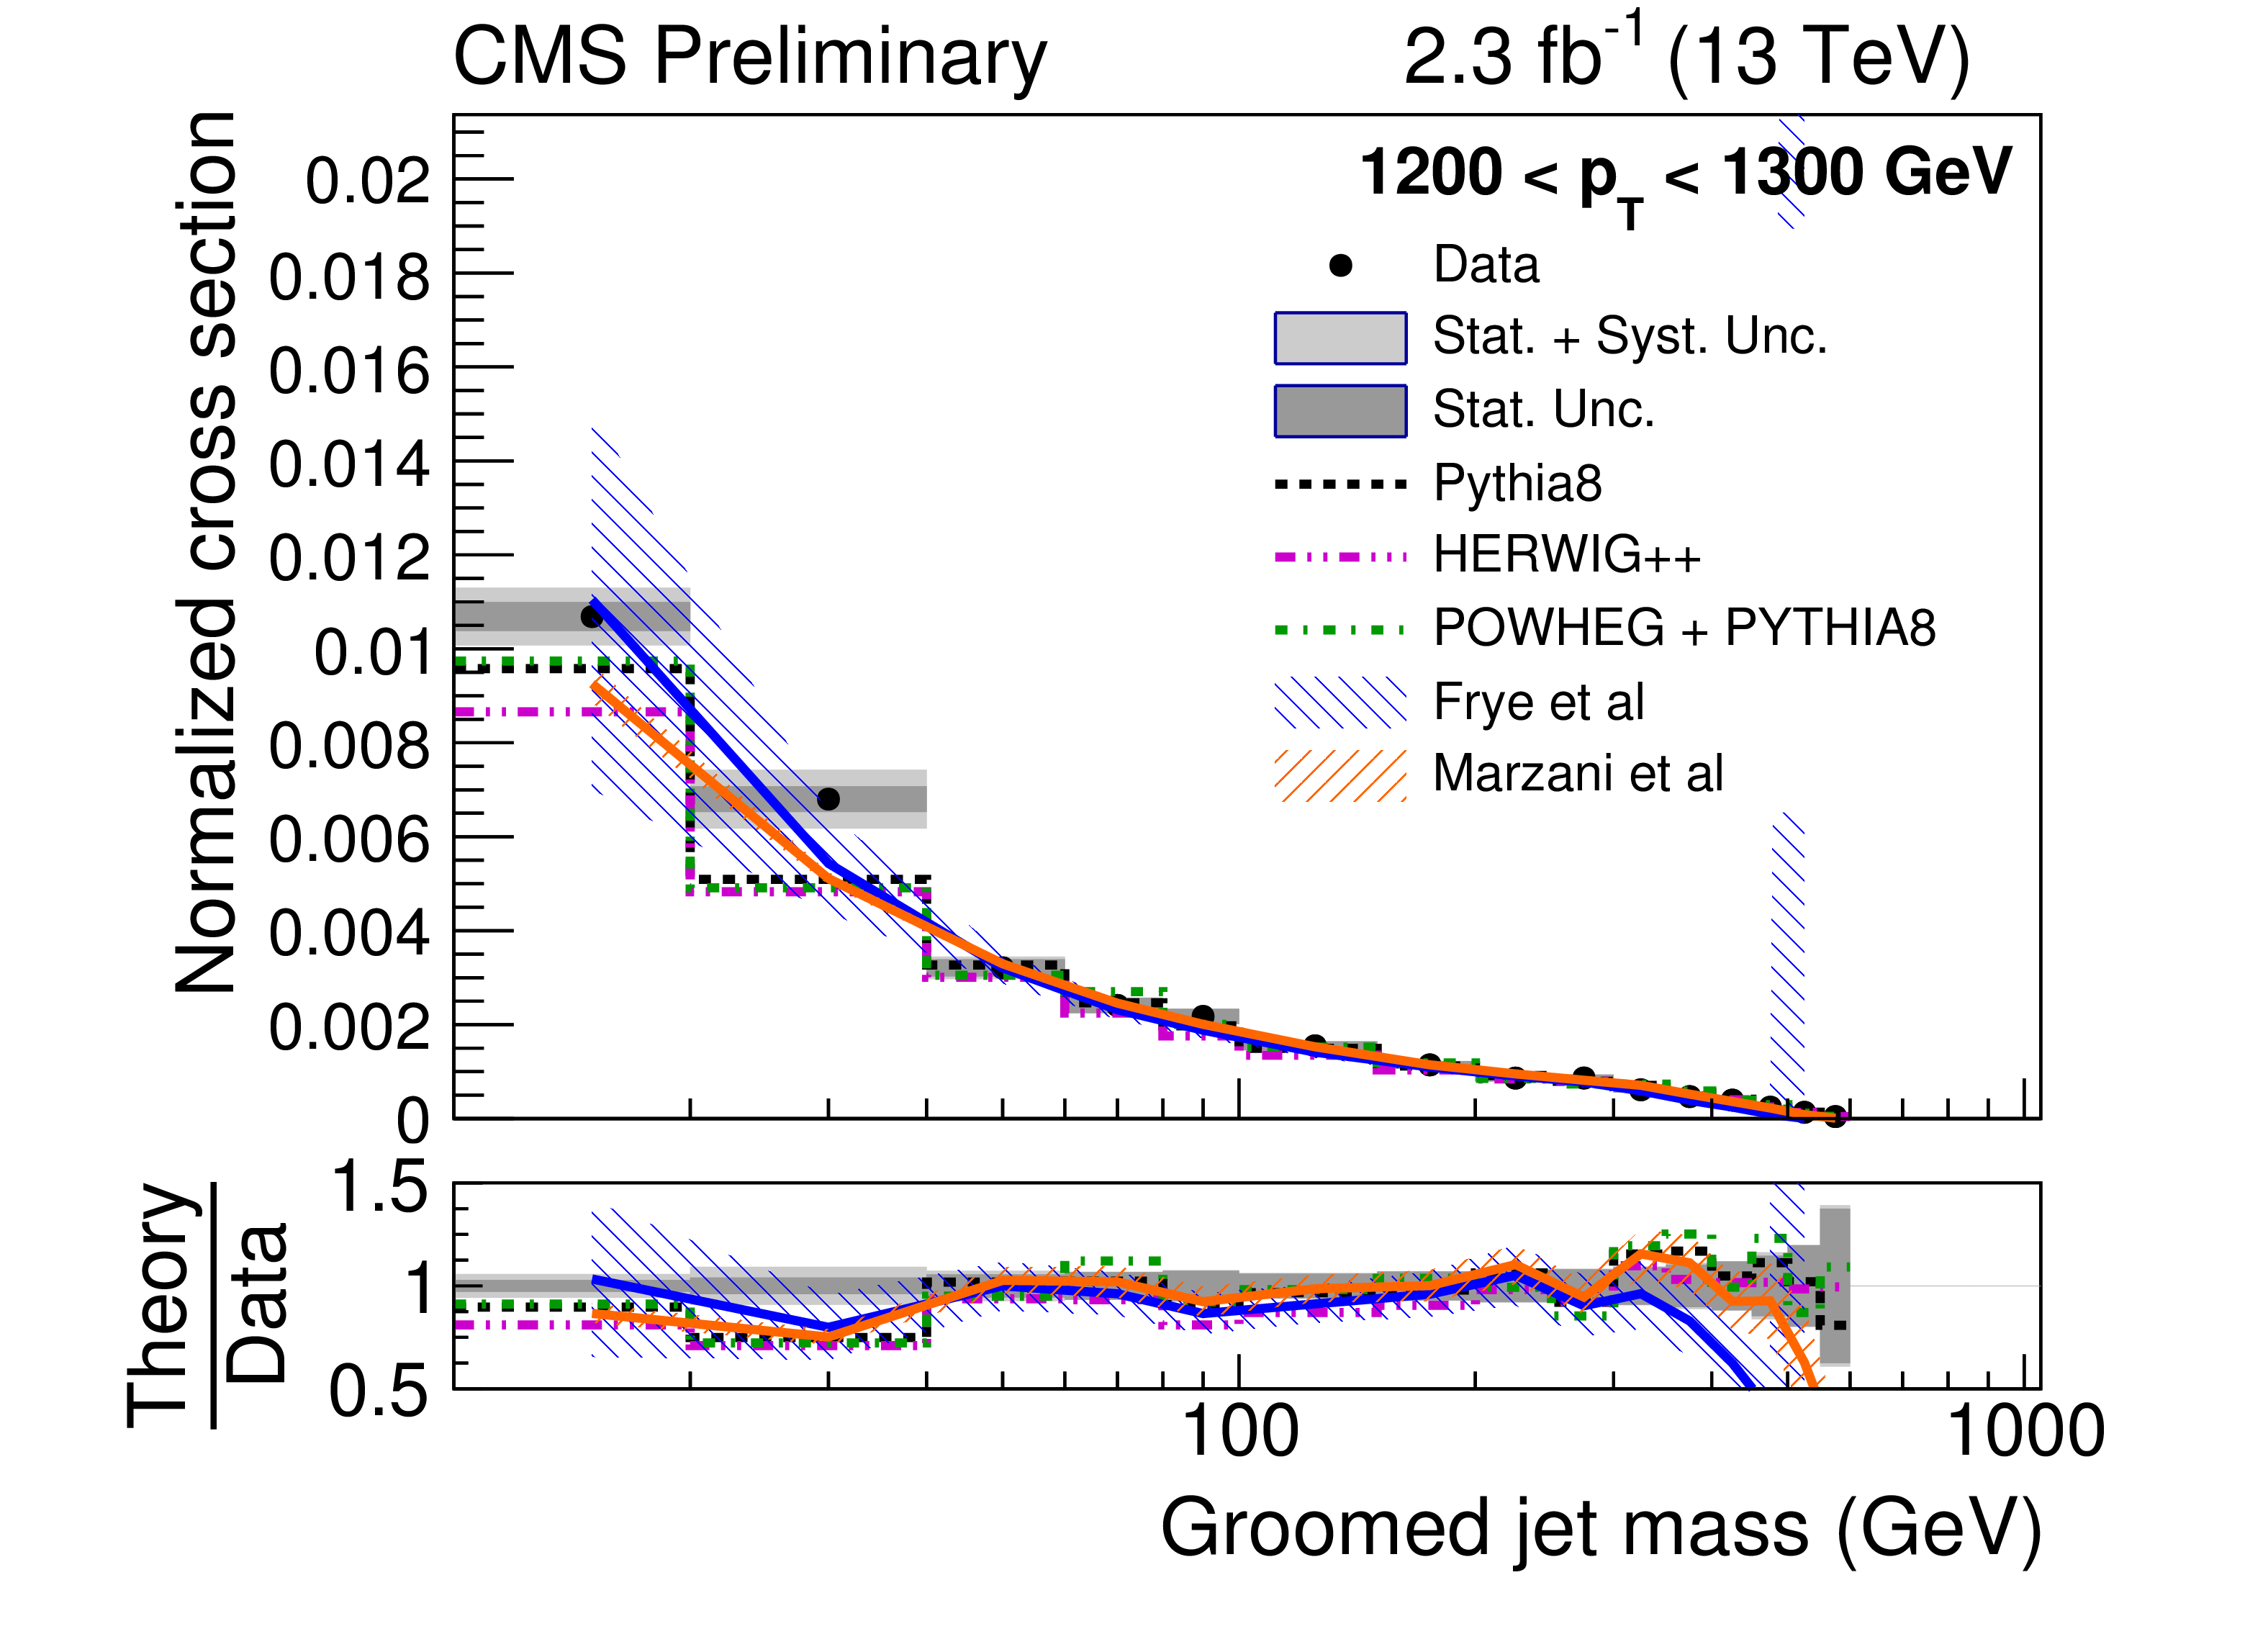
Figure 6-d:
Results of unfolding groomed jets for $ {p_{\mathrm {T}}} $ bin 1200 $ < {p_{\mathrm {T}}} < $ 1300 GeV. The data are shown in black points, with dark grey bands for the statistical uncertainty (Stat. Unc.) and in light grey bands for the total uncertainty (Stat. + Sys. Unc., added in quadrature). The predictions from PYTHIA8, HERWIG++, and POWHEG+PYTHIA are shown in dashed black, dash-dot-dotted red, and dash-dotted green histograms, respectively, with no uncertainties shown. The predictions from Ref. [11] (Frye et. al.) are shown in blue hatched histograms with $+45^\circ $ hatching. The uncertainties include scale variations and an estimate of nonperturbative effects. The predictions from Ref. [12] (Marzani et. al.) are shown in an orange hatched histogram with $-45^\circ $ hatching. The uncertainties only include effects from scale variations, since nonperturbative corrections have been considered directly in the calculation. |

png pdf |
Figure 7:
Alternative display of Fig. 6 showing only the MC predictions and data. |
png pdf |
Figure 7-a:
Alternative display of Fig. 6-a showing only the MC predictions and data. |

png pdf |
Figure 7-b:
Alternative display of Fig. 6-b showing only the MC predictions and data. |
png pdf |
Figure 7-c:
Alternative display of Fig. 6-c showing only the MC predictions and data. |

png pdf |
Figure 7-d:
Alternative display of Fig. 6-d showing only the MC predictions and data. |

png pdf |
Figure 8:
Alternative display of Fig. 6 showing only the predictions from Refs. [11] and [12], and data. |

png pdf |
Figure 8-a:
Alternative display of Fig. 6-a showing only the predictions from Refs. [11] and [12], and data. |

png pdf |
Figure 8-b:
Alternative display of Fig. 6-b showing only the predictions from Refs. [11] and [12], and data. |
png pdf |
Figure 8-c:
Alternative display of Fig. 6-c showing only the predictions from Refs. [11] and [12], and data. |

png pdf |
Figure 8-d:
Alternative display of Fig. 6-d showing only the predictions from Refs. [11] and [12], and data. |
| Tables | |
png pdf |
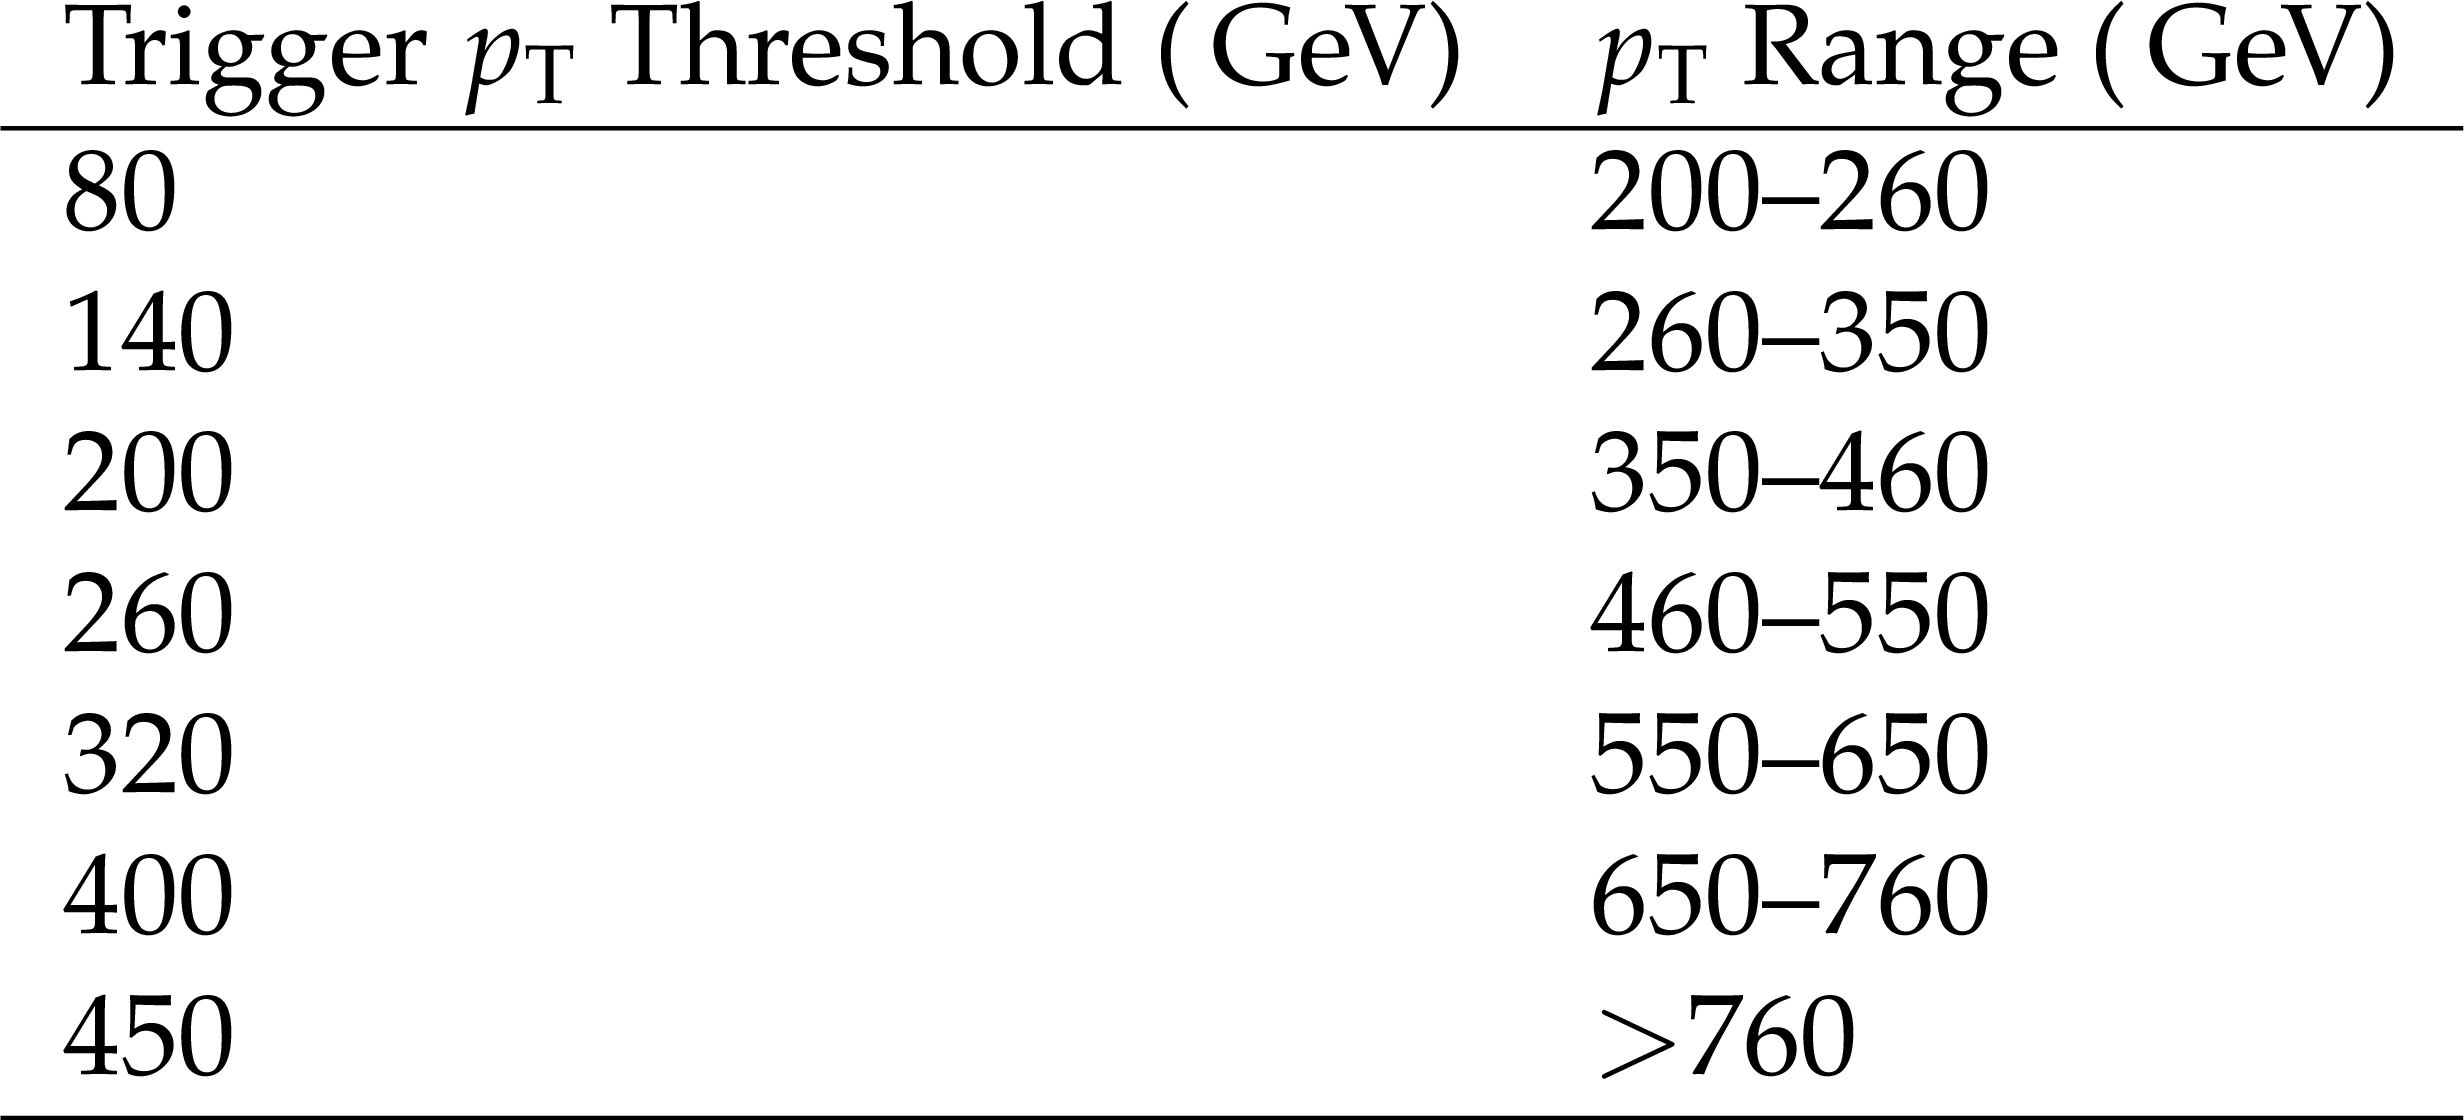
Table 1:
List of trigger thresholds used for each high-level trigger path. The $ {p_{\mathrm {T}}} $ ranges are shown in the second column. Events are selected such that exactly one trigger is used for each $ {p_{\mathrm {T}}} $ bin. |
| Summary |
|
A double-differential jet cross section has been presented in bins of the ungroomed jet $p_{\mathrm{T}}$ in conjunction with the ungroomed and groomed jet mass using the "soft drop'' grooming algorithm, which is the same as the "mass drop'' grooming algorithm for our choice of parameters. This observable is sensitive to the physics modeling, and could be used in future global fits for parameter tuning. This analysis improves over previous results [49] by using a more theoretically controlled jet grooming algorithm, as well as by unfolding in both transverse momentum and mass. For ungroomed jets, all Monte Carlo event generators investigated were found to predict the jet mass spectrum within uncertainties in the data for intermediate masses (0.1 $ < m/p_{\mathrm{T}} < $ 0.3). For $m/p_{\mathrm{T}} < $ 0.1, large variations (above 20%) were observed between the predictions from the PYTHIA8 and HERWIG++ generators. The PYTHIA8 generator was observed to predict the data slightly better in this regime. For $m/p_{\mathrm{T}} > $ 0.3, the predictions from PYTHIA8 and HERWIG++ agree with each other, but overpredict the data by 20-50%. There is no significant difference observed when POWHEG+PYTHIA8 is used compared to PYTHIA8 alone. For groomed jets, the Sudakov peak is suppressed and the precision in the intermediate mass region (0.1 $ < m/p_{\mathrm{T}} < $ 0.3) improves, since the grooming algorithm removes the portions of the jet arising from soft radiation. At low masses ($m/p_{\mathrm{T}} < $ 0.1), disagreement was observed between PYTHIA8 and HERWIG++. As in the case for ungroomed jets, PYTHIA8 was observed to predict the data slightly better for groomed jets. Semi-analytical calculations beyond next-to-leading logarithmic accuracy of the groomed jet mass were also compared to the data for the first time at a hadron collider. These calculations agree with each other, and were found to also predict the data within their uncertainties for masses lower than 30% of the transverse momentum. |
| References | ||||
| 1 | A. Abdesselam et al. | Boosted objects: A Probe of beyond the Standard Model physics | EPJC 71 (2011) 1661 | 1012.5412 |
| 2 | A. Altheimer et al. | Boosted objects and jet substructure at the LHC. Report of BOOST2012, held at IFIC Valencia, 23rd-27th of July 2012 | EPJC 74 (2014) | |
| 3 | D. Adams et al. | Towards an Understanding of the Correlations in Jet Substructure | EPJC 75 (2015) | |
| 4 | M. Dasgupta and G. P. Salam | Resummation of nonglobal QCD observables | PLB 512 (2001) 323 | hep-ph/0104277 |
| 5 | M. Dasgupta, A. Fregoso, S. Marzani, and G. P. Salam | Towards an understanding of jet substructure | JHEP 09 (2013) 029 | 1307.0007 |
| 6 | A. J. Larkoski, S. Marzani, G. Soyez, and J. Thaler | Soft Drop | JHEP 05 (2014) 146 | 1402.2657 |
| 7 | M. Dasgupta, A. Fregoso, S. Marzani, and A. Powling | Jet substructure with analytical methods | EPJC 73 (2013) | |
| 8 | M. Dasgupta, A. Powling, and A. Siodmok | On jet substructure methods for signal jets | JHEP 08 (2015) 079 | 1503.01088 |
| 9 | A. J. Larkoski, I. Moult, and D. Neill | Non-Global Logarithms, Factorization, and the Soft Substructure of Jets | JHEP 09 (2015) 143 | 1501.04596 |
| 10 | J. M. Butterworth, A. R. Davison, M. Rubin, and G. P. Salam | Jet substructure as a new Higgs search channel at the LHC | PRL 100 (2008) 242001 | 0802.2470 |
| 11 | C. Frye, A. J. Larkoski, M. D. Schwartz, and K. Yan | Factorization for groomed jet substructure beyond the next-to-leading logarithm | JHEP 07 (2016) 064 | 1603.09338 |
| 12 | S. Marzani, L. Schunk, and G. Soyez | A study of jet mass distributions with grooming | 1704.02210 | |
| 13 | CMS Collaboration | Studies of jet mass in dijet and W/Z + jet events | JHEP 05 (2013) 090 | CMS-SMP-12-019 1303.4811 |
| 14 | D. Krohn, J. Thaler, and L.-T. Wang | Jet Trimming | JHEP 1002 (2010) 084 | 0912.1342 |
| 15 | S. D. Ellis, C. K. Vermilion, and J. R. Walsh | Techniques for improved heavy particle searches with jet substructure | PRD 80 (2009) 051501 | 0903.5081 |
| 16 | S. D. Ellis, C. K. Vermilion, and J. R. Walsh | Recombination Algorithms and Jet Substructure: Pruning as a Tool for Heavy Particle Searches | PRD 81 (2010) 094023 | 0912.0033 |
| 17 | CMS Collaboration | The CMS experiment at the CERN LHC | JINST 3 (2008) S08004 | CMS-00-001 |
| 18 | CMS Collaboration | Particle-flow reconstruction and global event description with the CMS detector | Submitted to JINST | CMS-PRF-14-001 1706.04965 |
| 19 | CMS Collaboration | Pileup Removal Algorithms | CMS-PAS-JME-14-001 | CMS-PAS-JME-14-001 |
| 20 | CMS Collaboration | Measurement of the double-differential inclusive jet cross section in proton–proton collisions at $ \sqrt{s} = $ 13 TeV | EPJC 76 (2016) | |
| 21 | T. Sjostrand et al. | An introduction to pythia 8.2 | CPC 191 (2015) 159 | 1410.3012 |
| 22 | CMS Collaboration | Event generator tunes obtained from underlying event and multiparton scattering measurements | EPJC 76 (2016) | |
| 23 | NNPDF Collaboration | Parton distributions for the LHC Run II | JHEP 04 (2015) 040 | 1410.8849 |
| 24 | S. Dulat et al. | New parton distribution functions from a global analysis of quantum chromodynamics | PRD 93 (2016) | |
| 25 | L. A. Harland-Lang, A. D. Martin, P. Motylinski, and R. S. Thorne | Parton distributions in the LHC era: MMHT 2014 PDFs | EPJC 75 (2015) | |
| 26 | A. Buckley et al. | LHAPDF6: parton density access in the LHC precision era | EPJC 75 (2015) 132 | 1412.7420 |
| 27 | M. Bahr et al. | Herwig++ Physics and Manual | EPJC 58 (2008) 639 | 0803.0883 |
| 28 | P. Nason | A New method for combining NLO QCD with shower Monte Carlo algorithms | JHEP 11 (2004) 040 | hep-ph/0409146 |
| 29 | S. Frixione, P. Nason, and C. Oleari | Matching NLO QCD computations with Parton Shower simulations: the POWHEG method | JHEP 11 (2007) 070 | 0709.2092 |
| 30 | S. Alioli, P. Nason, C. Oleari, and E. Re | A general framework for implementing NLO calculations in shower Monte Carlo programs: the POWHEG BOX | JHEP 06 (2010) 043 | 1002.2581 |
| 31 | S. Alioli et al. | Jet pair production in POWHEG | JHEP 04 (2011) 081 | 1012.3380 |
| 32 | J. Alwall et al. | The automated computation of tree-level and next-to-leading order differential cross sections, and their matching to parton shower simulations | JHEP 07 (2014) 079 | 1405.0301 |
| 33 | Z. Nagy | Next-to-leading order calculation of three jet observables in hadron hadron collision | PRD 68 (2003) 094002 | hep-ph/0307268 |
| 34 | S. D. Ellis and D. E. Soper | Successive combination jet algorithm for hadron collisions | PRD 48 (1993) 3160 | hep-ph/9305266 |
| 35 | M. Cacciari, G. P. Salam, and G. Soyez | The anti-$ k_t $ jet clustering algorithm | JHEP 04 (2008) 063 | 0802.1189 |
| 36 | Y. L. Dokshitzer, G. D. Leder, S. Moretti, and B. R. Webber | Better Jet Clustering Algorithms | JHEP 08 (1997) 001 | hep-ph/9707323 |
| 37 | M. Wobisch and T. Wengler | Hadronization corrections to jet cross sections in deep- inelastic scattering | hep-ph/9907280 | |
| 38 | M. Cacciari, G. P. Salam, and G. Soyez | FastJet user manual | EPJC 72 (2012) 1896 | 1111.6097 |
| 39 | M. Cacciari and G. P. Salam | Pileup subtraction using jet areas | PLB 659 (2008) 119 | 0707.1378 |
| 40 | CMS Collaboration | Jet energy scale and resolution in the CMS experiment in pp collisions at 8 TeV | JINST 12 (2017), no. 02, P02014 | CMS-JME-13-004 1607.03663 |
| 41 | CMS Collaboration | Search for massive resonances decaying into WW, WZ or ZZ bosons in proton-proton collisions at $ \sqrt{s} = $ 13 TeV | JHEP 03 (2017) 162 | CMS-B2G-16-004 1612.09159 |
| 42 | G. D'Agostini | A Multidimensional unfolding method based on Bayes' theorem | NIMA 362 (1995) 487 | |
| 43 | W. H. Richardson | Bayesian-based iterative method of image restoration | J. Opt. Soc. Am. 62 (Jan, 1972) 55 | |
| 44 | L. B. Lucy | An iterative technique for the rectification of observed distributions | Astron. J. 79 (1974) 745 | |
| 45 | Institute of Mathematical Statistics | The Annals of Mathematical Statistics | link | |
| 46 | M. H. Quenouille | Journal of the Royal Statistical Society. Series B (Methodological) | ||
| 47 | CMS Collaboration | Determination of jet energy calibration and transverse momentum resolution in CMS | JINST 6 (2011) P11002 | CMS-JME-10-011 1107.4277 |
| 48 | CMS Collaboration | CMS Luminosity Measurement for the 2015 Data Taking Period | CMS-PAS-LUM-15-001 | CMS-PAS-LUM-15-001 |
| 49 | CMS Collaboration | Studies of jet mass in dijet and W/Z + jet events | JHEP 05 (2013) 090 | CMS-SMP-12-019 1303.4811 |
|
|
Compact Muon Solenoid LHC, CERN |
|

|

|

|

|

|