

Compact Muon Solenoid
LHC, CERN
| CMS-PAS-SMP-22-010 | ||
| Measurement of the Drell-Yan forward-backward asymmetry and of the effective leptonic weak mixing angle using proton-proton collisions at $ \sqrt{s}= $ 13 TeV | ||
| CMS Collaboration | ||
| 27 March 2024 | ||
| Abstract: The forward-backward asymmetry in Drell-Yan production and the effective leptonic electroweak mixing angle are measured using a sample of proton-proton collisions at $ \sqrt{s}= $ 13 TeV collected by the CMS experiment and corresponding to an integrated luminosity of 137 fb$ ^{-1} $. The measurement uses both dimuon and dielectron events, and is performed as a function of the dilepton's mass and rapidity. Using the CT18Z set of parton distribution functions (PDF), we obtain $ \sin^2\theta^\ell_{\mathrm{eff}} = $ 0.23157 $\pm$ 0.00010 (stat) $\pm$ 0.00015 (syst) $\pm$ 0.00009 (theo) $\pm$ 0.00027(PDF), the total uncertainty being 0.00031. The measured value agrees with the standard model prediction. The total uncertainty varies between 0.00024 and 0.00035, depending on the PDF set. This is the most precise $ \sin^2\theta^\ell_{\mathrm{eff}} $ measurement at a hadron collider, with a precision comparable to the results obtained at LEP and SLD. | ||
| Links: CDS record (PDF) ; Physics Briefing ; CADI line (restricted) ; | ||
| Figures | |

png pdf |
Figure 1:
Misidentification rates measured in the 2018 samples, for electrons in the 2.0 $ < |\eta| < $ 2.5 bin that pass the single-lepton trigger. The several misidentification rates are: (1) majority (circles) and selective (squares) charge ID; (2) misidentification of electrons as positrons $ (+|-) $ (solid markers) or positrons as electrons $ (-|+) $ (open markers); (3) true (red), simulation (blue), and data (black). The true charge misidentification rate is measured by counting electrons with wrong reconstructed charge using the generated electron information, while simulation mis-identification rate is measured with the same method as in data, as described in the text. |

png pdf |
Figure 2:
Dilepton mass distributions in the same-sign dimuon samples (left) and single-muon triggered $ \mu\mathrm{e} $ events (right). The electroweak and top-quark backgrounds are normalized to the measured luminosity using the NNLO cross sections. The multijet background is evaluated by applying the transfer factors to the multijet-enriched sample of the same-sign leptons. The error bars include the statistical and background systematic uncertainties described in Section 5. |

png pdf |
Figure 2-a:
Dilepton mass distributions in the same-sign dimuon samples (left) and single-muon triggered $ \mu\mathrm{e} $ events (right). The electroweak and top-quark backgrounds are normalized to the measured luminosity using the NNLO cross sections. The multijet background is evaluated by applying the transfer factors to the multijet-enriched sample of the same-sign leptons. The error bars include the statistical and background systematic uncertainties described in Section 5. |

png pdf |
Figure 2-b:
Dilepton mass distributions in the same-sign dimuon samples (left) and single-muon triggered $ \mu\mathrm{e} $ events (right). The electroweak and top-quark backgrounds are normalized to the measured luminosity using the NNLO cross sections. The multijet background is evaluated by applying the transfer factors to the multijet-enriched sample of the same-sign leptons. The error bars include the statistical and background systematic uncertainties described in Section 5. |

png pdf |
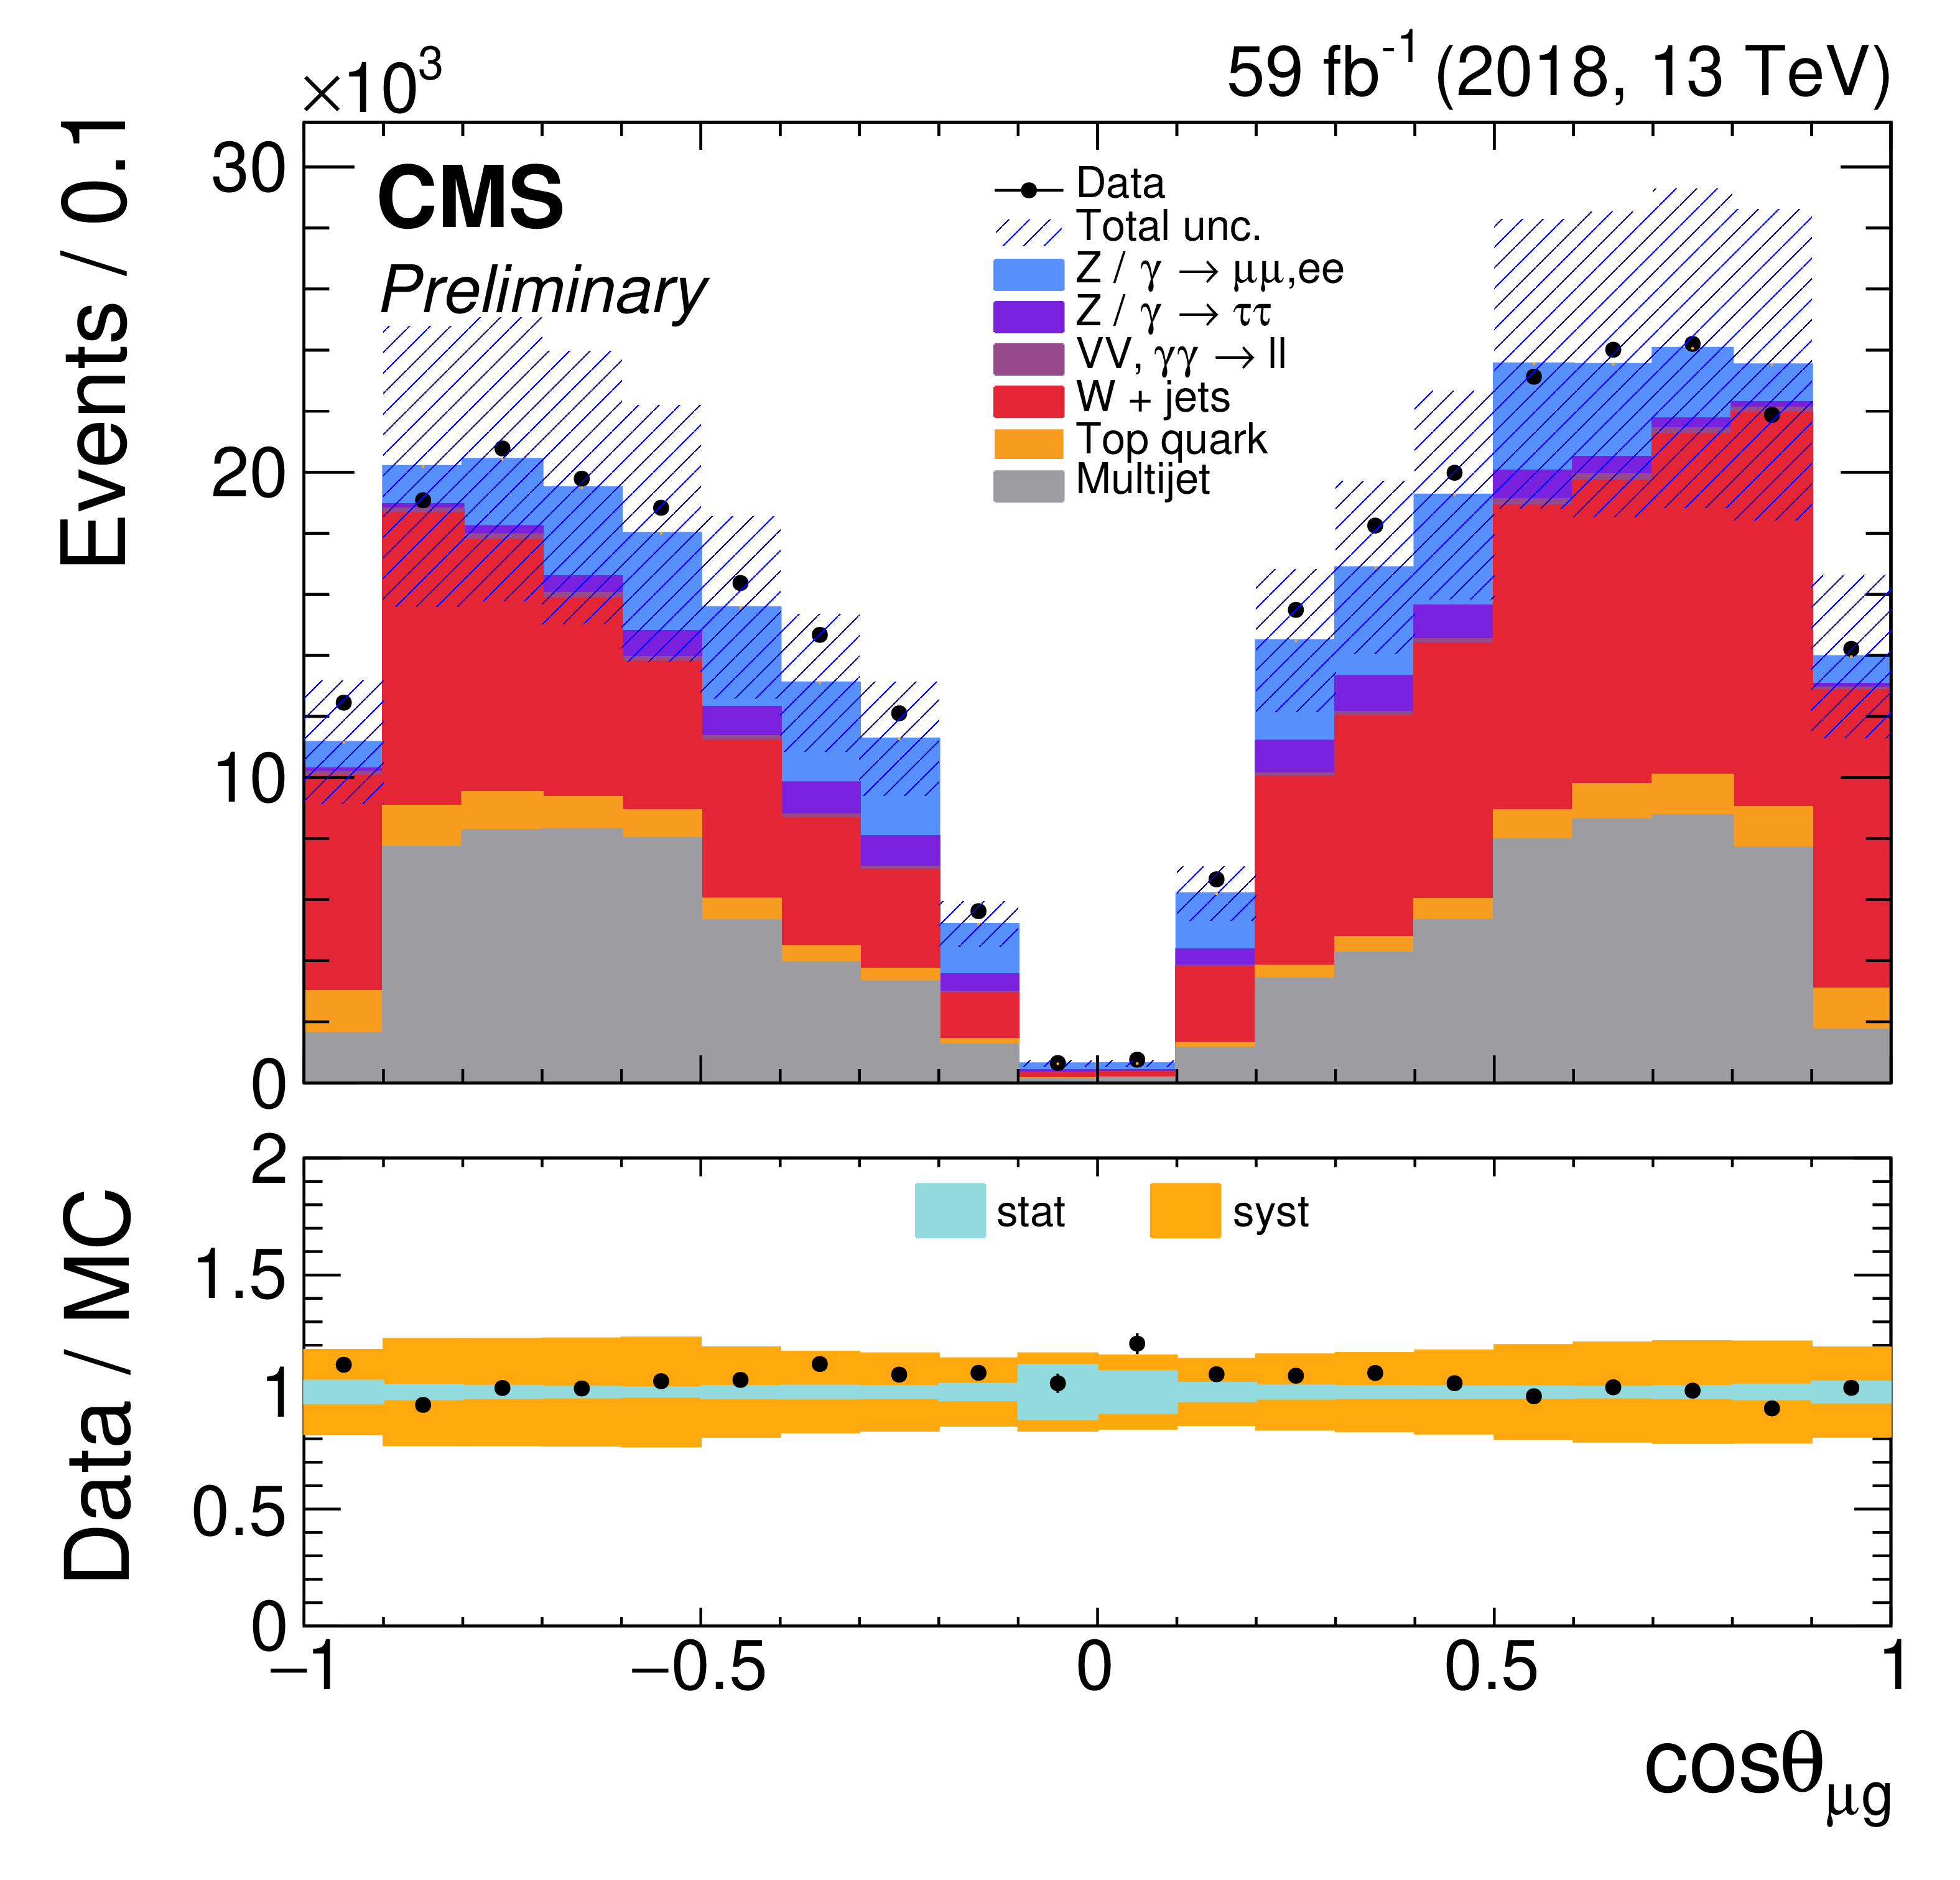
Figure 3:
Lepton $ \cos\theta_\mathrm{CS} $ distribution in $ \mu\mathrm{h} $ events. The multijet and W+jets backgrounds are scaled to the data as described in the text. The error bars include the statistical and background systematic uncertainties described in Section 5. |
png pdf |
Figure 3-a:
Lepton $ \cos\theta_\mathrm{CS} $ distribution in $ \mu\mathrm{h} $ events. The multijet and W+jets backgrounds are scaled to the data as described in the text. The error bars include the statistical and background systematic uncertainties described in Section 5. |

png pdf |
Figure 3-b:
Lepton $ \cos\theta_\mathrm{CS} $ distribution in $ \mu\mathrm{h} $ events. The multijet and W+jets backgrounds are scaled to the data as described in the text. The error bars include the statistical and background systematic uncertainties described in Section 5. |

png pdf |
Figure 4:
Dilepton mass (top), rapidity (middle), and $ \cos\theta_\mathrm{CS} $ (bottom) distributions, for the $ \mu\mu $ (left) and $ \mathrm{e}\mathrm{h} $ (right) channels in the 2018 data, after applying all the corrections. |

png pdf |
Figure 4-a:
Dilepton mass (top), rapidity (middle), and $ \cos\theta_\mathrm{CS} $ (bottom) distributions, for the $ \mu\mu $ (left) and $ \mathrm{e}\mathrm{h} $ (right) channels in the 2018 data, after applying all the corrections. |

png pdf |
Figure 4-b:
Dilepton mass (top), rapidity (middle), and $ \cos\theta_\mathrm{CS} $ (bottom) distributions, for the $ \mu\mu $ (left) and $ \mathrm{e}\mathrm{h} $ (right) channels in the 2018 data, after applying all the corrections. |

png pdf |
Figure 4-c:
Dilepton mass (top), rapidity (middle), and $ \cos\theta_\mathrm{CS} $ (bottom) distributions, for the $ \mu\mu $ (left) and $ \mathrm{e}\mathrm{h} $ (right) channels in the 2018 data, after applying all the corrections. |

png pdf |
Figure 4-d:
Dilepton mass (top), rapidity (middle), and $ \cos\theta_\mathrm{CS} $ (bottom) distributions, for the $ \mu\mu $ (left) and $ \mathrm{e}\mathrm{h} $ (right) channels in the 2018 data, after applying all the corrections. |

png pdf |
Figure 4-e:
Dilepton mass (top), rapidity (middle), and $ \cos\theta_\mathrm{CS} $ (bottom) distributions, for the $ \mu\mu $ (left) and $ \mathrm{e}\mathrm{h} $ (right) channels in the 2018 data, after applying all the corrections. |

png pdf |
Figure 4-f:
Dilepton mass (top), rapidity (middle), and $ \cos\theta_\mathrm{CS} $ (bottom) distributions, for the $ \mu\mu $ (left) and $ \mathrm{e}\mathrm{h} $ (right) channels in the 2018 data, after applying all the corrections. |

png pdf |
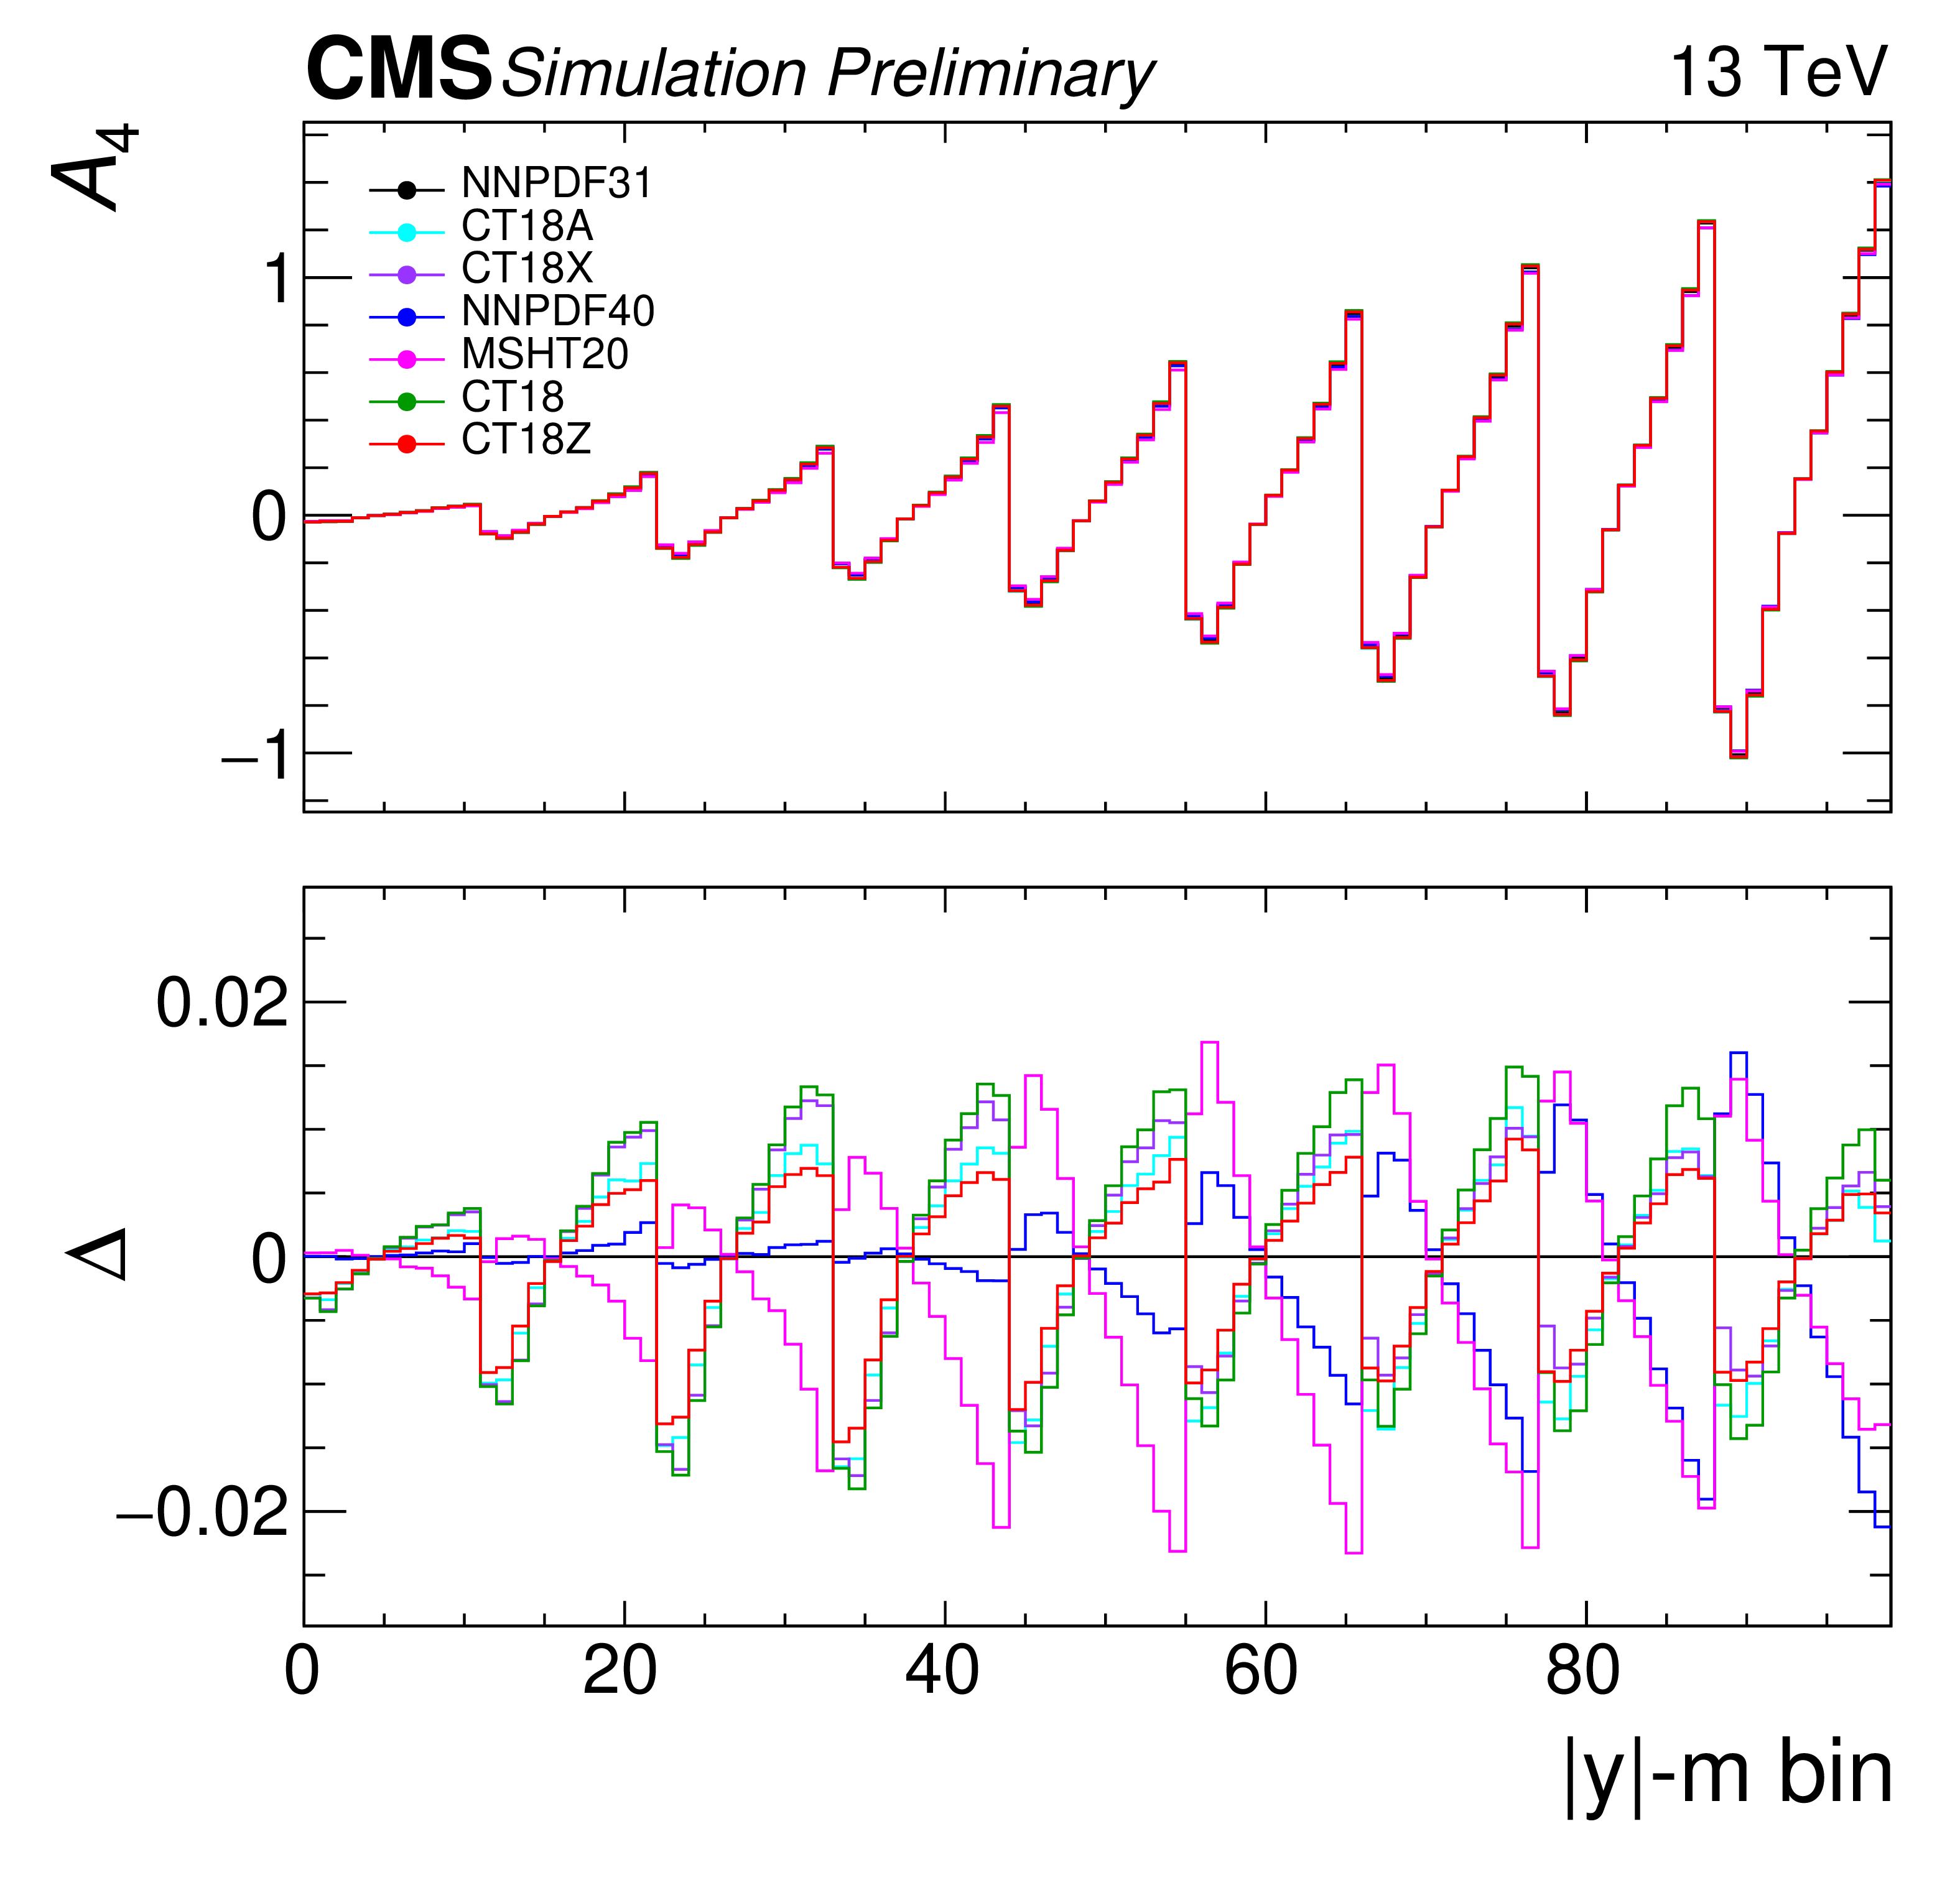
Figure 5:
Left: Effect of different POWHEG -EW variations in $ A_4(m) $. Right: Comparison of $ A_4(y,m) $ values for the central predictions of several PDF sets The $ y-m $ on the $ x $-axis corresponds to the serialized rapidity-mass bin. No lepton kinematic cuts are applied in these figures. |

png pdf |
Figure 5-a:
Left: Effect of different POWHEG -EW variations in $ A_4(m) $. Right: Comparison of $ A_4(y,m) $ values for the central predictions of several PDF sets The $ y-m $ on the $ x $-axis corresponds to the serialized rapidity-mass bin. No lepton kinematic cuts are applied in these figures. |
png pdf |
Figure 5-b:
Left: Effect of different POWHEG -EW variations in $ A_4(m) $. Right: Comparison of $ A_4(y,m) $ values for the central predictions of several PDF sets The $ y-m $ on the $ x $-axis corresponds to the serialized rapidity-mass bin. No lepton kinematic cuts are applied in these figures. |

png pdf |
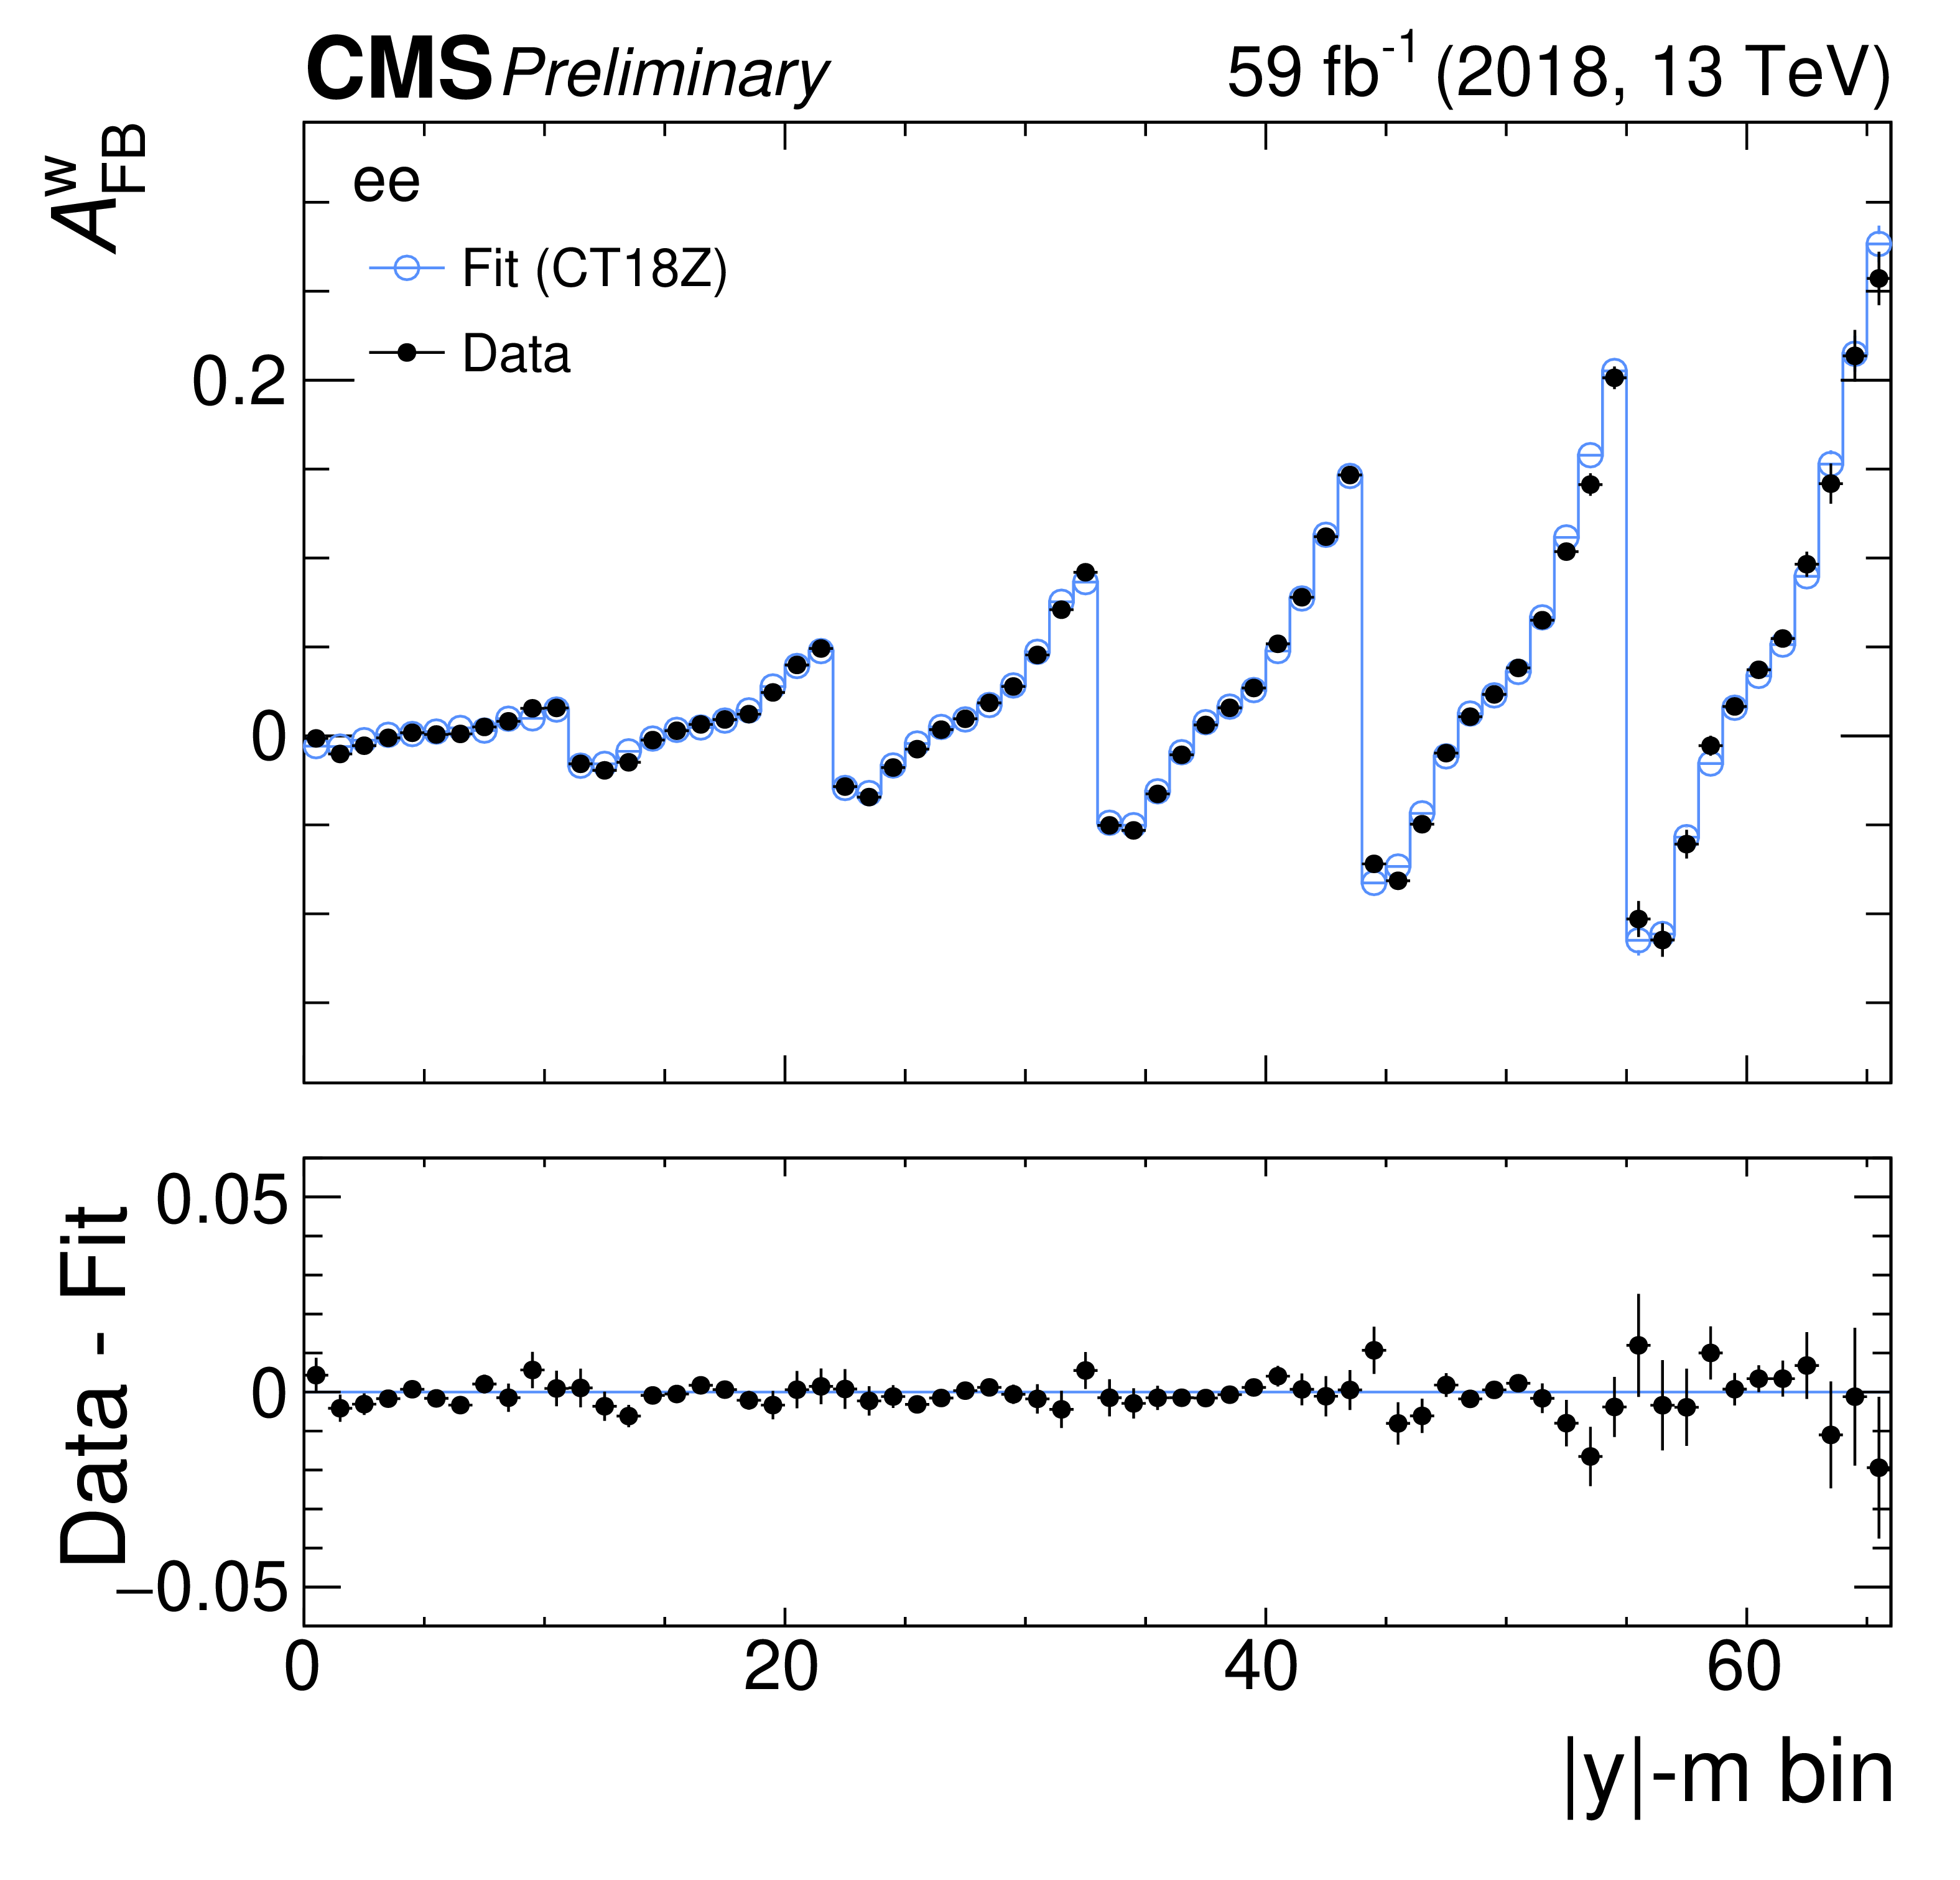
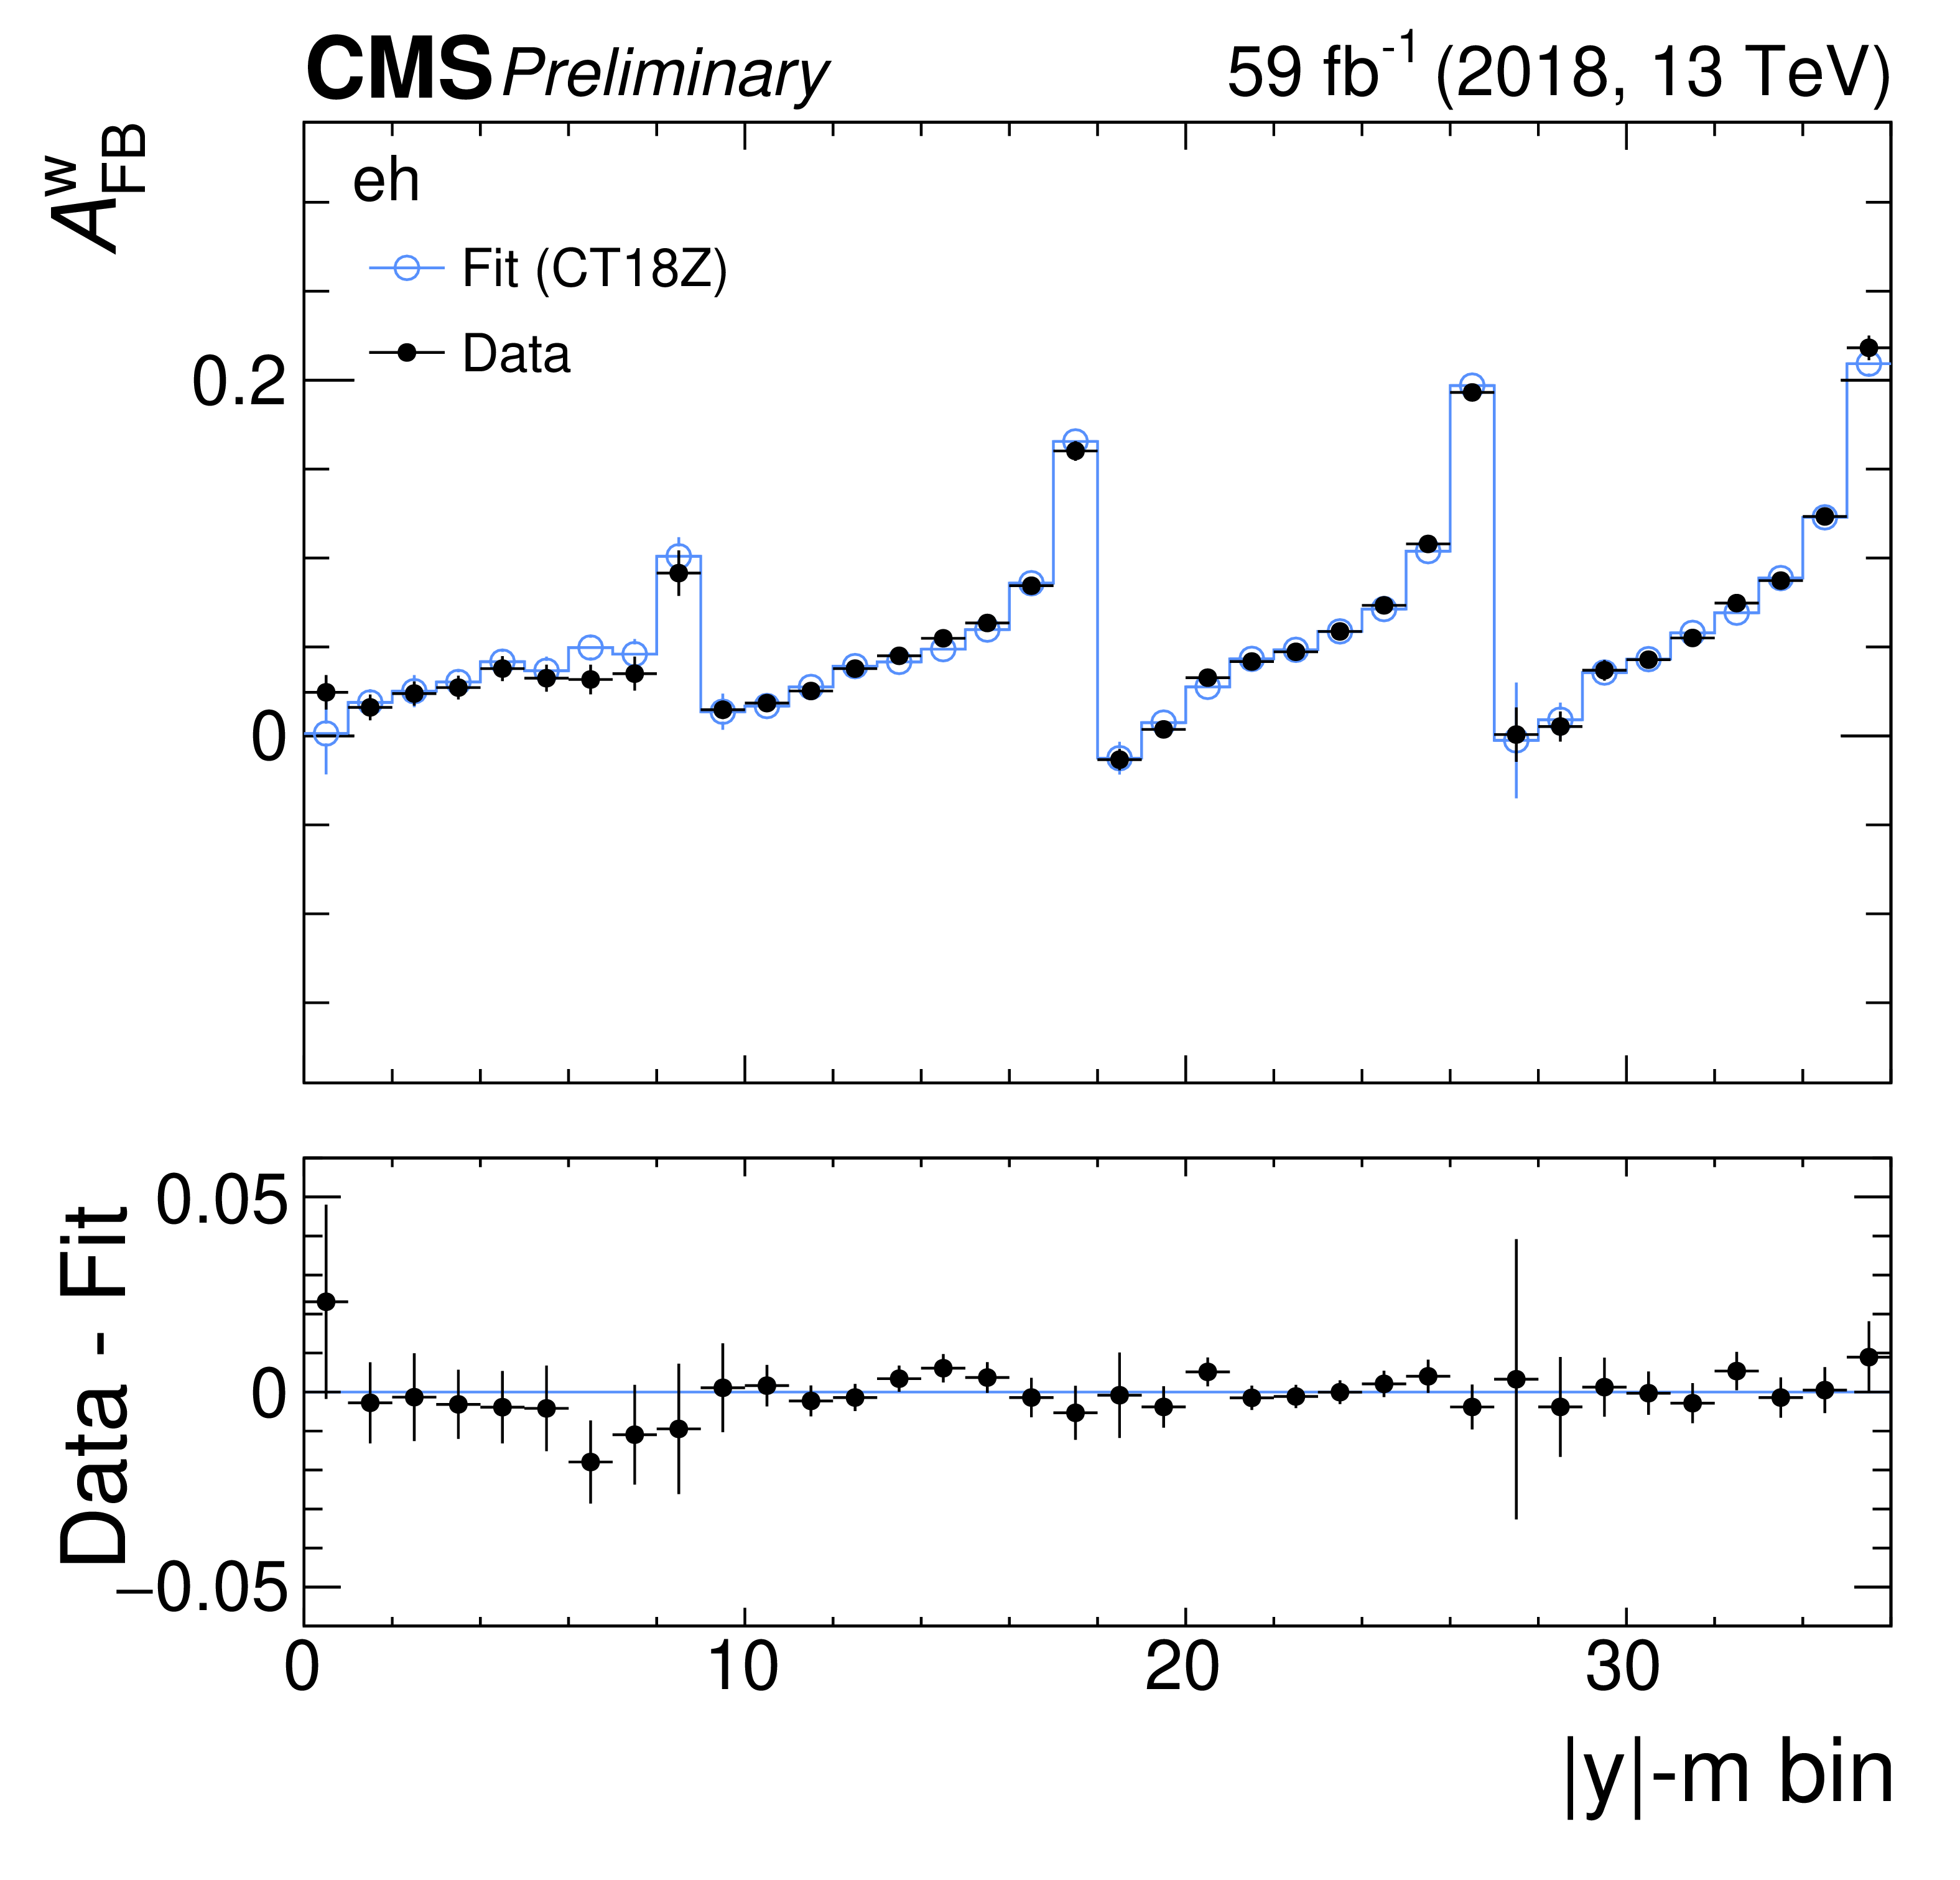
Figure 6:
Measured and best-fit angular weighted $ A_\mathrm{FB}^w(y,m) $ distributions for the 2018 period and in the $ \mu\mu $, $ \mathrm{e}\mathrm{e} $, $ \mathrm{e}\mathrm{g} $, and $ \mathrm{e}\mathrm{h} $ channels. The error bars represent the statistical uncertainties of the measured and simulated samples. |

png pdf |
Figure 6-a:
Measured and best-fit angular weighted $ A_\mathrm{FB}^w(y,m) $ distributions for the 2018 period and in the $ \mu\mu $, $ \mathrm{e}\mathrm{e} $, $ \mathrm{e}\mathrm{g} $, and $ \mathrm{e}\mathrm{h} $ channels. The error bars represent the statistical uncertainties of the measured and simulated samples. |
png pdf |
Figure 6-b:
Measured and best-fit angular weighted $ A_\mathrm{FB}^w(y,m) $ distributions for the 2018 period and in the $ \mu\mu $, $ \mathrm{e}\mathrm{e} $, $ \mathrm{e}\mathrm{g} $, and $ \mathrm{e}\mathrm{h} $ channels. The error bars represent the statistical uncertainties of the measured and simulated samples. |

png pdf |
Figure 6-c:
Measured and best-fit angular weighted $ A_\mathrm{FB}^w(y,m) $ distributions for the 2018 period and in the $ \mu\mu $, $ \mathrm{e}\mathrm{e} $, $ \mathrm{e}\mathrm{g} $, and $ \mathrm{e}\mathrm{h} $ channels. The error bars represent the statistical uncertainties of the measured and simulated samples. |
png pdf |
Figure 6-d:
Measured and best-fit angular weighted $ A_\mathrm{FB}^w(y,m) $ distributions for the 2018 period and in the $ \mu\mu $, $ \mathrm{e}\mathrm{e} $, $ \mathrm{e}\mathrm{g} $, and $ \mathrm{e}\mathrm{h} $ channels. The error bars represent the statistical uncertainties of the measured and simulated samples. |
png pdf |
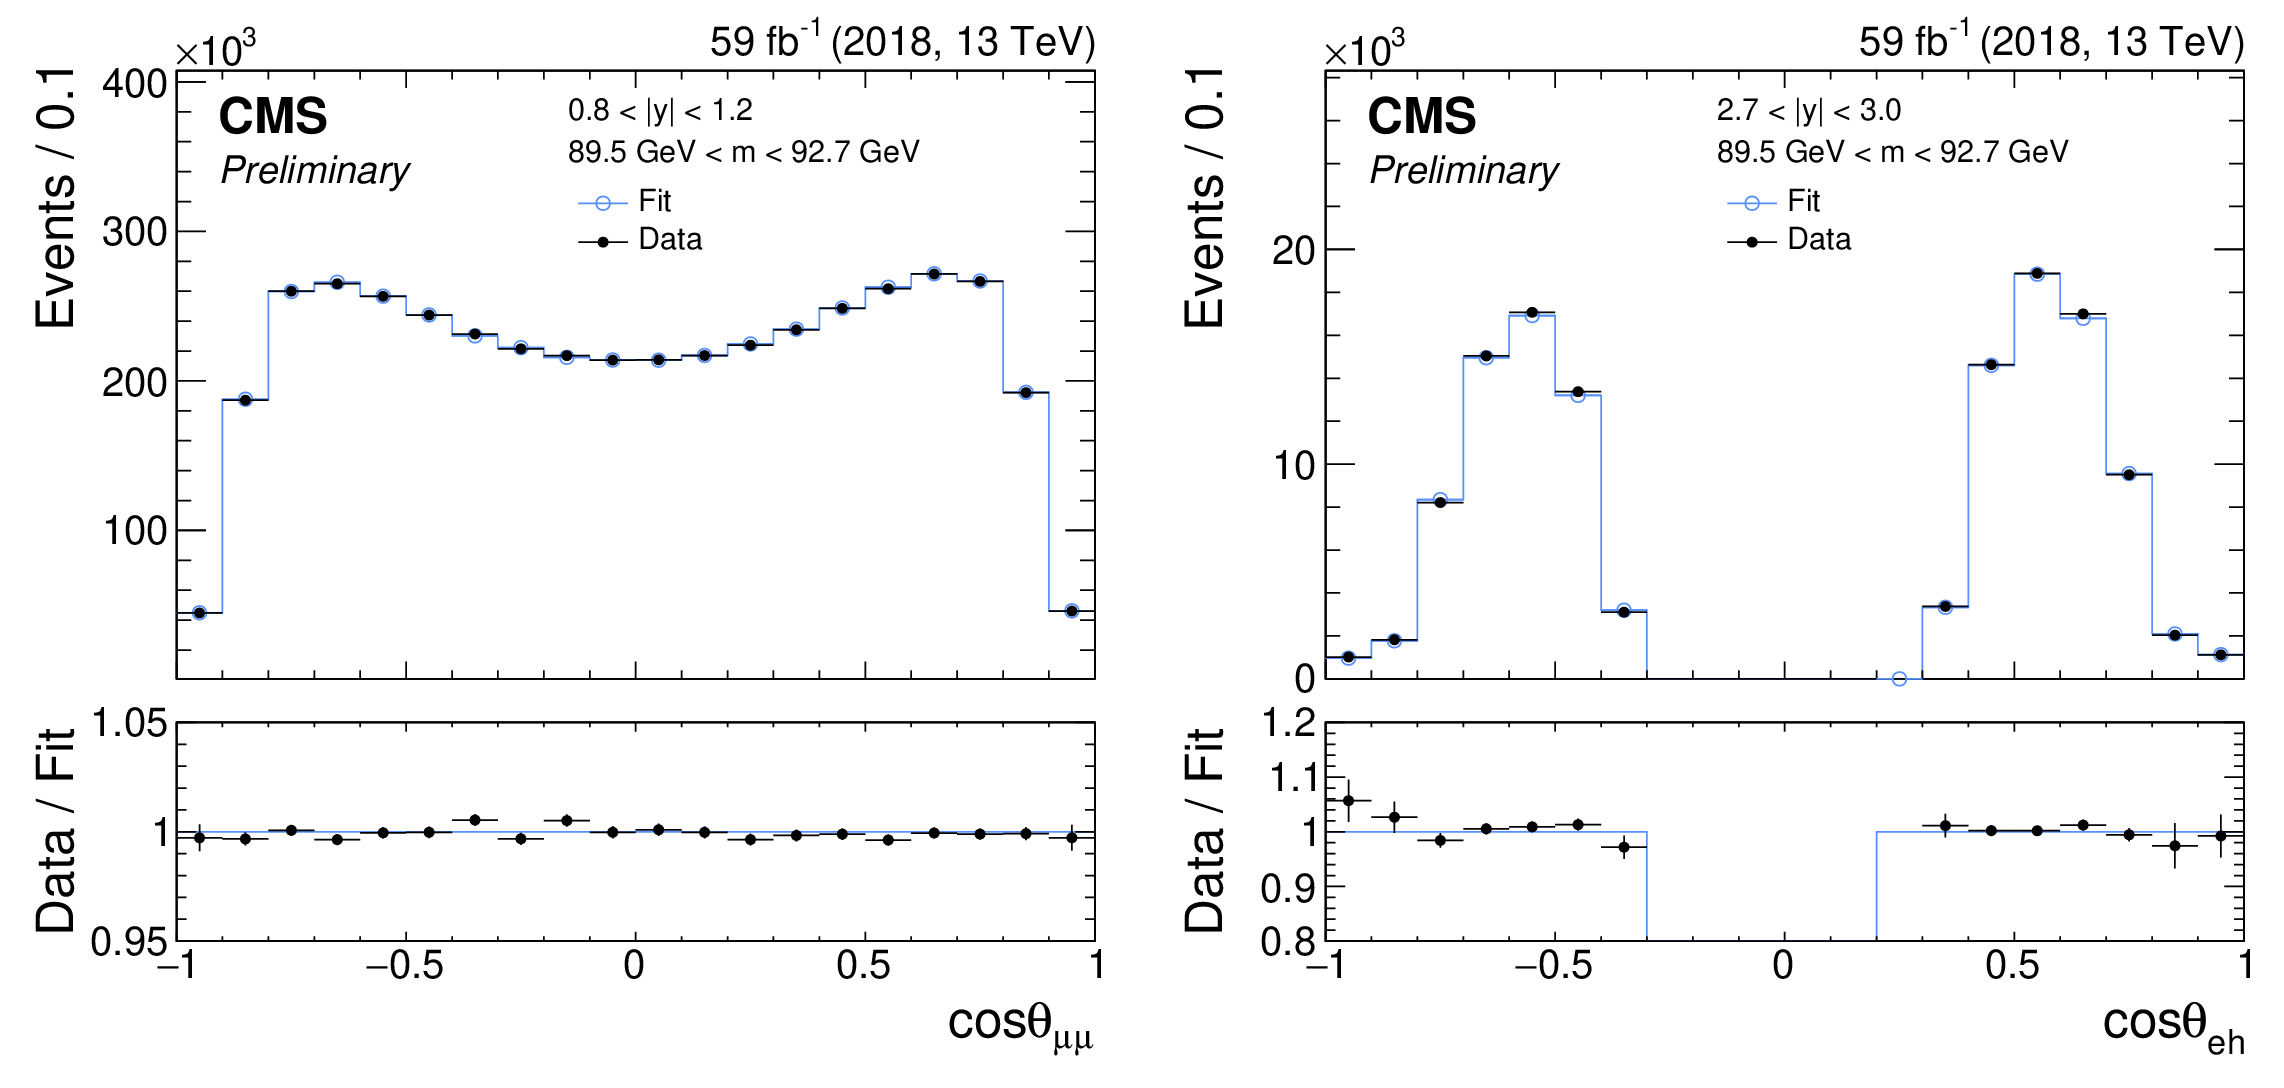
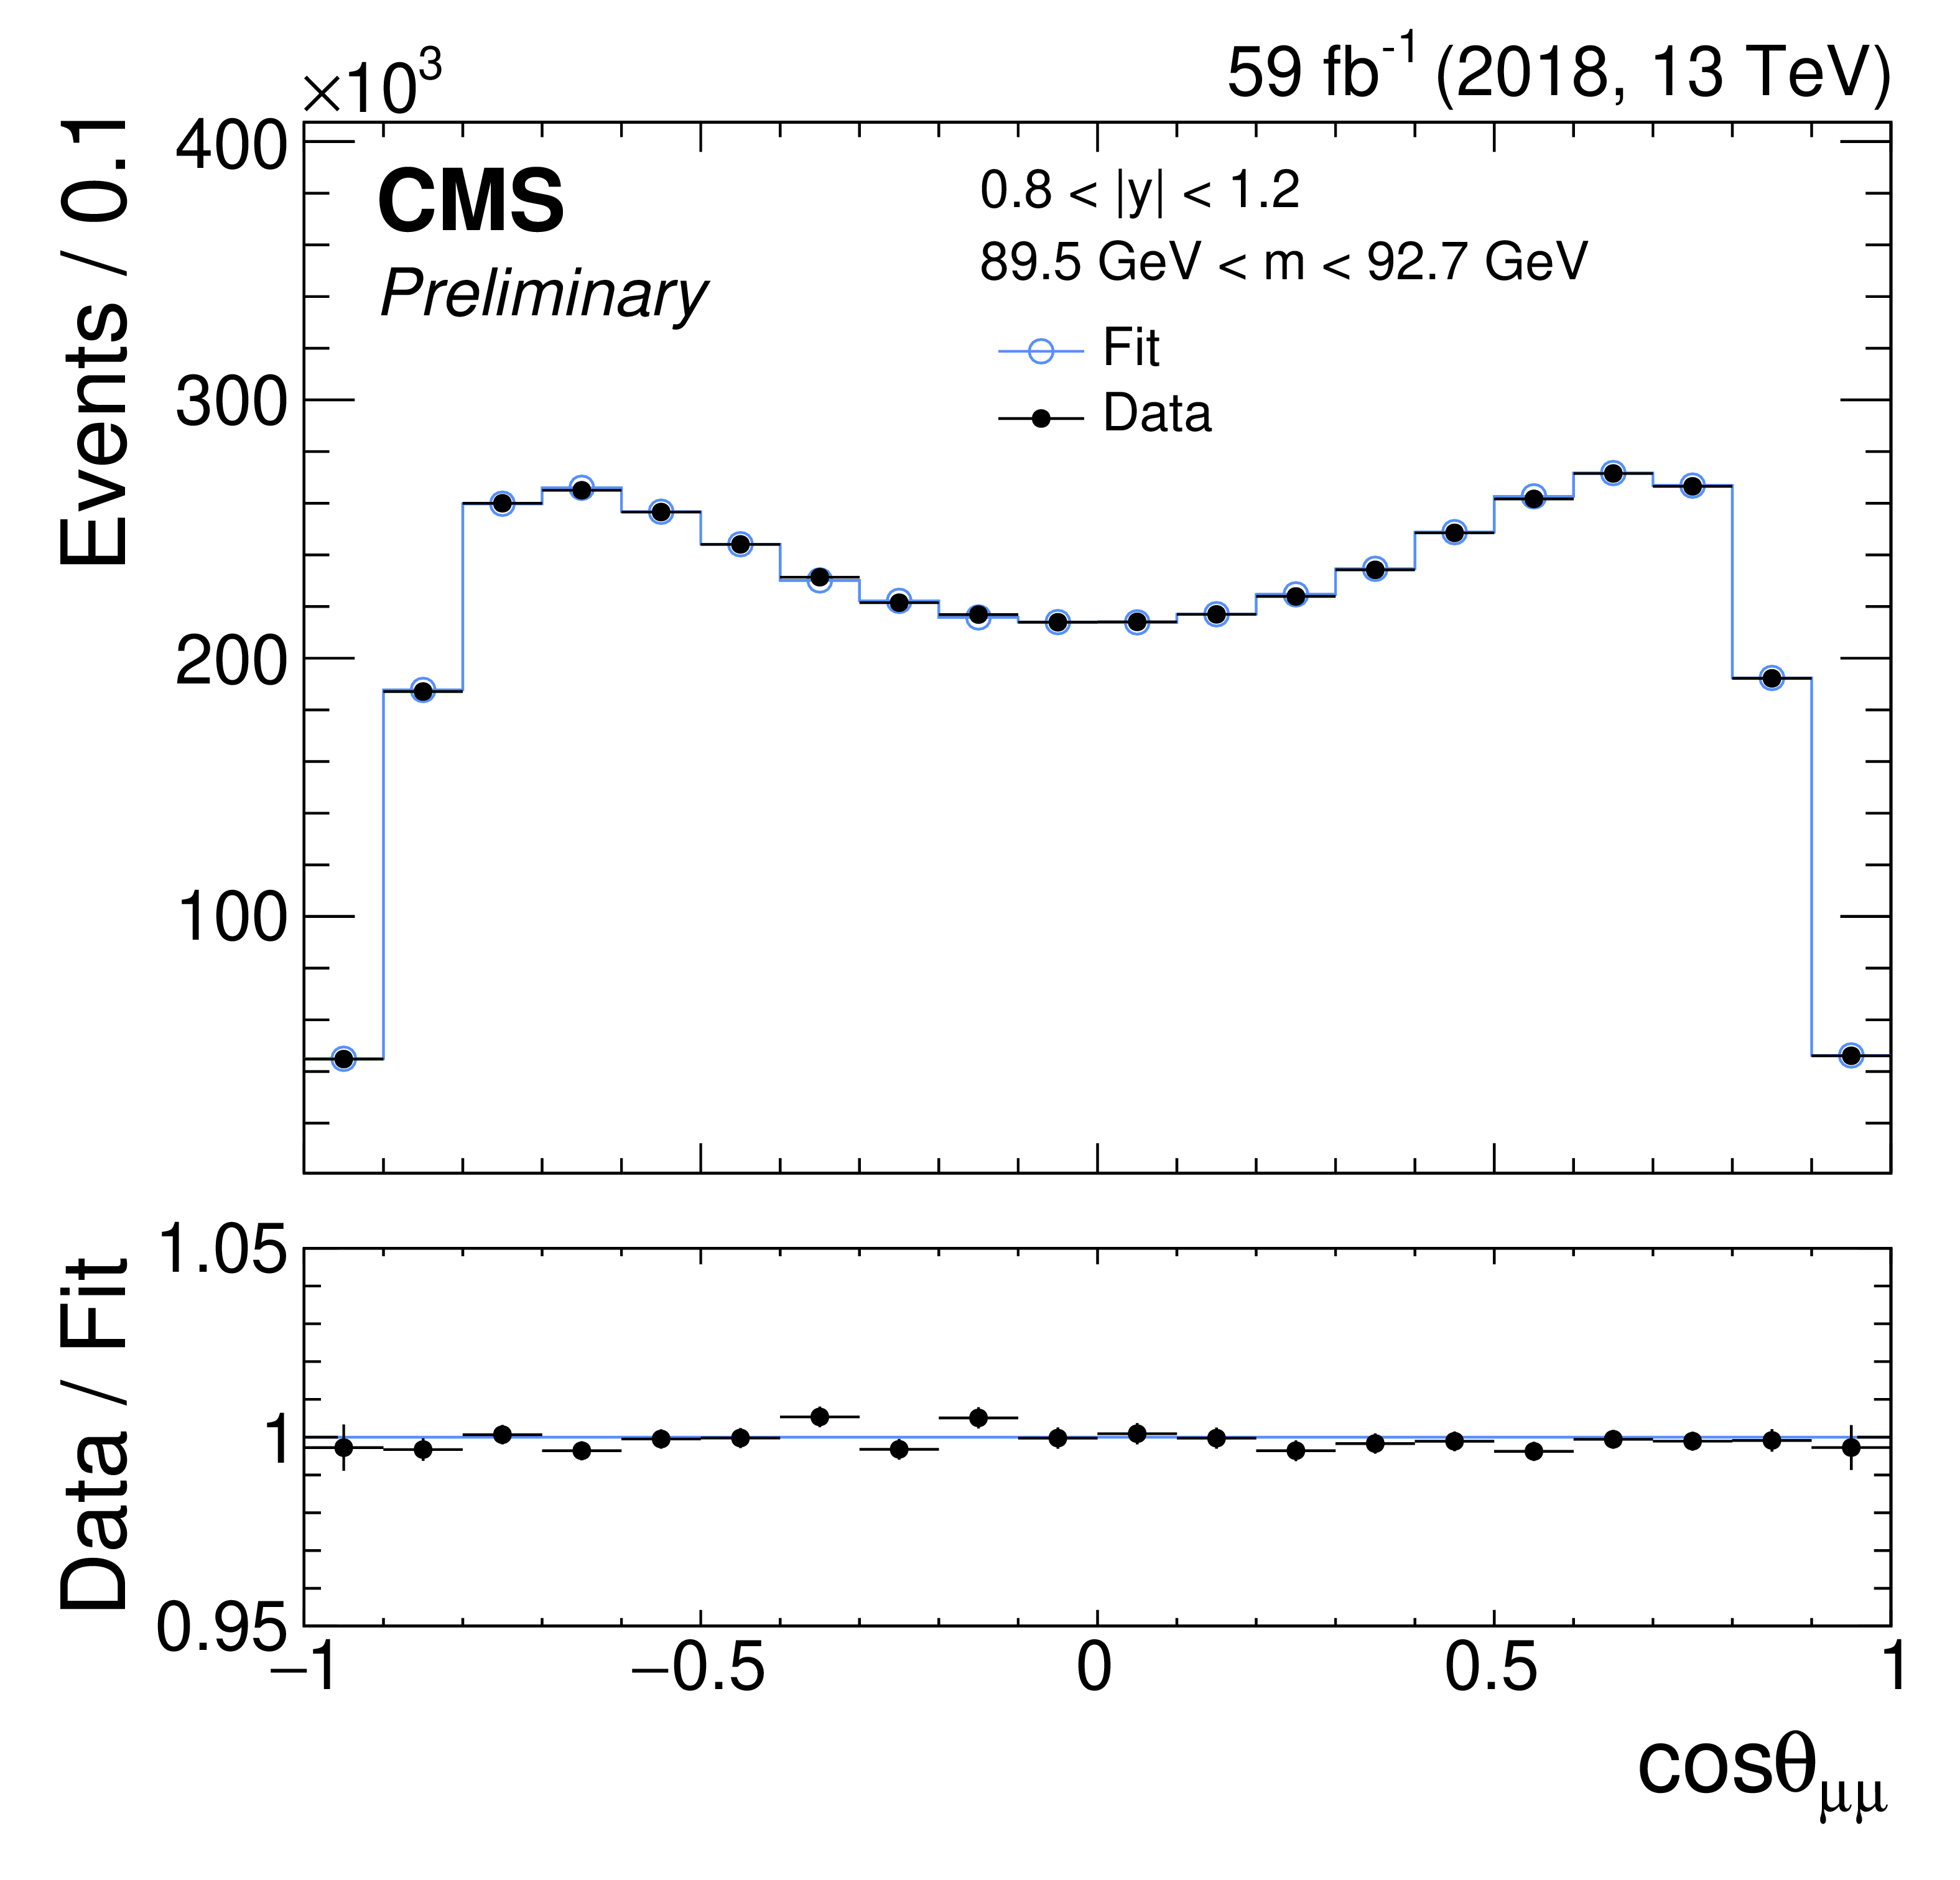
Figure 7:
Measured and best-fit $ \cos\theta_\mathrm{CS} $ distributions in the $ \mu\mu $ (left) and $ \mathrm{e}\mathrm{h} $ (right) channels of the 2018 samples, for the dilepton mass peak and relevant rapidity bins for each channel. The error bars represent the statistical uncertainties. |
png pdf |
Figure 7-a:
Measured and best-fit $ \cos\theta_\mathrm{CS} $ distributions in the $ \mu\mu $ (left) and $ \mathrm{e}\mathrm{h} $ (right) channels of the 2018 samples, for the dilepton mass peak and relevant rapidity bins for each channel. The error bars represent the statistical uncertainties. |

png pdf |
Figure 7-b:
Measured and best-fit $ \cos\theta_\mathrm{CS} $ distributions in the $ \mu\mu $ (left) and $ \mathrm{e}\mathrm{h} $ (right) channels of the 2018 samples, for the dilepton mass peak and relevant rapidity bins for each channel. The error bars represent the statistical uncertainties. |

png pdf |
Figure 8:
Measured and best-fit $ A_4(y,m) $ distributions in the combined Run 2 fit for the CT18Z PDF set. The shaded band represents the post-fit PDF uncertainty. |

png pdf |
Figure 9:
Values of $ \sin^2\theta_\mathrm{eff}^\ell $ measured in each of the four channels using the full Run 2 data sample (upper) and in each of the four data-taking periods combining the four channels (lower), using the CT18Z PDF set. The results obtained with the $ A_\mathrm{FB} $, $ A_4 $, and $ \cos\theta_\mathrm{CS} $ fits are shown using different markers and colors. The orange line and the yellow band correspond to the result obtained with all channels and runs combined. For the $ A_\mathrm{FB} $-based result, the violet error bands show the combined statistical and experimental systematic uncertainties, while the black error bars represent the total uncertainties. |

png pdf |
Figure 9-a:
Values of $ \sin^2\theta_\mathrm{eff}^\ell $ measured in each of the four channels using the full Run 2 data sample (upper) and in each of the four data-taking periods combining the four channels (lower), using the CT18Z PDF set. The results obtained with the $ A_\mathrm{FB} $, $ A_4 $, and $ \cos\theta_\mathrm{CS} $ fits are shown using different markers and colors. The orange line and the yellow band correspond to the result obtained with all channels and runs combined. For the $ A_\mathrm{FB} $-based result, the violet error bands show the combined statistical and experimental systematic uncertainties, while the black error bars represent the total uncertainties. |

png pdf |
Figure 9-b:
Values of $ \sin^2\theta_\mathrm{eff}^\ell $ measured in each of the four channels using the full Run 2 data sample (upper) and in each of the four data-taking periods combining the four channels (lower), using the CT18Z PDF set. The results obtained with the $ A_\mathrm{FB} $, $ A_4 $, and $ \cos\theta_\mathrm{CS} $ fits are shown using different markers and colors. The orange line and the yellow band correspond to the result obtained with all channels and runs combined. For the $ A_\mathrm{FB} $-based result, the violet error bands show the combined statistical and experimental systematic uncertainties, while the black error bars represent the total uncertainties. |
png pdf |
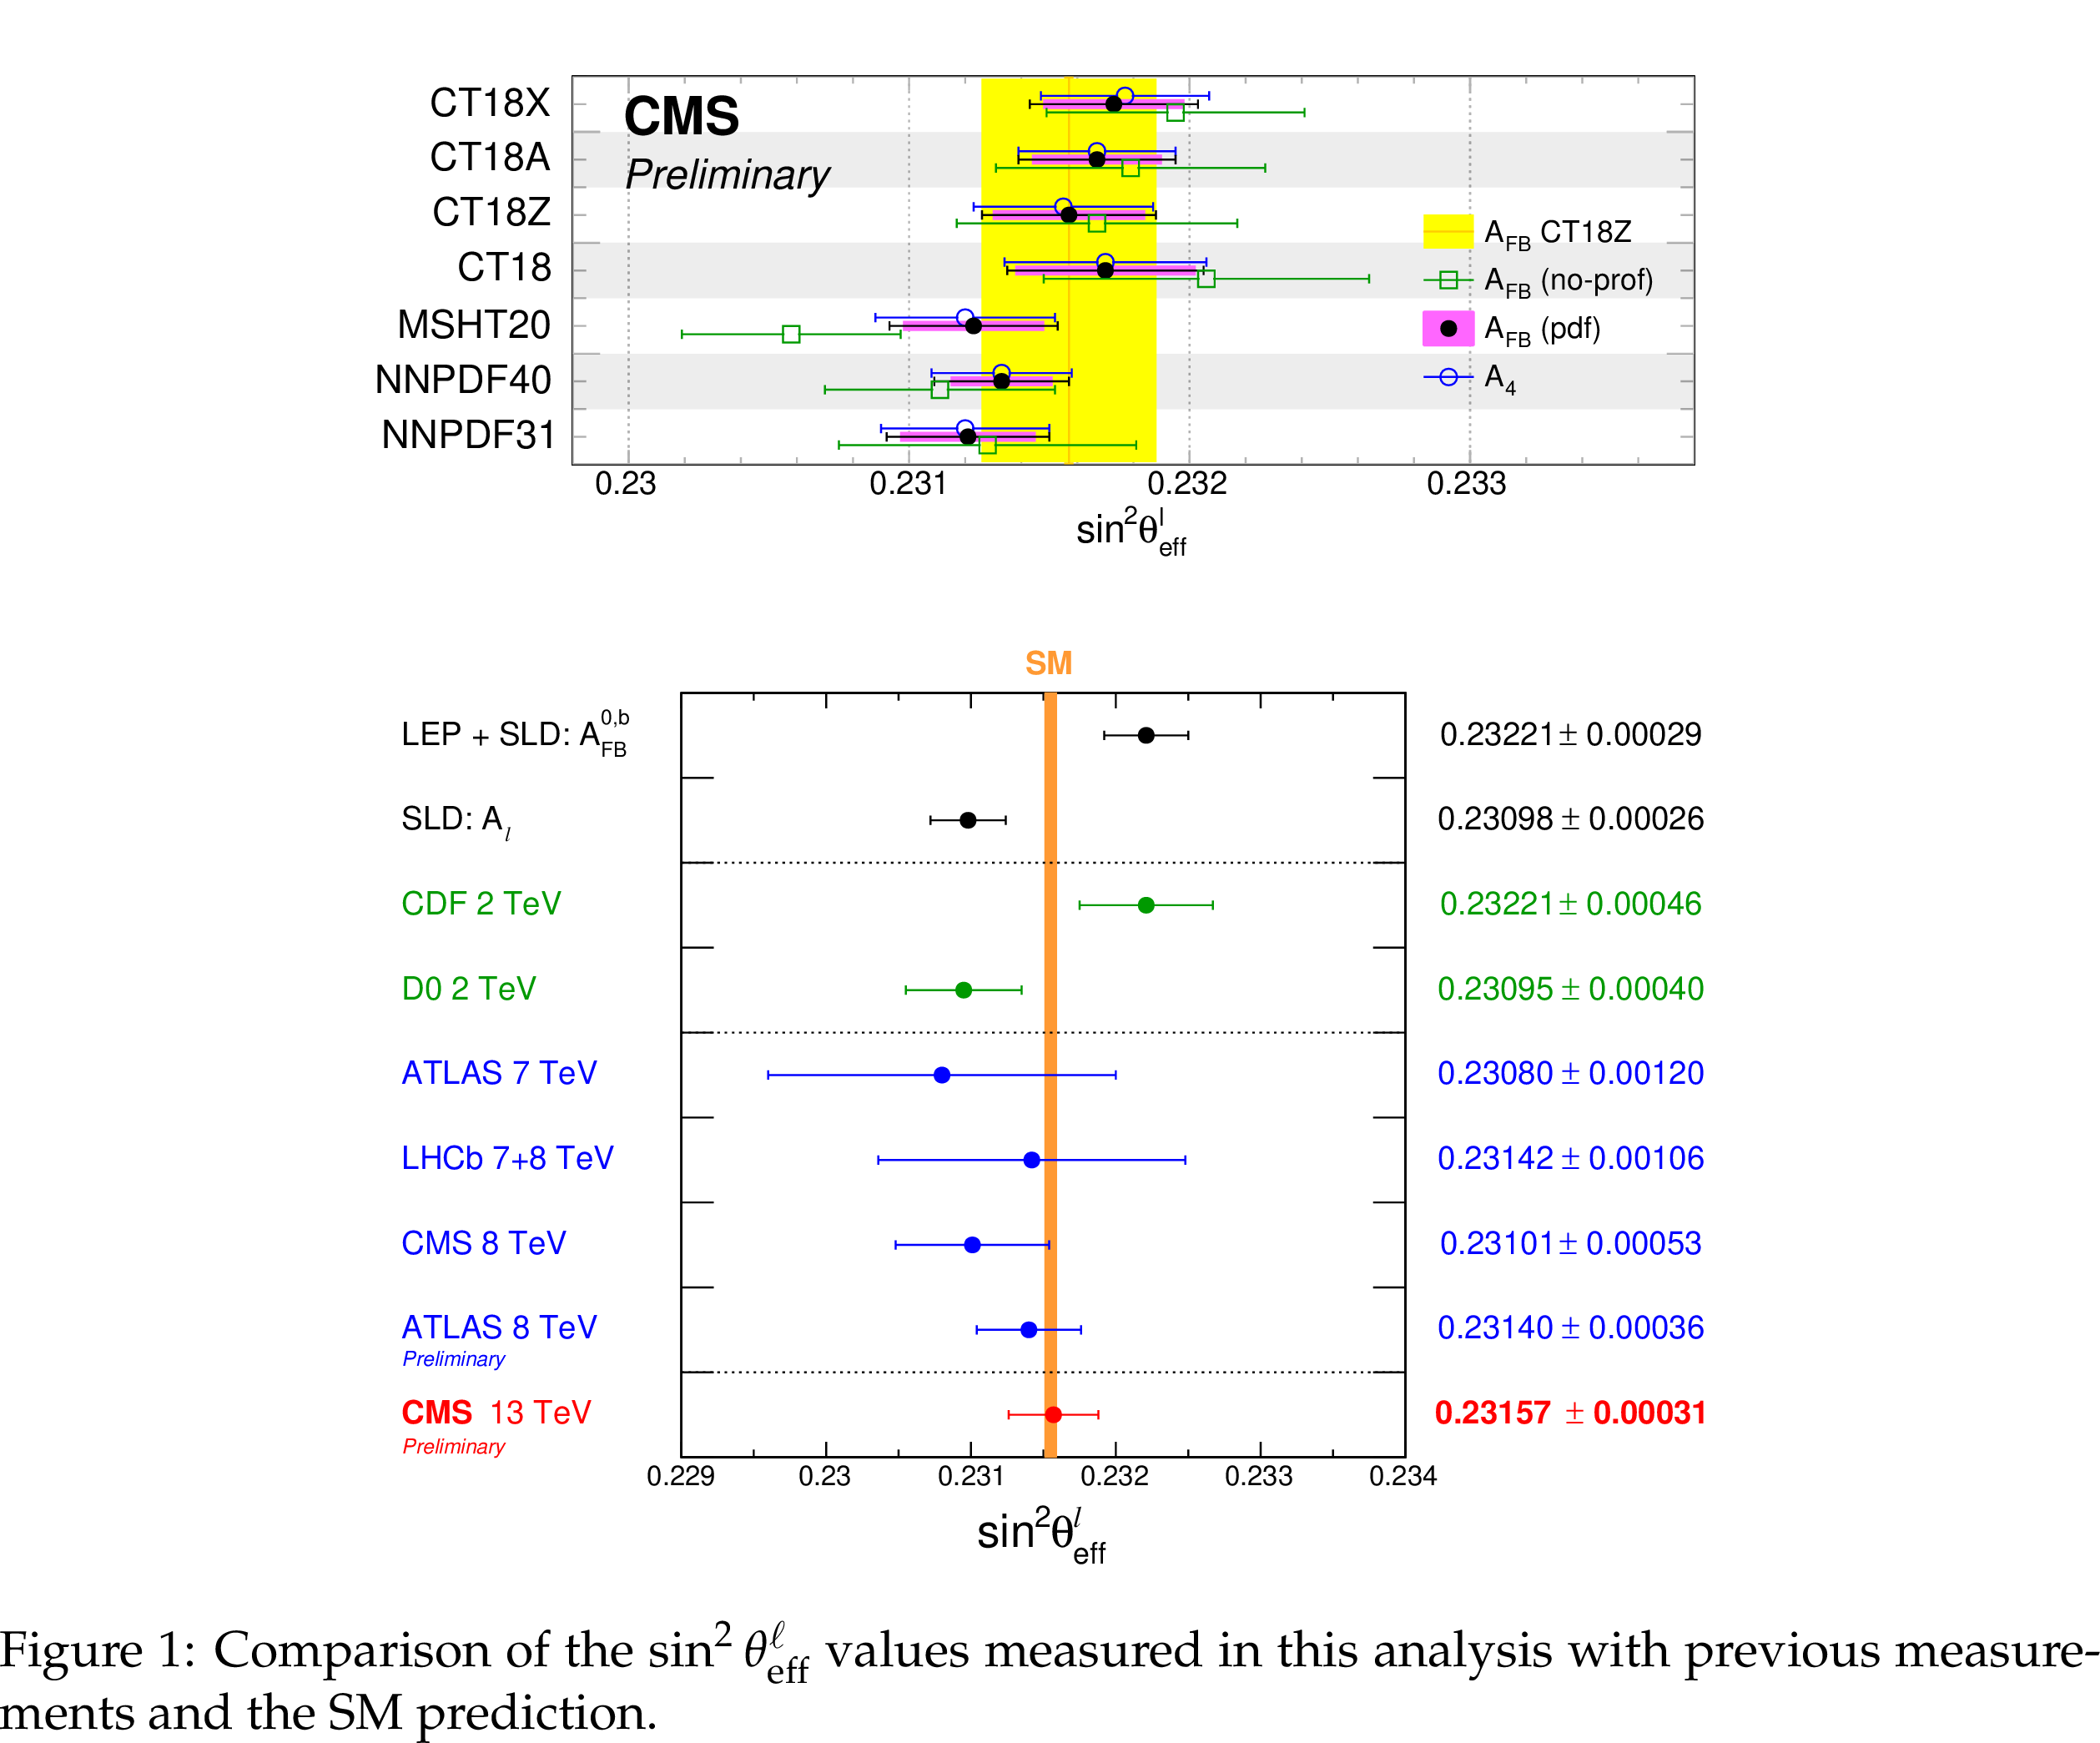
Figure 10:
Values of $ \sin^2\theta_\mathrm{eff}^\ell $ measured with the $ A_\mathrm{FB} $ and $ A_4 $ fits, for seven alternative PDF sets, combining the four detection channels and using the full Run 2 data sample. The orange line and the yellow band correspond to the default result, obtained with the CT18Z PDFs. The green open squares show the results obtained without profiling the corresponding PDF uncertainties. For the $ A_\mathrm{FB} $-based result, the violet error band represents the PDF uncertainty while the black error bar represents the total uncertainty. |

png pdf |
Figure 10-a:
Values of $ \sin^2\theta_\mathrm{eff}^\ell $ measured with the $ A_\mathrm{FB} $ and $ A_4 $ fits, for seven alternative PDF sets, combining the four detection channels and using the full Run 2 data sample. The orange line and the yellow band correspond to the default result, obtained with the CT18Z PDFs. The green open squares show the results obtained without profiling the corresponding PDF uncertainties. For the $ A_\mathrm{FB} $-based result, the violet error band represents the PDF uncertainty while the black error bar represents the total uncertainty. |
png pdf |
Figure 10-b:
Values of $ \sin^2\theta_\mathrm{eff}^\ell $ measured with the $ A_\mathrm{FB} $ and $ A_4 $ fits, for seven alternative PDF sets, combining the four detection channels and using the full Run 2 data sample. The orange line and the yellow band correspond to the default result, obtained with the CT18Z PDFs. The green open squares show the results obtained without profiling the corresponding PDF uncertainties. For the $ A_\mathrm{FB} $-based result, the violet error band represents the PDF uncertainty while the black error bar represents the total uncertainty. |
| Tables | |
png pdf |
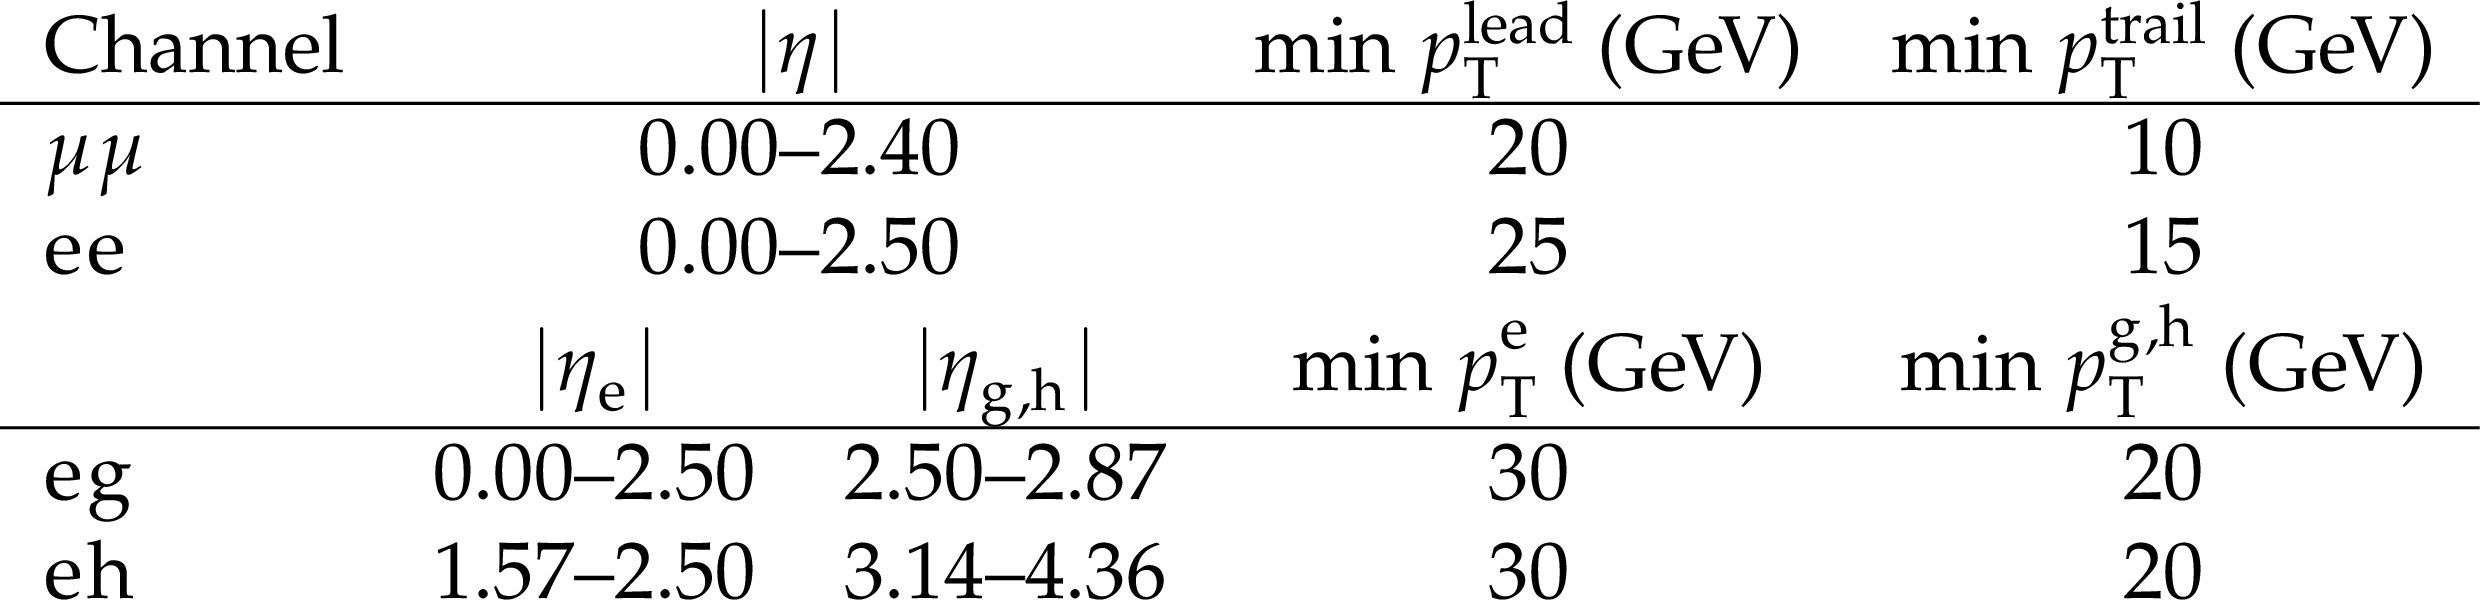
Table 1:
The lepton $ \eta $ and $ p_{\mathrm{T}} $ acceptance windows applied in the four measurement channels. The 1.44-1.57 $ |\eta| $ range between the barrel and endcap ECAL is excluded for central electrons. |

png pdf |
Table 2:
Free parameters in the $ A_\mathrm{FB}^w(y, m) $ fit. The ``Var." column indicates the number of variations for each type. For $ p_{\mathrm{T}} $ modeling, multijet, and W+jets background, ``Var." indicates the number of rapidity bins where these uncertainties are considered uncorrelated. Some of the ``Total" values reflect the four data-taking periods and/or the four final-state channels, when the corresponding uncertainties are uncorrelated. |

png pdf |
Table 3:
Fit results (in units of 10$^{-5} $) for the four final-state channels and for all ($ {\ell\ell} $) channels, using the full Run 2 event sample. The experimental systematic uncertainties (``exp") include all the uncertainties listed in the last four columns, which correspond to the statistical uncertainties of the MC samples and to the categories listed in Table 2. |

png pdf |
Table 4:
Number of bins and free parameters in the unfolding. |

png pdf |
Table 5:
Measured $ \sin^2\theta_\mathrm{eff}^\ell $ values when using the $ A_4(y,m) $ distributions for the four final-state channels and for all ($ {\ell\ell} $) channels. |

png pdf |
Table 6:
Values of $ \sin^2\theta_\mathrm{eff}^\ell $ measured with the $ A_\mathrm{FB} $ and $ A_4 $ fits, for seven alternative PDF sets, combining the four detection channels and using the full Run 2 data sample. The $ \sin^2\theta_\mathrm{eff}^\ell $ values are presented in units of $ 10^{-5} $. |
| Summary |
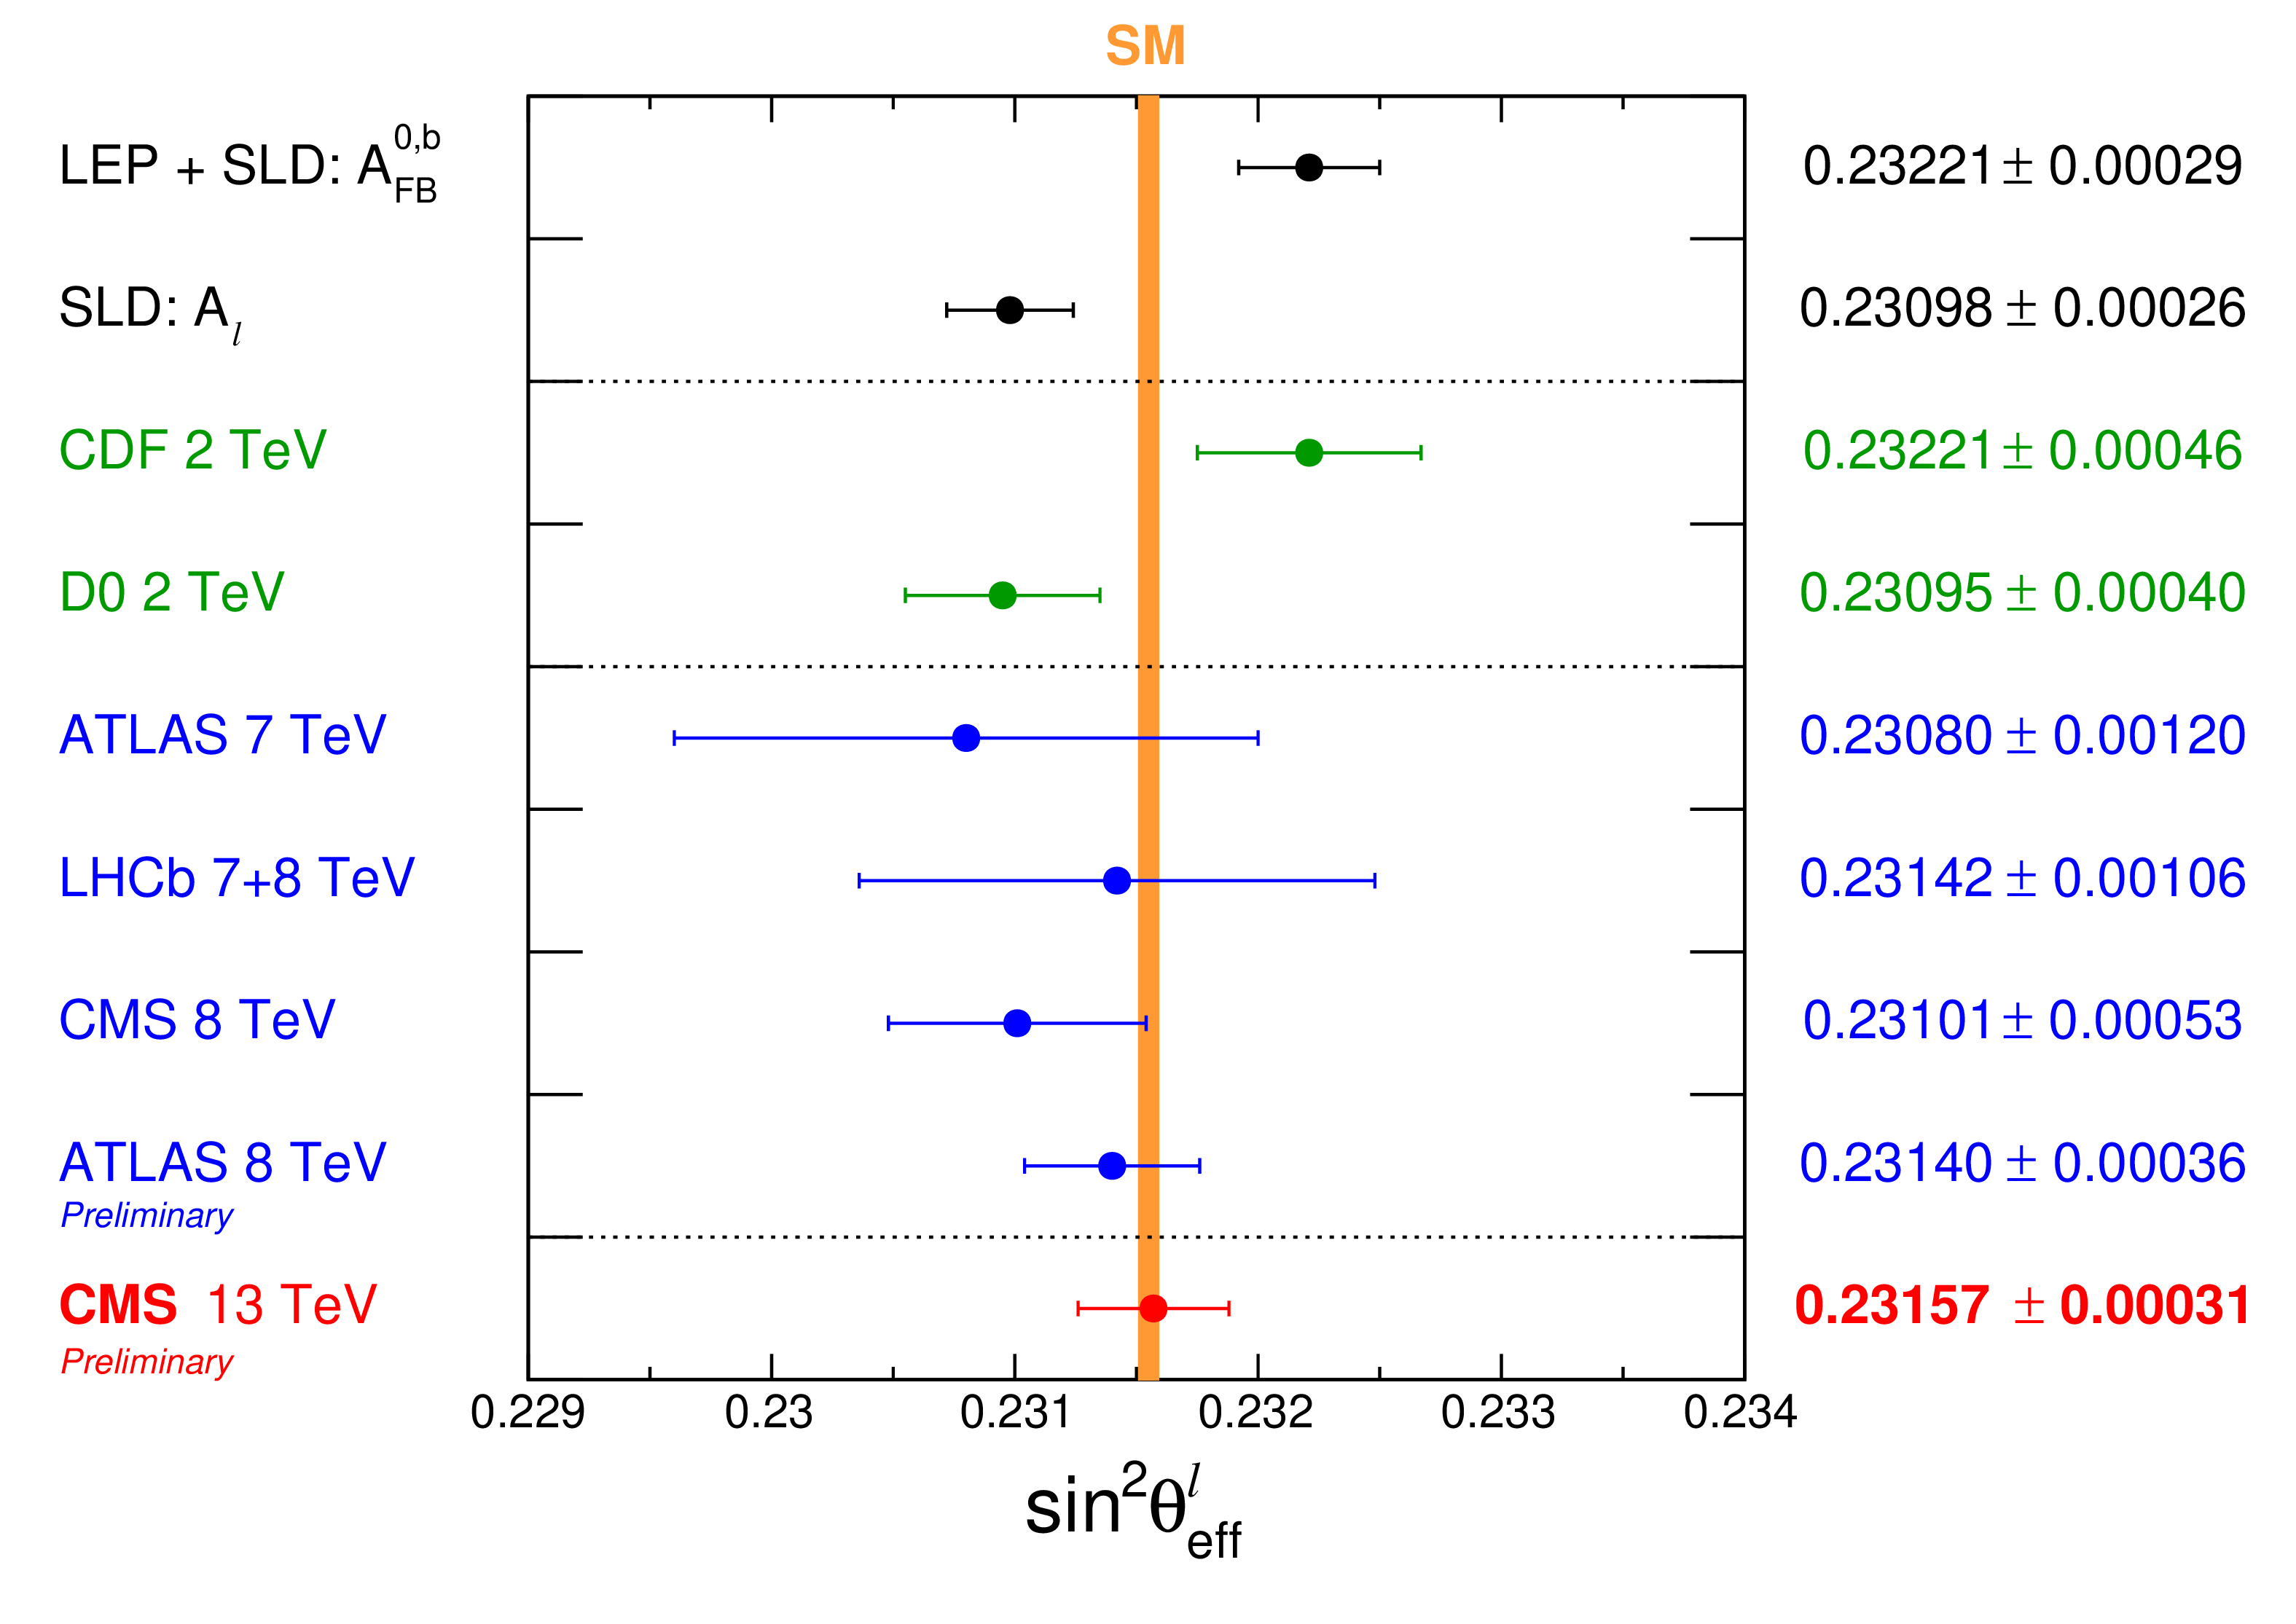
| A precise measurement of the effective leptonic electroweak mixing angle has been performed, using event samples of proton-proton collisions at $ \sqrt{s} = $ 13 TeV collected in 2016-2018 by the CMS experiment and corresponding to a total integrated luminosity of 137 fb$ ^{-1} $. The measurement, based on the study of Drell-Yan dimuon and dielectron events, has a significantly smaller uncertainty than that of previous CMS results, thanks to the increase in the size of the data samples, the improved analysis techniques, and the inclusion of central-forward dielectrons. Using the CT18Z set of parton densities, the result is $ \sin^2\theta_\mathrm{eff}^\ell = $ 0.23157 $\pm$ 0.00010 (stat) $\pm$ 0.00015 (syst) $\pm$ 0.00009 (theo) $\pm$ 0.00027(PDF). The total uncertainty, dominated by the PDF term, is 0.00031, accounting for correlated uncertainties; it varies between 0.00024 and 0.00035, depending on the PDF set used. For the central values of the CT18Z set, the combined statistical and experimental systematic uncertainty is 0.00014. The measured $ \sin^2\theta_\mathrm{eff}^\ell $ value is in good agreement with the standard model prediction, 0.23155 $ \pm $ 0.00004, and is the most precise among the hadron-collider measurements. The precision is comparable to that of the two most precise measurements performed in $ \mathrm{e}^+ \mathrm{e}^- $ collisions at LEP and SLD, with respective uncertainties of 0.00026 and 0.00029. We have also measured the $ A_4 $ coefficient differentially, as a function of the dilepton's mass and rapidity, a result that can be used in combination with other LHC measurements and in improvements of the $ \sin^2\theta_\mathrm{eff}^\ell $ measurement with future PDF sets. |
| References | ||||
| 1 | ALEPH, DELPHI, L3, OPAL, SLD, LEP Electroweak Working Group, SLD Electroweak Group, SLD Heavy Flavour Group Collaboration | Precision electroweak measurements on the $ Z $ resonance | Phys. Rept. 427 (2006) 257 | hep-ex/0509008 |
| 2 | Particle Data Group Collaboration | Review of Particle Physics | PTEP 2022 (2022) 083C01 | |
| 3 | D0 Collaboration | Measurement of the forward-backward charge asymmetry and extraction of $ \sin^2\theta_\mathrm{W}^{\mathrm{eff}} $ in $ \mathrm{p}\bar{\mathrm{p}}\rightarrow\mathrm{Z}/\gamma^*+X \rightarrow \mathrm{e}^+\mathrm{e}^- + X $ events produced at $ \sqrt{s}= $ 1.96 TeV | PRL 101 (2008) 191801 | 0804.3220 |
| 4 | D0 Collaboration | Measurement of $ \sin^2\theta_{\rm eff}^{\ell} $ and $ Z $-light quark couplings using the forward-backward charge asymmetry in $ p\bar{p} \to Z/\gamma^{*} \to e^{+}e^{-} $ events with $ {\cal L}= $ 5.0 fb$ ^{-1} $ at $ \sqrt{s}= $ 1.96 TeV | PRD 84 (2011) 012007 | 1104.4590 |
| 5 | CMS Collaboration | Measurement of the weak mixing angle with the Drell--Yan process in proton-proton collisions at the LHC | PRD 84 (2011) 112002 | CMS-EWK-11-003 1110.2682 |
| 6 | CDF Collaboration | Indirect measurement of $ \sin^2\theta_W (M_W) $ using $ e^+e^- $ pairs in the Z-boson region with $ p\bar{p} $ collisions at a center-of-momentum energy of 1.96 TeV | PRD 88 (2013) 072002 | 1307.0770 |
| 7 | CDF Collaboration | Indirect measurement of $ \sin^2 \theta_W $ (or $ M_W $) using $ \mu^+\mu^- $ pairs from $ \gamma^*/Z $ bosons produced in $ p\bar{p} $ collisions at a center-of-momentum energy of 1.96 TeV | PRD 89 (2014) 072005 | 1402.2239 |
| 8 | D0 Collaboration | Measurement of the effective weak mixing angle in $ p\bar{p}\rightarrow Z/\gamma^{*}\rightarrow e^{+}e^{-} $ events | PRL 115 (2015) 041801 | 1408.5016 |
| 9 | ATLAS Collaboration | Measurement of the forward-backward asymmetry of electron and muon pair-production in $ pp $ collisions at $ \sqrt{s} $ = 7 TeV with the ATLAS detector | JHEP 09 (2015) 049 | 1503.03709 |
| 10 | LHCb Collaboration | Measurement of the forward-backward asymmetry in $ Z/\gamma^{\ast} \rightarrow \mu^{+}\mu^{-} $ decays and determination of the effective weak mixing angle | JHEP 11 (2015) 190 | 1509.07645 |
| 11 | CDF Collaboration | Measurement of $ \sin^2\theta^{\rm lept}_{\rm eff} $ using $ e^+e^- $ pairs from $ \gamma^*/Z $ bosons produced in $ p\bar{p} $ collisions at a center-of-momentum energy of 1.96 TeV | PRD 93 (2016) 112016 | 1605.02719 |
| 12 | D0 Collaboration | Measurement of the effective weak mixing angle in $ p\bar{p}\rightarrow Z/\gamma^* \rightarrow \ell^+\ell^- $ events | PRL 120 (2018) 241802 | 1710.03951 |
| 13 | CDF, D0 Collaboration | Tevatron Run II combination of the effective leptonic electroweak mixing angle | PRD 97 (2018) 112007 | 1801.06283 |
| 14 | CMS Collaboration | Measurement of the weak mixing angle using the forward-backward asymmetry of Drell--Yan events in pp collisions at 8 TeV | EPJC 78 (2018) 701 | CMS-SMP-16-007 1806.00863 |
| 15 | ATLAS Collaboration | Measurement of the effective leptonic weak mixing angle using electron and muon pairs from $ Z $-boson decay in the ATLAS experiment at $ \sqrt s = $ 8 TeV | ATLAS Conference Note ATLAS-CONF-2018-037, 2018 | |
| 16 | J. C. Collins and D. E. Soper | Angular Distribution of Dileptons in High-Energy Hadron Collisions | PRD 16 (1977) 2219 | |
| 17 | A. Bodek | A simple event weighting technique for optimizing the measurement of the forward-backward asymmetry of Drell-Yan dilepton pairs at hadron colliders | EPJC 67 (2010) 321 | 0911.2850 |
| 18 | CMS Collaboration | The CMS experiment at the CERN LHC | JINST 3 (2008) S08004 | |
| 19 | CMS Collaboration | Development of the CMS detector for the CERN LHC Run 3 | Accepted by JINST, 2023 | CMS-PRF-21-001 2309.05466 |
| 20 | CMS Collaboration | Performance of the CMS Level-1 trigger in proton-proton collisions at $ \sqrt{s} = $ 13 TeV | JINST 15 (2020) P10017 | CMS-TRG-17-001 2006.10165 |
| 21 | CMS Collaboration | The CMS trigger system | JINST 12 (2017) P01020 | CMS-TRG-12-001 1609.02366 |
| 22 | CMS Collaboration | Electron and photon reconstruction and identification with the CMS experiment at the CERN LHC | JINST 16 (2021) P05014 | CMS-EGM-17-001 2012.06888 |
| 23 | CMS Collaboration | Performance of the CMS muon detector and muon reconstruction with proton-proton collisions at $ \sqrt{s}= $ 13 TeV | JINST 13 (2018) P06015 | CMS-MUO-16-001 1804.04528 |
| 24 | CMS Collaboration | Description and performance of track and primary-vertex reconstruction with the CMS tracker | JINST 9 (2014) P10009 | CMS-TRK-11-001 1405.6569 |
| 25 | CMS Collaboration | Particle-flow reconstruction and global event description with the CMS detector | JINST 12 (2017) P10003 | CMS-PRF-14-001 1706.04965 |
| 26 | CMS Collaboration | Performance of reconstruction and identification of $ \tau $ leptons decaying to hadrons and $ \nu_\tau $ in pp collisions at $ \sqrt{s}= $ 13 TeV | JINST 13 (2018) P10005 | CMS-TAU-16-003 1809.02816 |
| 27 | CMS Collaboration | Jet energy scale and resolution in the CMS experiment in pp collisions at 8 TeV | JINST 12 (2017) P02014 | CMS-JME-13-004 1607.03663 |
| 28 | CMS Collaboration | Performance of missing transverse momentum reconstruction in proton-proton collisions at $ \sqrt{s} = $ 13 TeV using the CMS detector | JINST 14 (2019) P07004 | CMS-JME-17-001 1903.06078 |
| 29 | CMS Collaboration | Precision luminosity measurement in proton-proton collisions at $ \sqrt{s} = $ 13 TeV in 2015 and 2016 at CMS | EPJC 81 (2021) 800 | CMS-LUM-17-003 2104.01927 |
| 30 | CMS Collaboration | CMS luminosity measurement for the 2017 data-taking period at $ \sqrt{s} = $ 13 TeV | CMS Physics Analysis Summary, 2018 link |
CMS-PAS-LUM-17-004 |
| 31 | CMS Collaboration | CMS luminosity measurement for the 2018 data-taking period at $ \sqrt{s} = $ 13 TeV | CMS Physics Analysis Summary, 2019 link |
CMS-PAS-LUM-18-002 |
| 32 | A. Hoecker et al. | Tmva - toolkit for multivariate data analysis | ||
| 33 | M. Cacciari, G. P. Salam, and G. Soyez | The anti-$ k_{\mathrm{T}} $ jet clustering algorithm | JHEP 04 (2008) 063 | 0802.1189 |
| 34 | M. Abadi et al. | TensorFlow: Large-Scale Machine Learning on Heterogeneous Distributed Systems | ||
| 35 | S. Frixione, P. Nason, and C. Oleari | Matching NLO QCD computations with Parton Shower simulations: the POWHEG method | JHEP 11 (2007) 070 | 0709.2092 |
| 36 | S. Alioli, P. Nason, C. Oleari, and E. Re | A general framework for implementing NLO calculations in shower Monte Carlo programs: the POWHEG BOX | JHEP 06 (2010) 043 | 1002.2581 |
| 37 | P. F. Monni et al. | MiNNLO$ _{PS} $: a new method to match NNLO QCD to parton showers | JHEP 05 (2020) 143 | 1908.06987 |
| 38 | P. F. Monni, E. Re, and M. Wiesemann | MiNNLO$ _{\text {PS}} $: optimizing 2 $ \rightarrow $ 1 hadronic processes | EPJC 80 (2020) 1075 | 2006.04133 |
| 39 | T. Sjöstrand et al. | An introduction to PYTHIA 8.2 | Comput. Phys. Commun. 191 (2015) 159 | 1410.3012 |
| 40 | E. Barberio and Z. Was | PHOTOS: A Universal Monte Carlo for QED radiative corrections. Version 2.0 | Comput. Phys. Commun. 79 (1994) 291 | |
| 41 | P. Golonka and Z. Was | PHOTOS Monte Carlo: A Precision tool for QED corrections in $ Z $ and $ W $ decays | EPJC 45 (2006) 97 | hep-ph/0506026 |
| 42 | J. Alwall et al. | The automated computation of tree-level and next-to-leading order differential cross sections, and their matching to parton shower simulations | JHEP 07 (2014) 079 | 1405.0301 |
| 43 | GEANT4 Collaboration | GEANT 4--a simulation toolkit | NIM A 506 (2003) 250 | |
| 44 | CMS Collaboration | Measurement of the inelastic proton-proton cross section at $ \sqrt{s}= $ 13 TeV | JHEP 07 (2018) 161 | CMS-FSQ-15-005 1802.02613 |
| 45 | L. Barze et al. | Neutral current Drell-Yan with combined QCD and electroweak corrections in the POWHEG BOX | EPJC 73 (2013) 2474 | 1302.4606 |
| 46 | M. Chiesa, F. Piccinini, and A. Vicini | Direct determination of $ \sin^2 \theta^\ell_{eff} $ at hadron colliders | PRD 100 (2019) 071302 | 1906.11569 |
| 47 | M. Chiesa, C. L. Del Pio, and F. Piccinini | On electroweak corrections to neutral current Drell-Yan with the POWHEG BOX | ||
| 48 | CMS Collaboration | Measurement of the Inclusive $ W $ and $ Z $ Production Cross Sections in $ pp $ Collisions at $ \sqrt{s}= $ 7 TeV | JHEP 10 (2011) 132 | CMS-EWK-10-005 1107.4789 |
| 49 | A. Bodek et al. | Extracting Muon Momentum Scale Corrections for Hadron Collider Experiments | EPJC 72 (2012) 2194 | 1208.3710 |
| 50 | B. Efron | Bootstrap Methods: Another Look at the Jackknife | Annals Statist. 7 (1979) 1 | |
| 51 | A. Bodek, J. Han, A. Khukhunaishvili, and W. Sakumoto | Using Drell-Yan forward-backward asymmetry to reduce PDF uncertainties in the measurement of electroweak parameters | EPJC 76 (2016) 115 | 1507.02470 |
| 52 | D. C. Liu and J. Nocedal | On the limited memory BFGS method for large scale optimization | Math. Programming 45 (1989) 503 | |
|
|
Compact Muon Solenoid LHC, CERN |
|

|

|

|

|

|