

Compact Muon Solenoid
LHC, CERN
| CMS-FSQ-15-001 ; CERN-PH-EP-2015-180 | ||
| Pseudorapidity distribution of charged hadrons in proton-proton collisions at $\sqrt{s} =$ 13 TeV | ||
| CMS Collaboration | ||
| 22 July 2015 | ||
| Phys. Lett. B 751 (2015) 143 | ||
| Abstract: The pseudorapidity distribution of charged hadrons in pp collisions at $\sqrt{s} =$ 13 TeV is reported using a data sample obtained with the CMS experiment at the CERN LHC. The yield of primary charged long-lived hadrons in inelastic pp collisions is determined in the barrel region of the CMS pixel detector ($|\eta|$ less than 2.0) using hit pairs and reconstructed tracks. For central pseudorapidities the charged-hadron multiplicity density of ${\rm d}n_{\rm ch}/{\rm d}\eta|_{|\eta| {\rm\ less\ than\ } 0.5} = 5.488 \pm 0.008 {\rm\ (stat)} \pm 0.169 {\rm\ (syst)}$ is obtained by combining the two methods. The result is compared to predictions from Monte Carlo event generators and data at lower collision energies. | ||
| Links: e-print arXiv:1507.05915 [hep-ex] (PDF) ; CDS record ; inSPIRE record ; Public twiki page ; Rivet record ; HepData record ; CADI line (restricted) ; | ||
| Figures | |
png pdf |
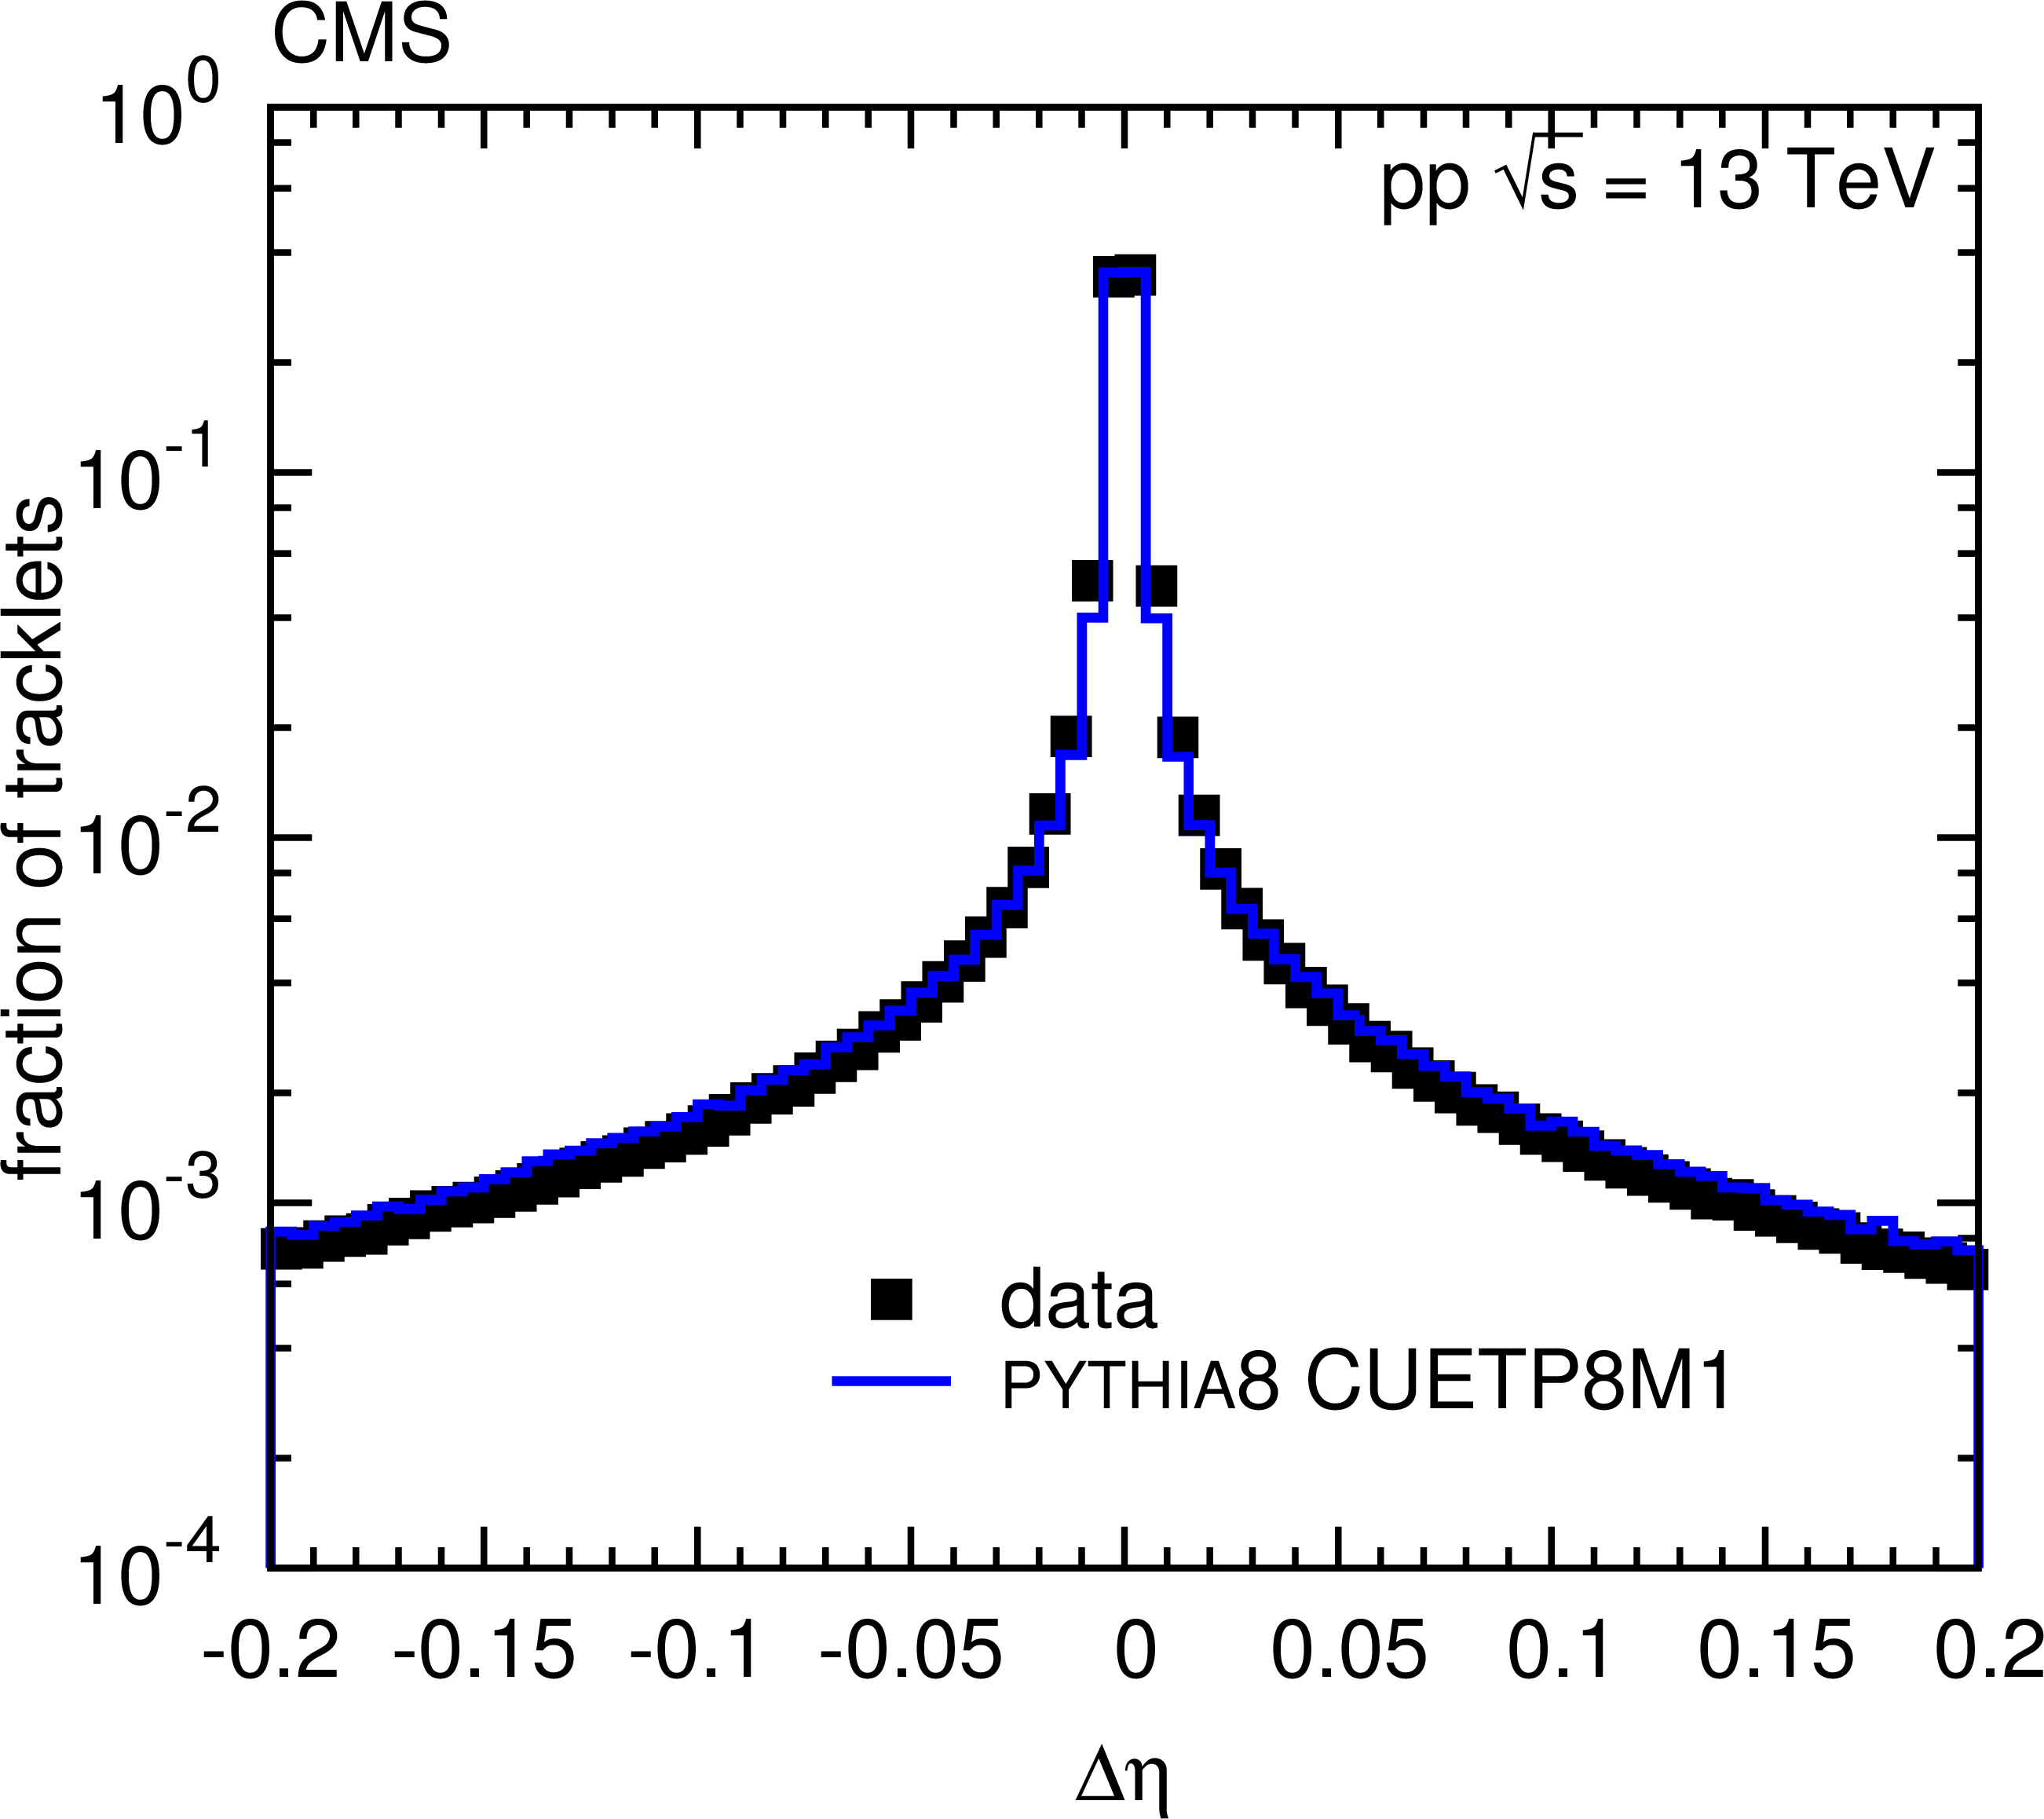
Figure 1-a:
The $\Delta \eta $ (a) and $\Delta \phi $ (b) distributions of hit pairs on tracklets in the data (squares) and from MC simulation (histogram). |
png pdf |
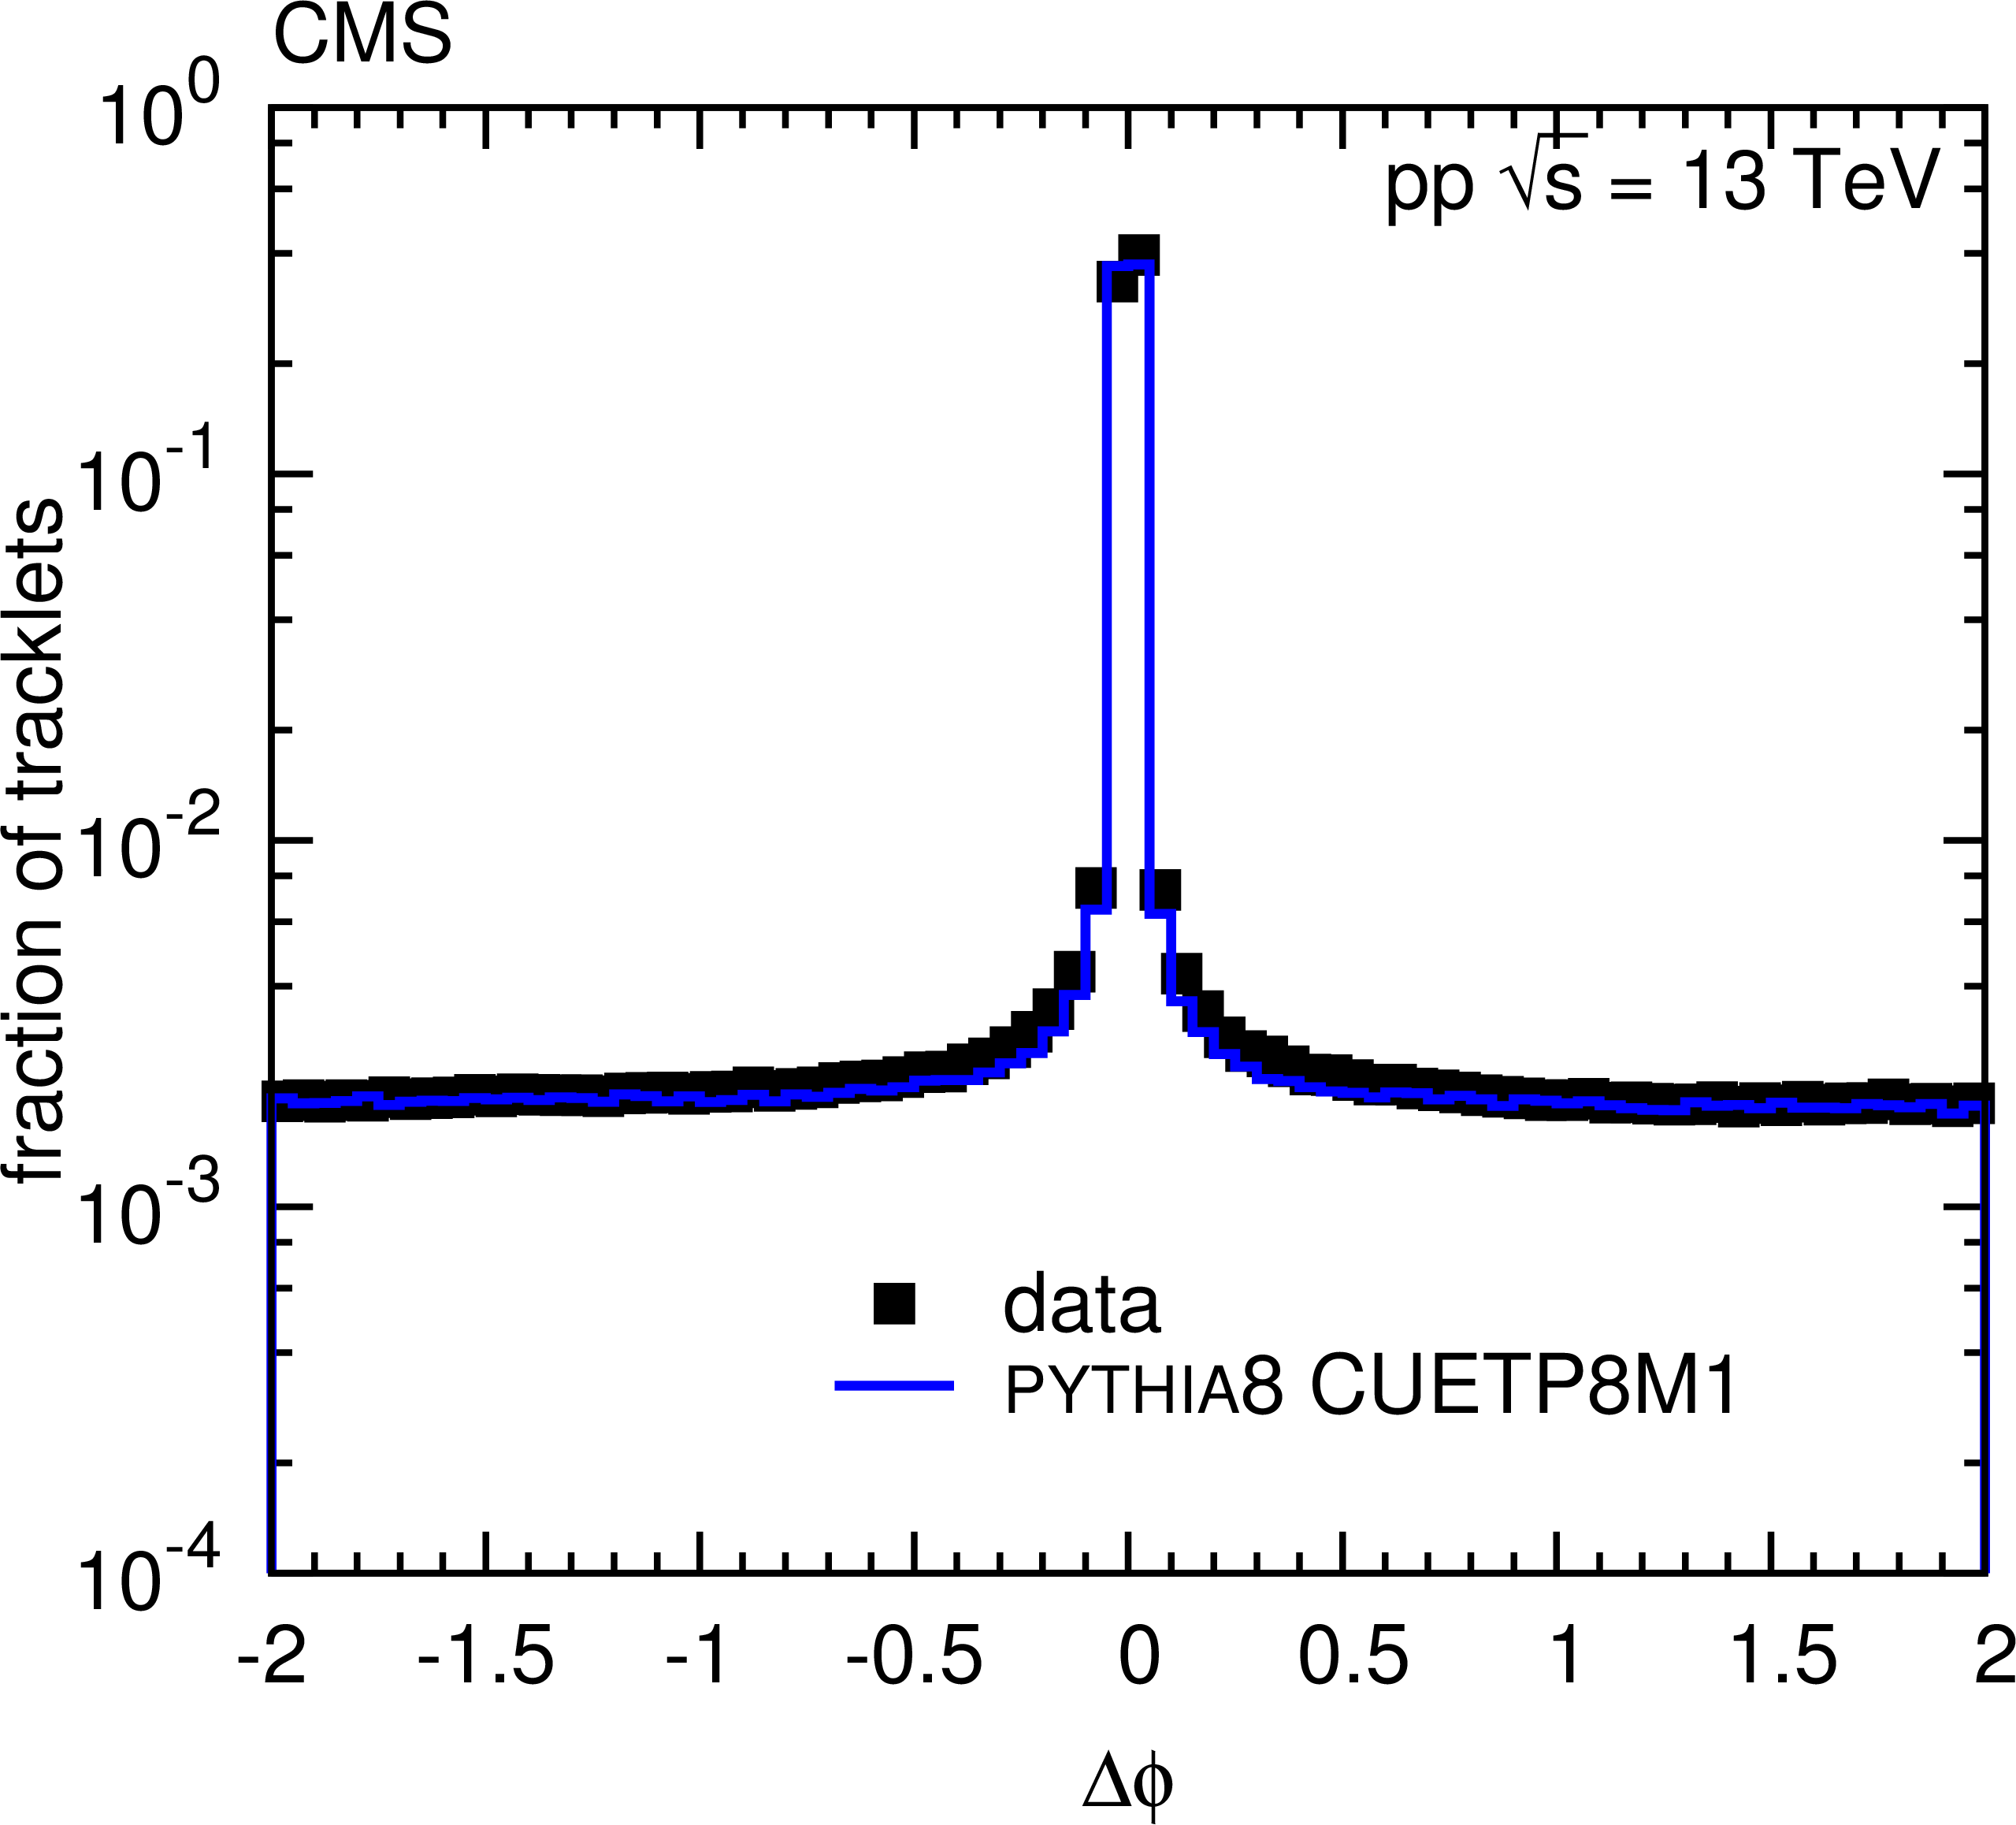
Figure 1-b:
The $\Delta \eta $ (a) and $\Delta \phi $ (b) distributions of hit pairs on tracklets in the data (squares) and from MC simulation (histogram). |
png pdf |
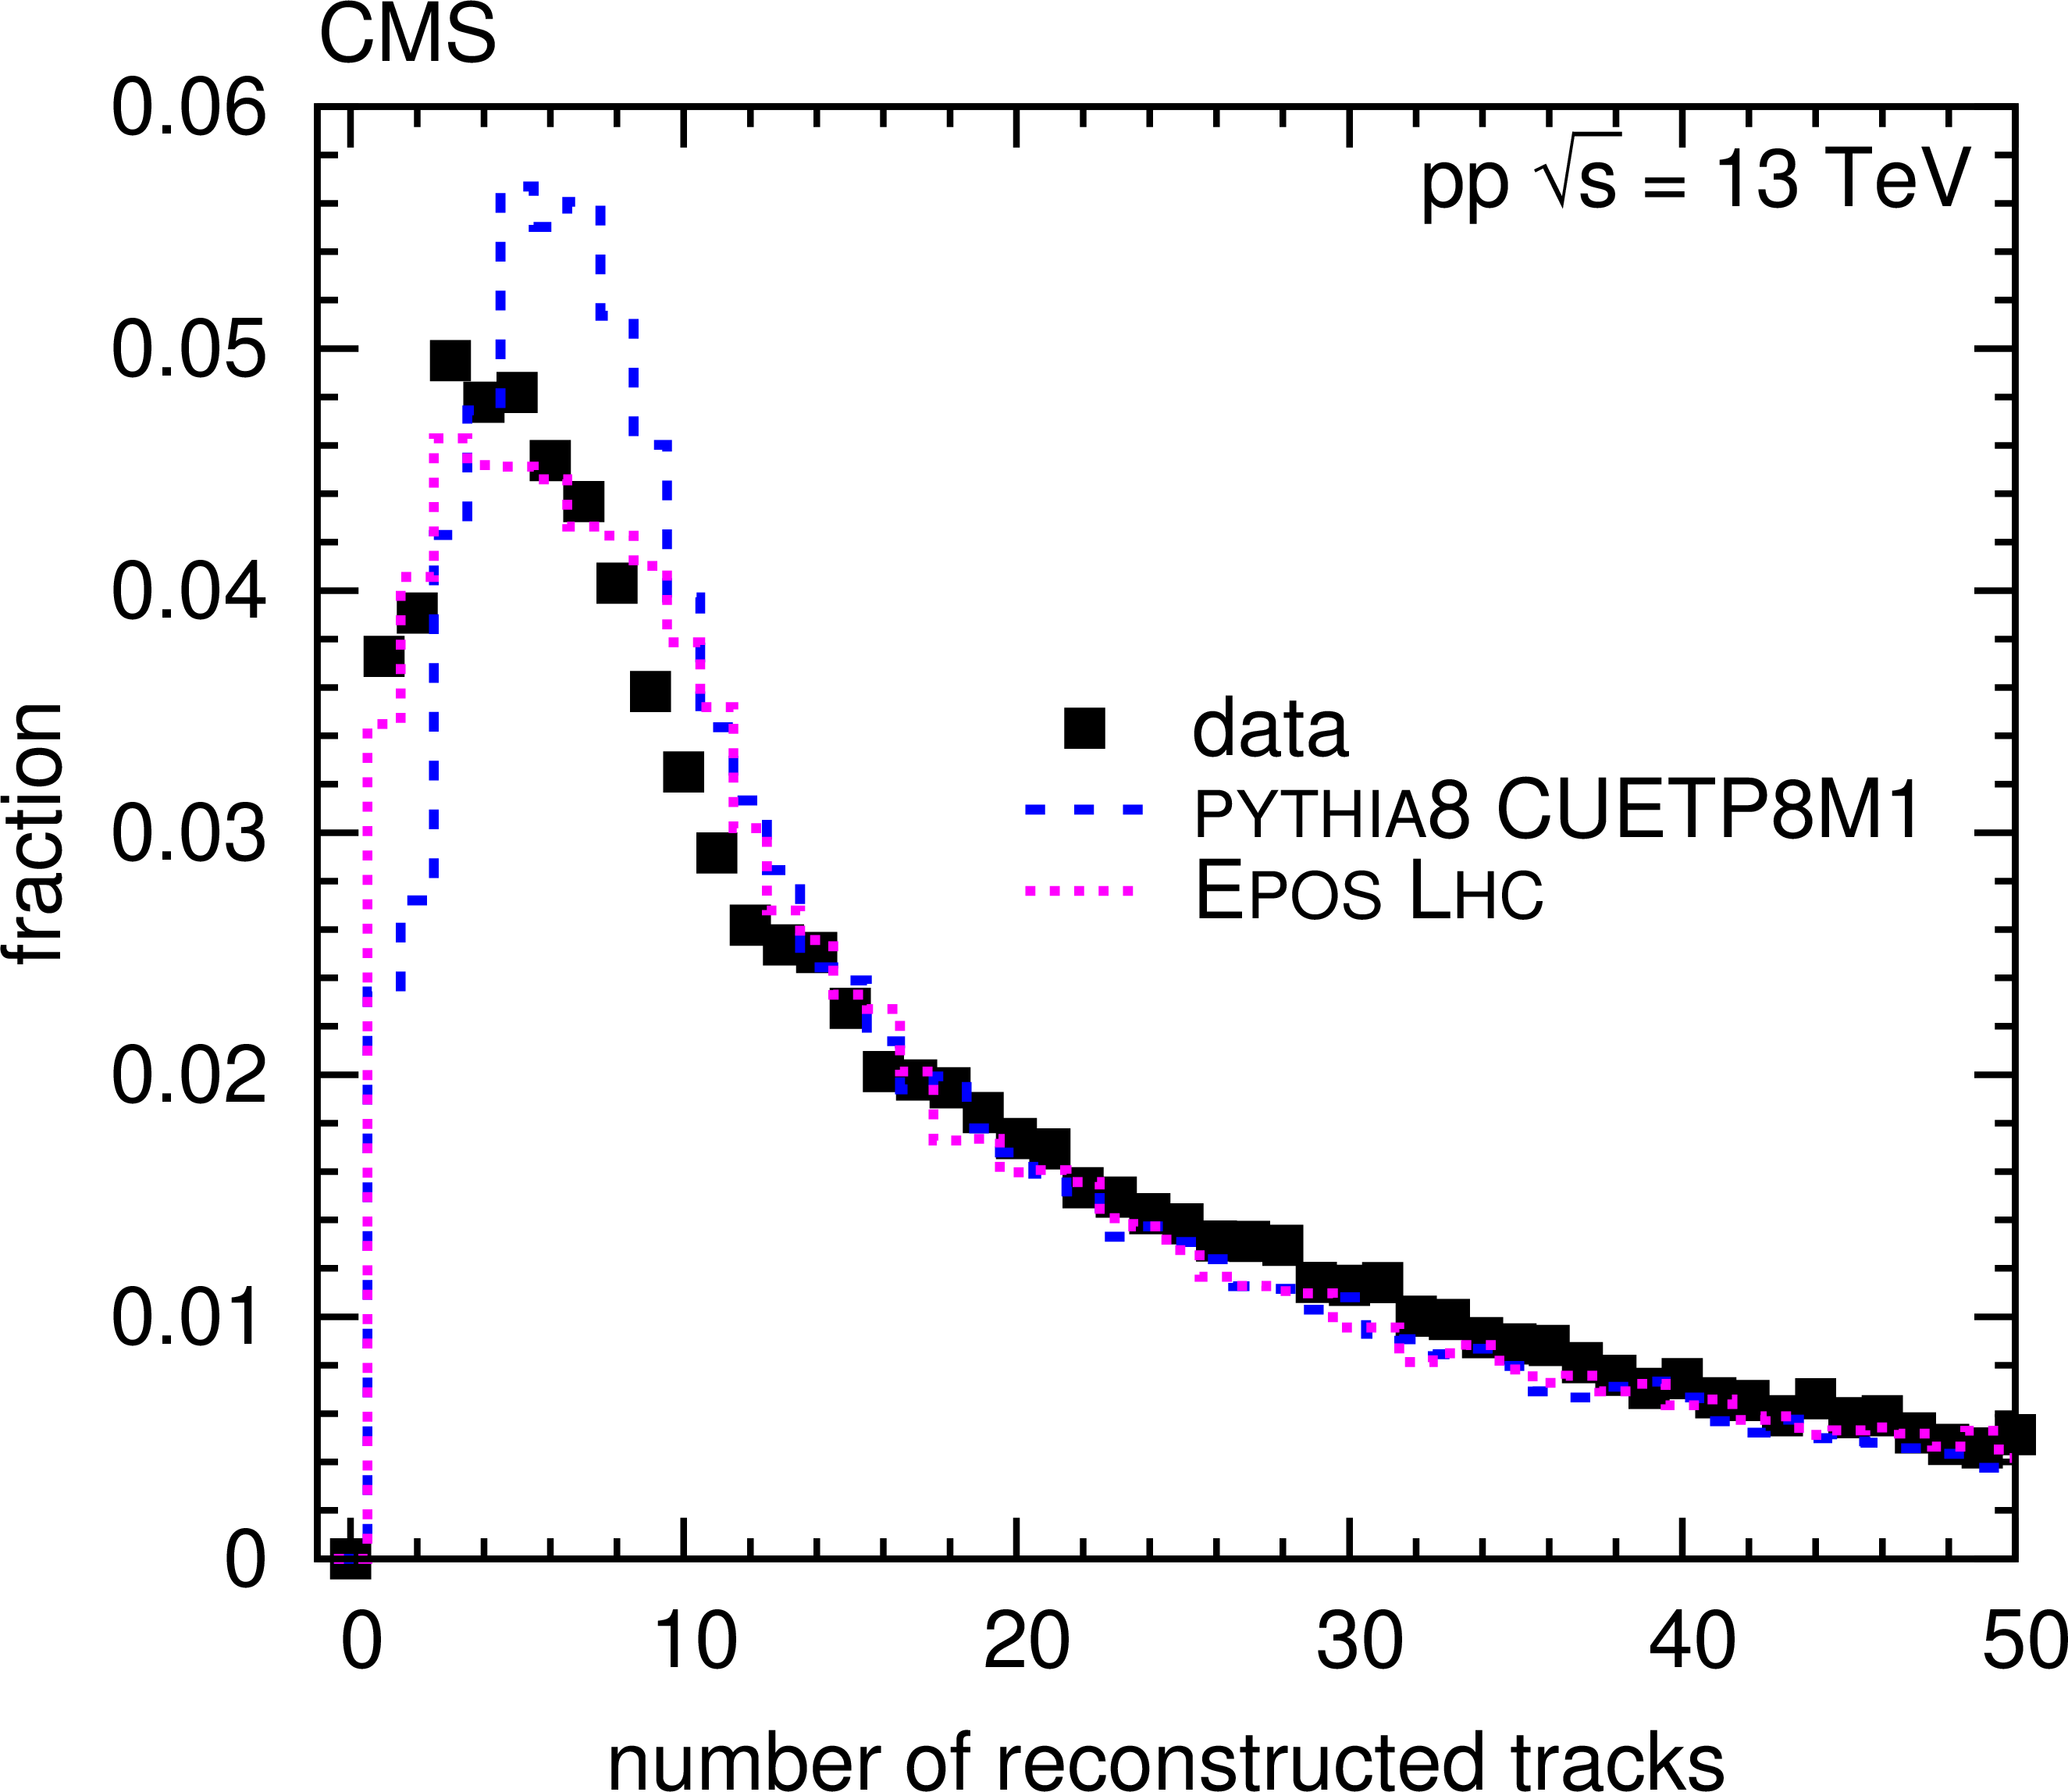
Figure 2-a:
(a) Distributions of the number of reconstructed tracks per event from data and from simulations, for inelastic pp collisions. (b) Distributions of the pseudorapidity density ($ { {\mathrm {d}}{}N_{\mathrm {ch}}/ {\mathrm {d}}\eta } $) of charged hadrons in the region $ {| \eta | } < 2$ for inelastic collision events, reconstructed using tracklets (open circles), and tracks (open squares), compared to PYTHIA8 CUETP8M1 and EPOS LHC predictions, shown as dashed and dotted curves, respectively. The solid and long-dashed lines encompassing the data points indicate the systematic uncertainties of the two reconstruction methods. |
png pdf |
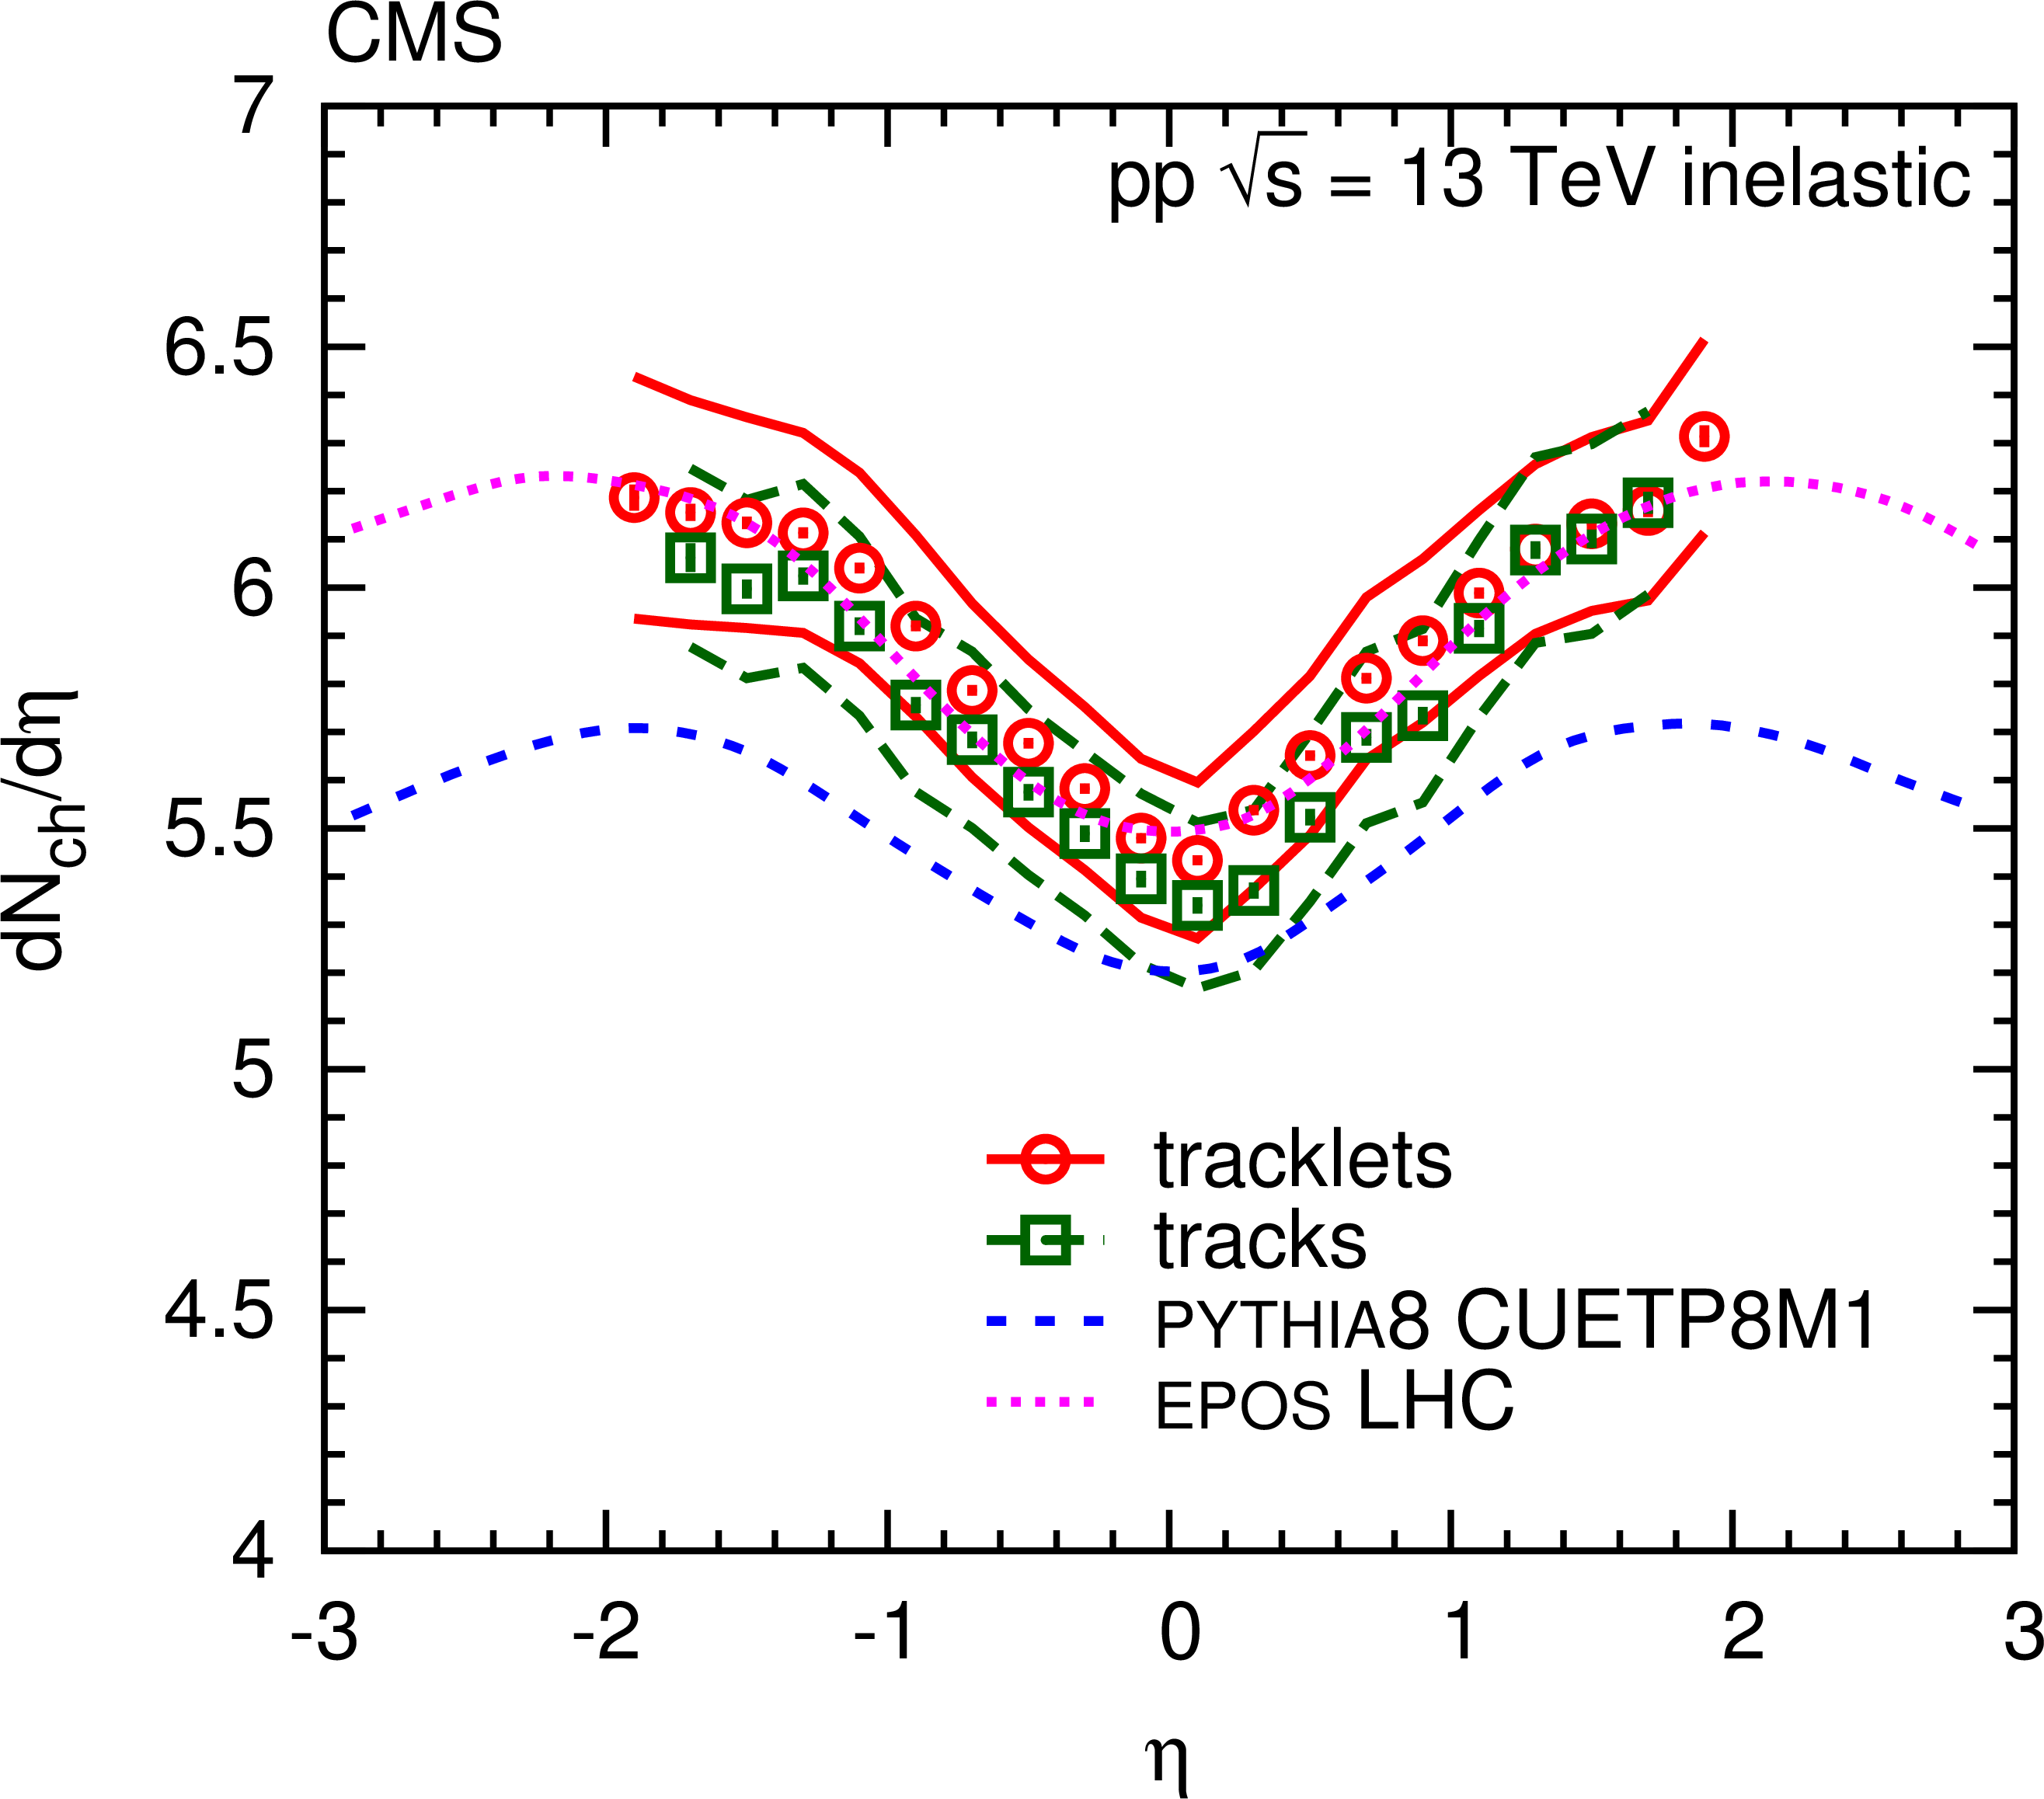
Figure 2-b:
(a) Distributions of the number of reconstructed tracks per event from data and from simulations, for inelastic pp collisions. (b) Distributions of the pseudorapidity density ($ { {\mathrm {d}}{}N_{\mathrm {ch}}/ {\mathrm {d}}\eta } $) of charged hadrons in the region $ {| \eta | } < 2$ for inelastic collision events, reconstructed using tracklets (open circles), and tracks (open squares), compared to PYTHIA8 CUETP8M1 and EPOS LHC predictions, shown as dashed and dotted curves, respectively. The solid and long-dashed lines encompassing the data points indicate the systematic uncertainties of the two reconstruction methods. |
png pdf |
Figure 3-a:
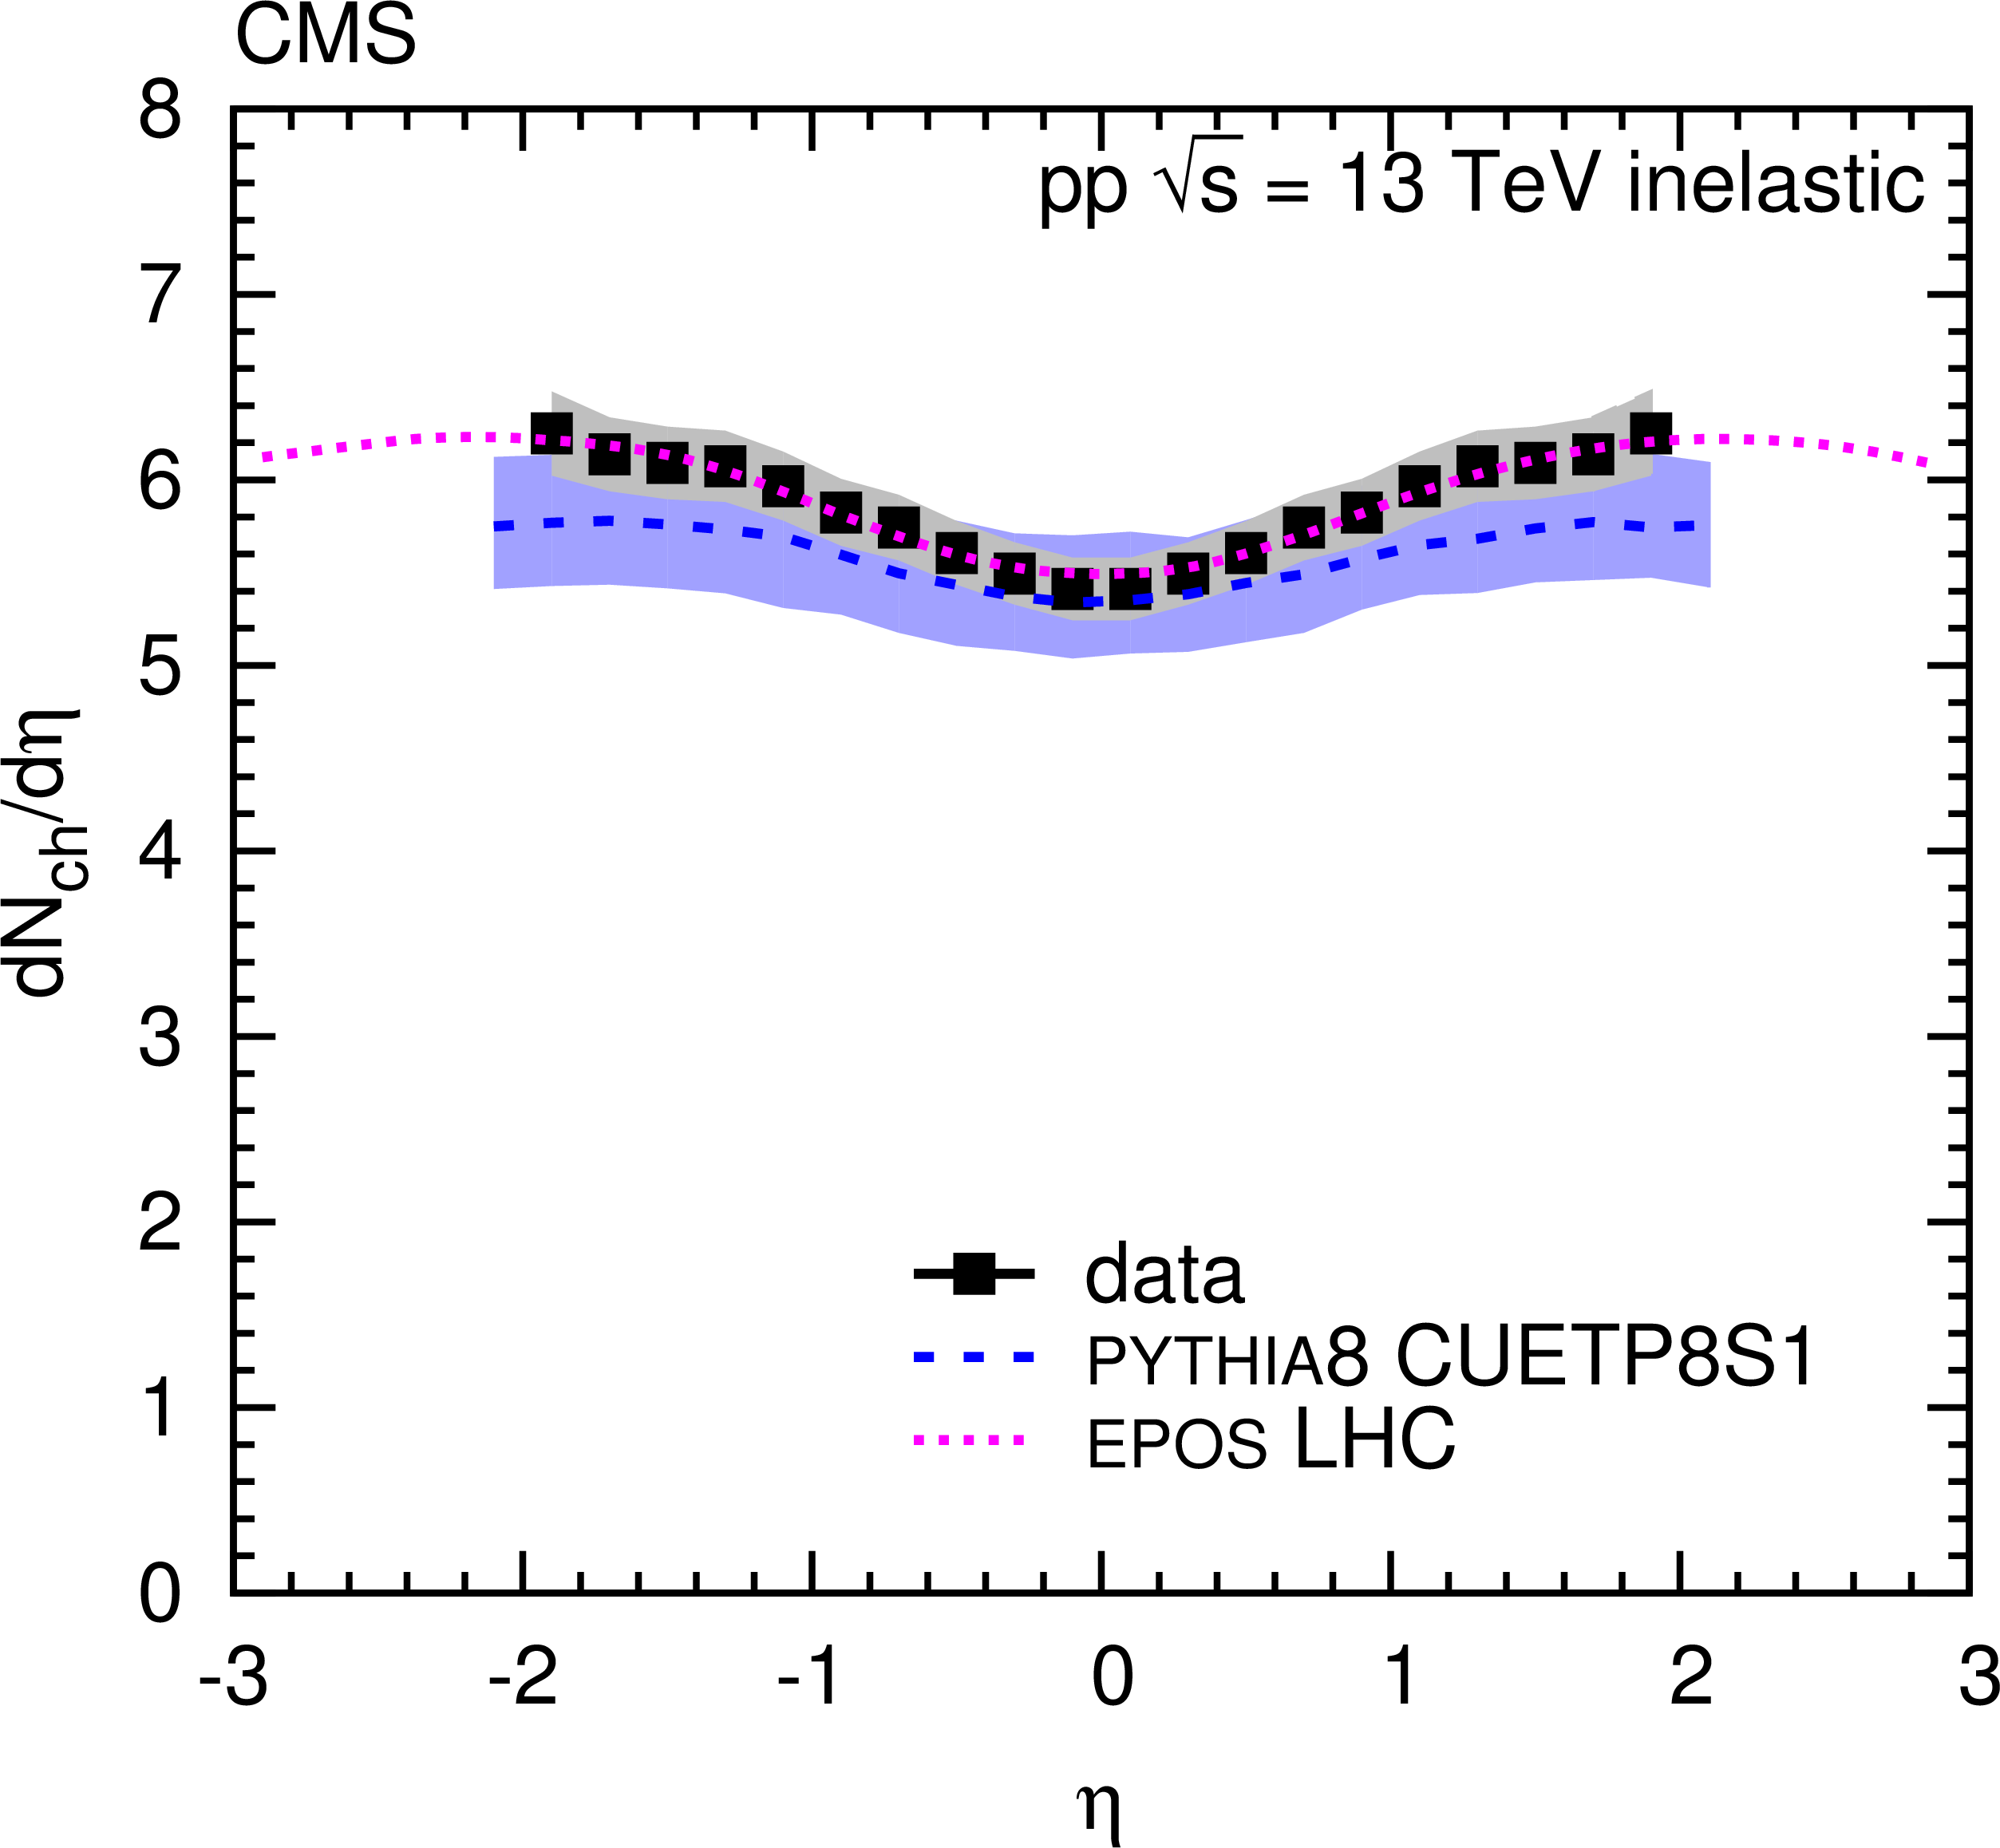
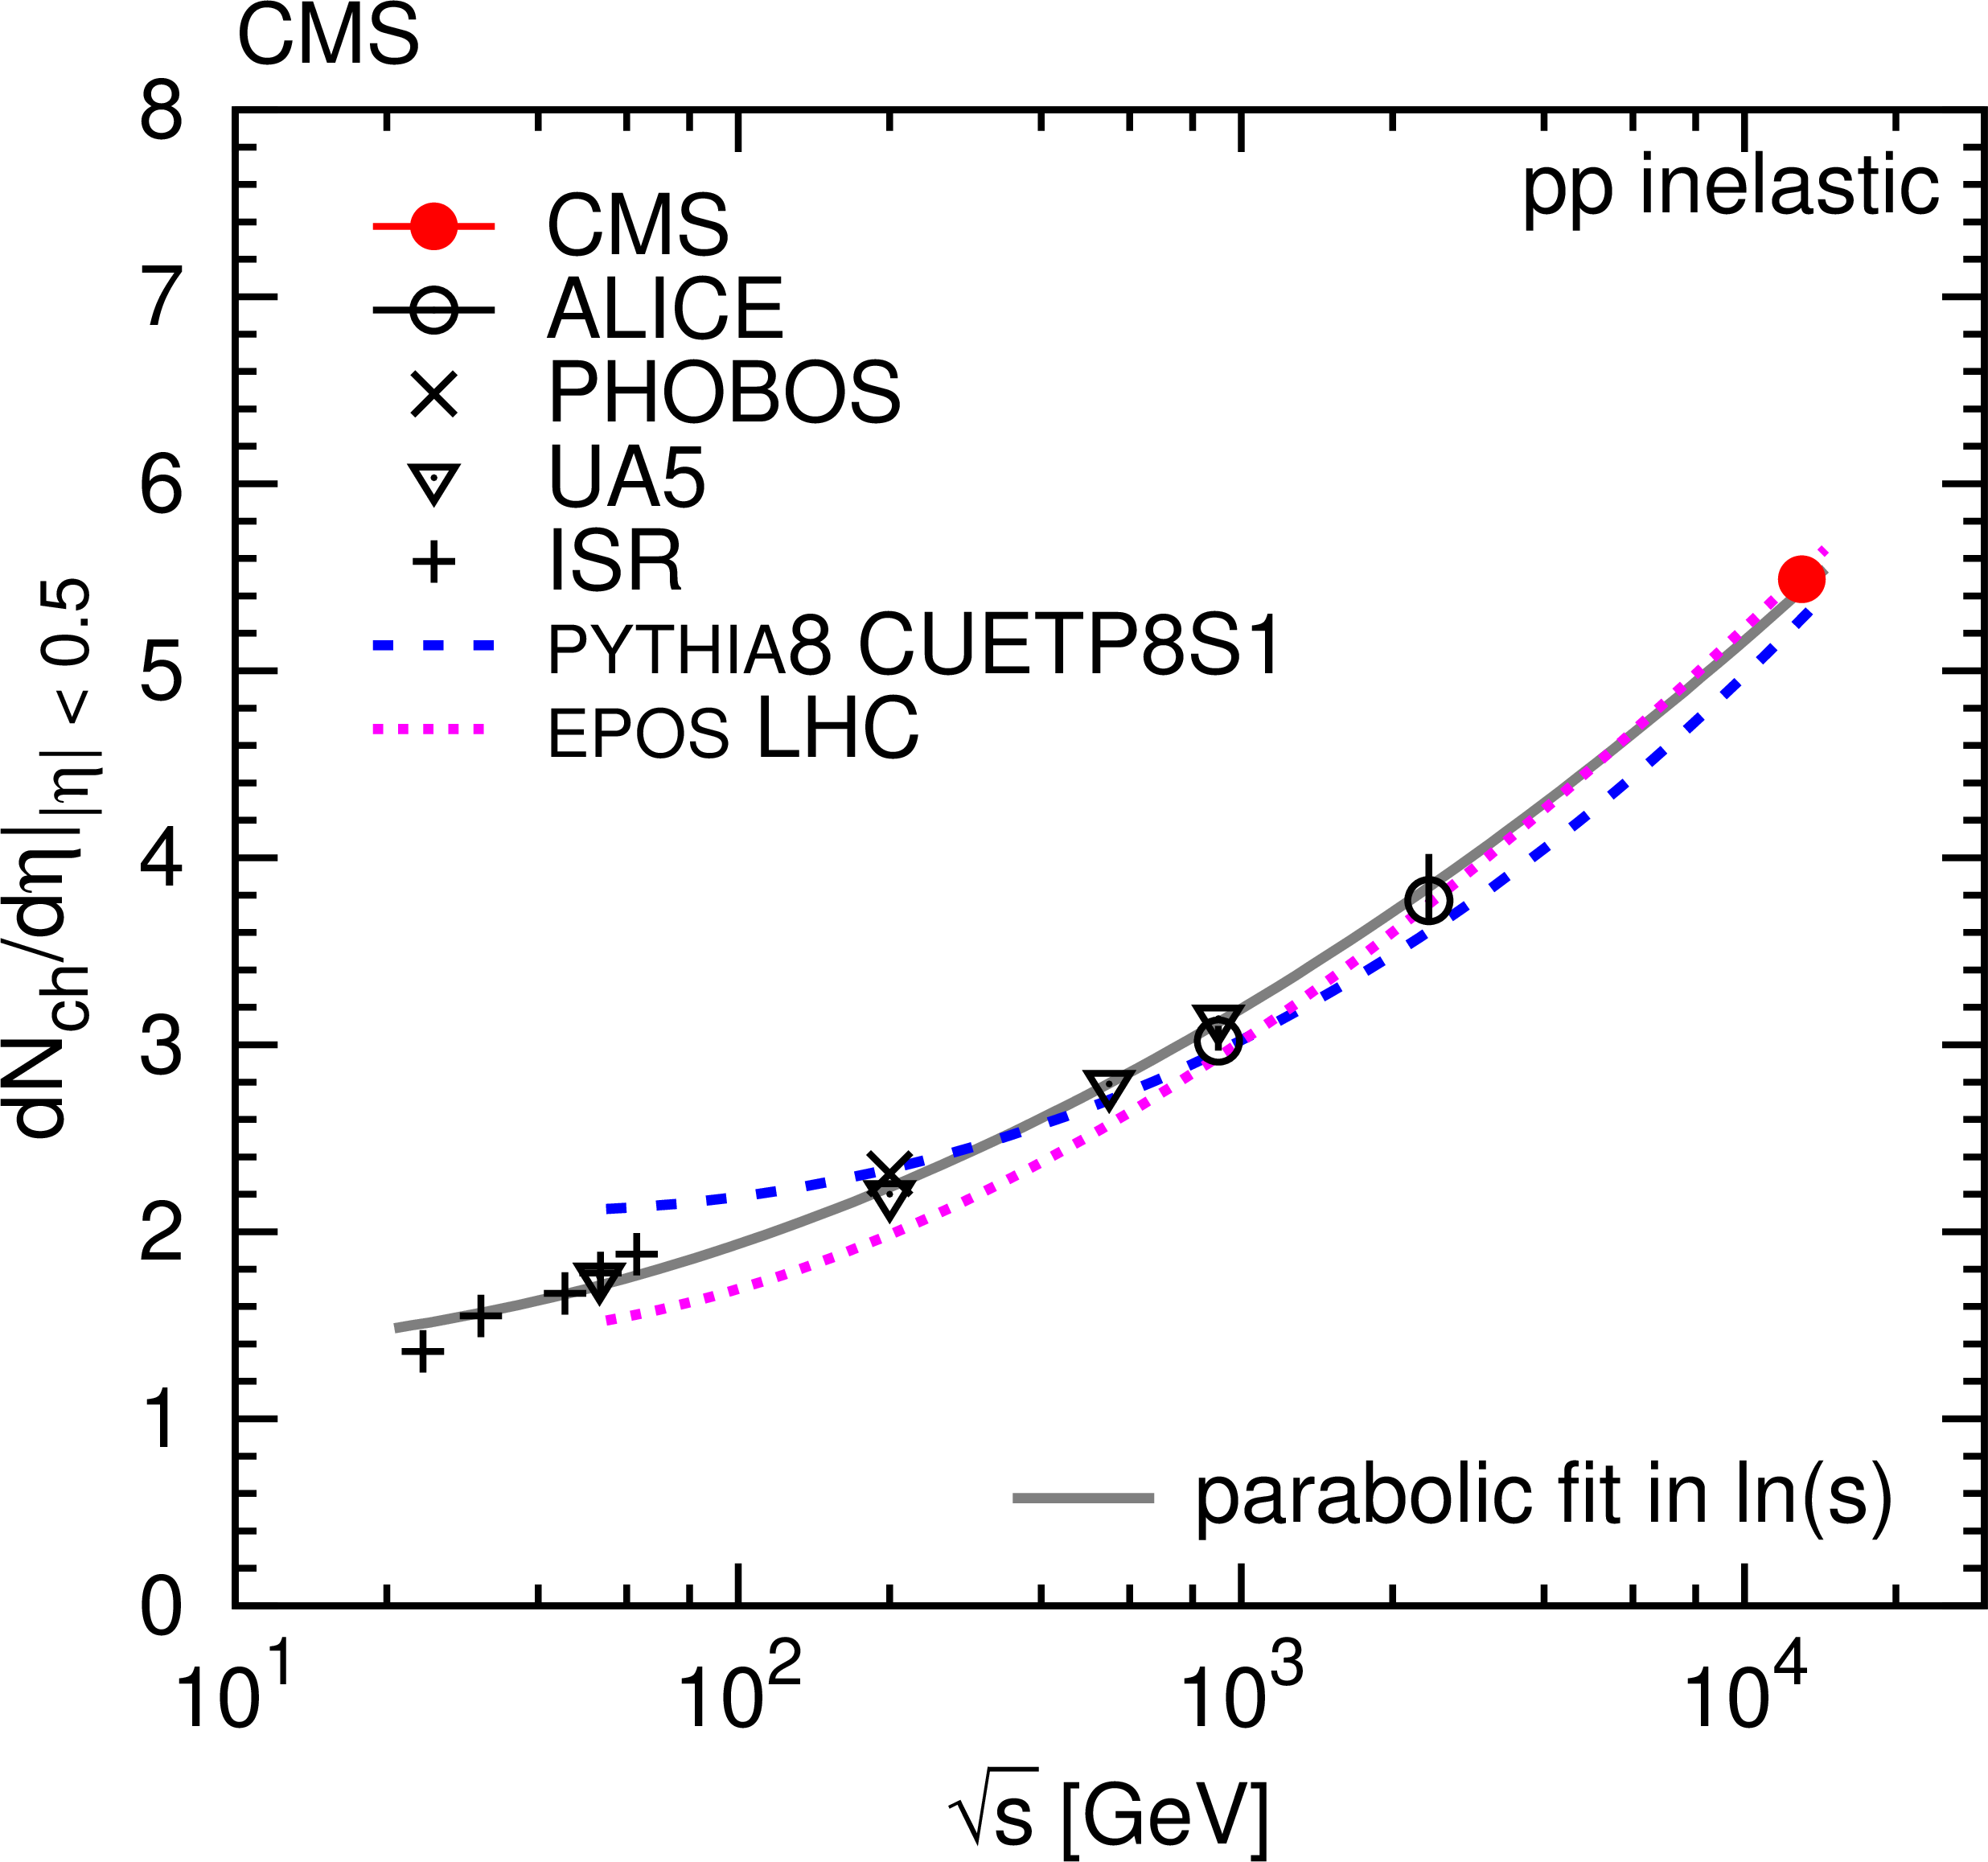
(a) Distributions of the pseudorapidity density of charged hadrons in the region $ {| \eta | } < 2$ in inelastic pp collisions at 13 TeV measured in data (solid markers, combined track and tracklet results, symmetrized in $\eta $), and predicted by the PYTIA8 CUETP8S1 and the EPOS LHC event generators (curves). The grey shaded area encompassing the data points indicates their correlated systematic uncertainties. The blue band corresponds to the envelope of the CUETP8S1 tune parametric uncertainties. (b) Center-of-mass energy dependence of $ { {\mathrm {d}}{}N_{\mathrm {ch}}/ {\mathrm {d}}\eta } |_{ {| \eta | } < 0.5}$ including ISR [Rossi:1974,Thome:1977], UA5 [Alner:1986,Alner:1987], PHOBOS [Back:2003], and ALICE [Aamodt:2010] data. The solid curve shows a second-order polynomial in $\ln(s)$ fit to the data points, including the new result at $\sqrt {s} = 13 TeV $. The dashed and dotted curves show the PYTHA8 CUETP8S1 and EPOS LHC predictions, respectively. |
png pdf |
Figure 3-b:
(a) Distributions of the pseudorapidity density of charged hadrons in the region $ {| \eta | } < 2$ in inelastic pp collisions at 13 TeV measured in data (solid markers, combined track and tracklet results, symmetrized in $\eta $), and predicted by the PYTIA8 CUETP8S1 and the EPOS LHC event generators (curves). The grey shaded area encompassing the data points indicates their correlated systematic uncertainties. The blue band corresponds to the envelope of the CUETP8S1 tune parametric uncertainties. (b) Center-of-mass energy dependence of $ { {\mathrm {d}}{}N_{\mathrm {ch}}/ {\mathrm {d}}\eta } |_{ {| \eta | } < 0.5}$ including ISR [Rossi:1974,Thome:1977], UA5 [Alner:1986,Alner:1987], PHOBOS [Back:2003], and ALICE [Aamodt:2010] data. The solid curve shows a second-order polynomial in $\ln(s)$ fit to the data points, including the new result at $\sqrt {s} = 13 TeV $. The dashed and dotted curves show the PYTHA8 CUETP8S1 and EPOS LHC predictions, respectively. |
| Summary |
| The pseudorapidity distribution of charged hadrons has been measured by the CMS experiment, operated at zero magnetic field, at the LHC in proton-proton collisions at $\sqrt{s} =$ 13 TeV. Using two methods, based on hit pairs and straight-line tracks in the barrel region of the CMS pixel detector, a charged hadron multiplicity at midrapidity, $ \mathrm{d} N_{\mathrm{ch}} / \mathrm{d}\eta |_{ | \eta | <0.5} =$ 5.49 $\pm$ 0.01 (stat) $\pm$ 0.17 (syst), has been obtained for inelastic pp events. In the central region, the measured $ \mathrm{d} N_{\mathrm{ch}} / \mathrm{d}\eta$ distribution is consistent with predictions of the PYTHIA8 (with the CMS underlying event tunes CUETP8S1 and CUETP8M1) and EPOS LHC (LHC tune) event generators, while those in a wider $\eta$ range are better described by the latter. These results constitute the first CMS measurement of hadron production at the new center-of-mass energy frontier, and provide new constraints for the improvement of perturbative and nonperturbative QCD aspects implemented in hadronic event generators. |
|
|
Compact Muon Solenoid LHC, CERN |
|

|

|

|

|

|