

Compact Muon Solenoid
LHC, CERN
| CMS-HIG-12-028 ; CERN-PH-EP-2012-220 | ||
| Observation of a new boson at a mass of 125 GeV with the CMS experiment at the LHC | ||
| CMS Collaboration | ||
| 31 July 2012 | ||
| Phys. Lett. B 716 (2012) 30 | ||
| Abstract: Results are presented from searches for the standard model Higgs boson in proton-proton collisions at $\sqrt{s}= $ 7 and 8 TeV in the Compact Muon Solenoid experiment at the LHC, using data samples corresponding to integrated luminosities of up to 5.1 fb$^{-1}$ at 7 TeV and 5.3 fb$^{-1}$ at 8 TeV. The search is performed in five decay modes: $ \gamma \gamma$, $\mathrm{Z}\mathrm{Z}$, $\mathrm{ W }^+\mathrm{ W }^-$, $ \tau^+ \tau^-$, and $\mathrm{ b \bar{b} }$. An excess of events is observed above the expected background, with a local significance of 5.0 standard deviations, at a mass near 125 GeV, signalling the production of a new particle. The expected significance for a standard model Higgs boson of that mass is 5.8 standard deviations. The excess is most significant in the two decay modes with the best mass resolution, $ \gamma \gamma$ and $\mathrm{Z}\mathrm{Z}$; a fit to these signals gives a mass of 125.3 $\pm$ 0.4 (stat.) $\pm$ 0.5 (syst.) GeV. The decay to two photons indicates that the new particle is a boson with spin different from one. | ||
| Links: e-print arXiv:1207.7235 [hep-ex] (PDF) ; CDS record ; inSPIRE record ; Public twiki page ; CADI line (restricted) ; | ||
| Figures | |
png pdf |
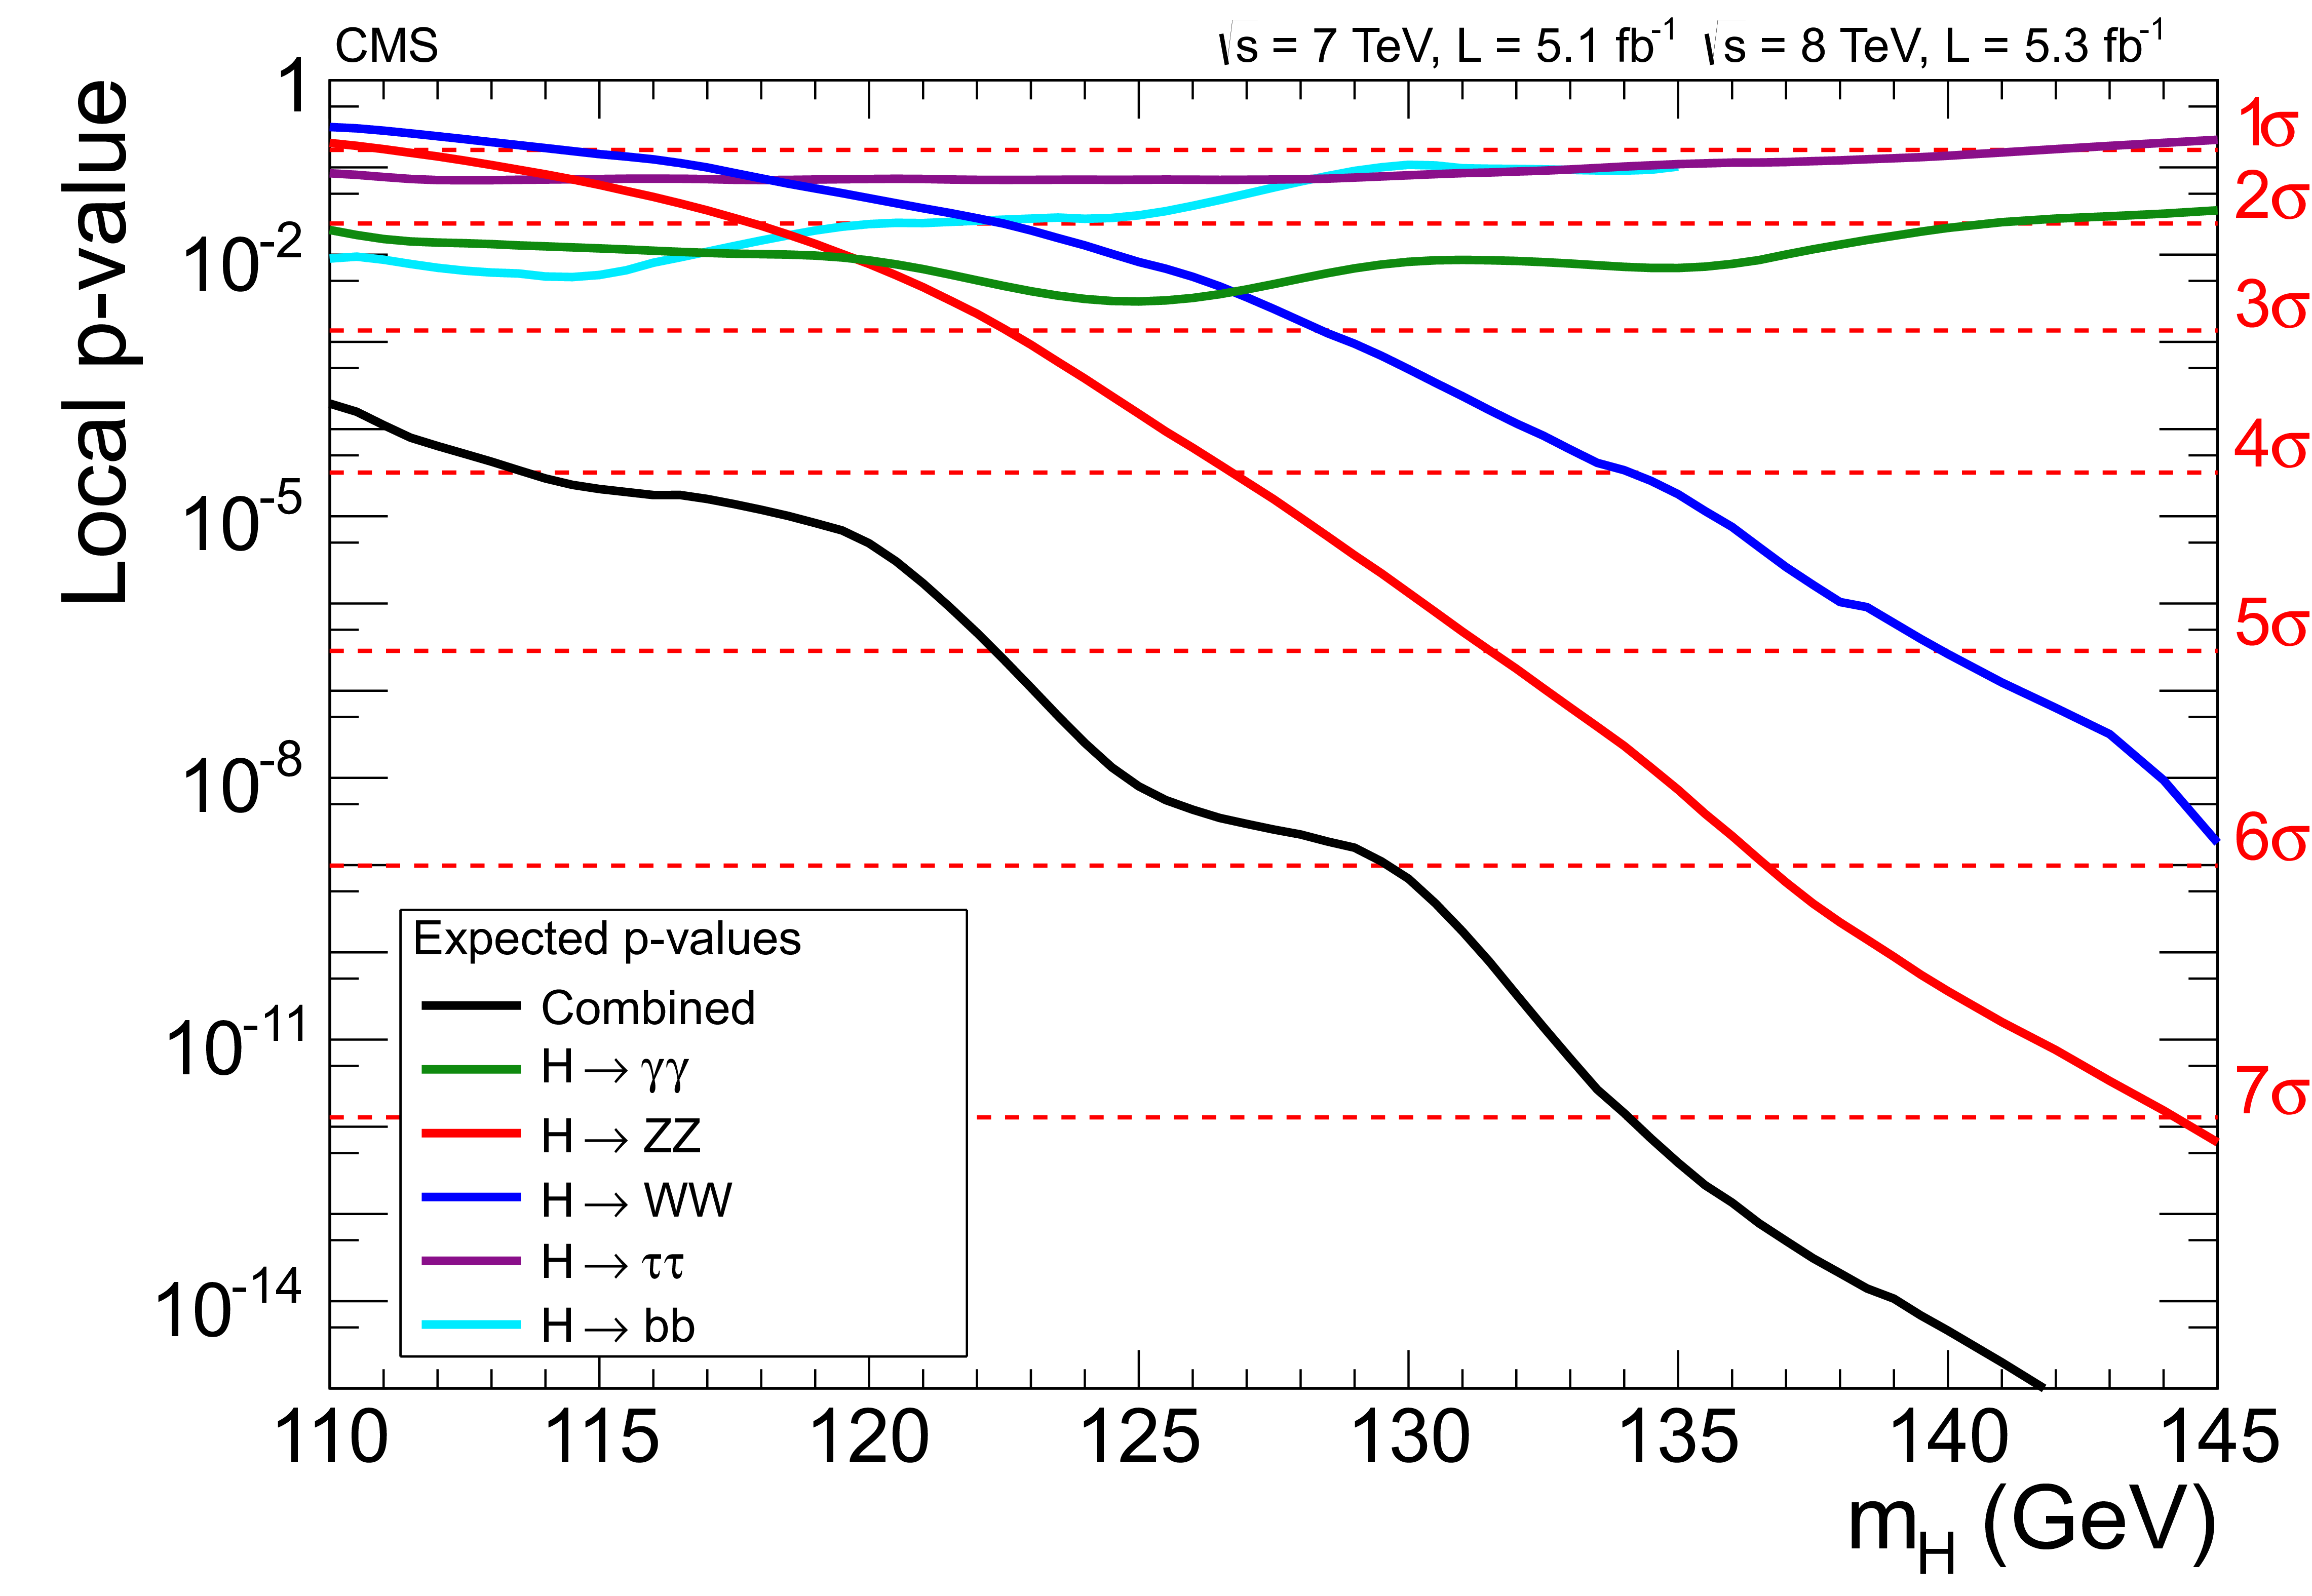
Figure 1:
Expected local $p$-values for a SM Higgs boson as a function of $ {m_{\mathrm{ H } }}$, for the decay modes $\gamma \gamma $, $\mathrm{ Z } \mathrm{ Z } $, $\mathrm{ W } \mathrm{ W } $, $ \tau \tau $, and $\mathrm{ b } \mathrm{ b } $ and their combination. |

png pdf |
Figure 2:
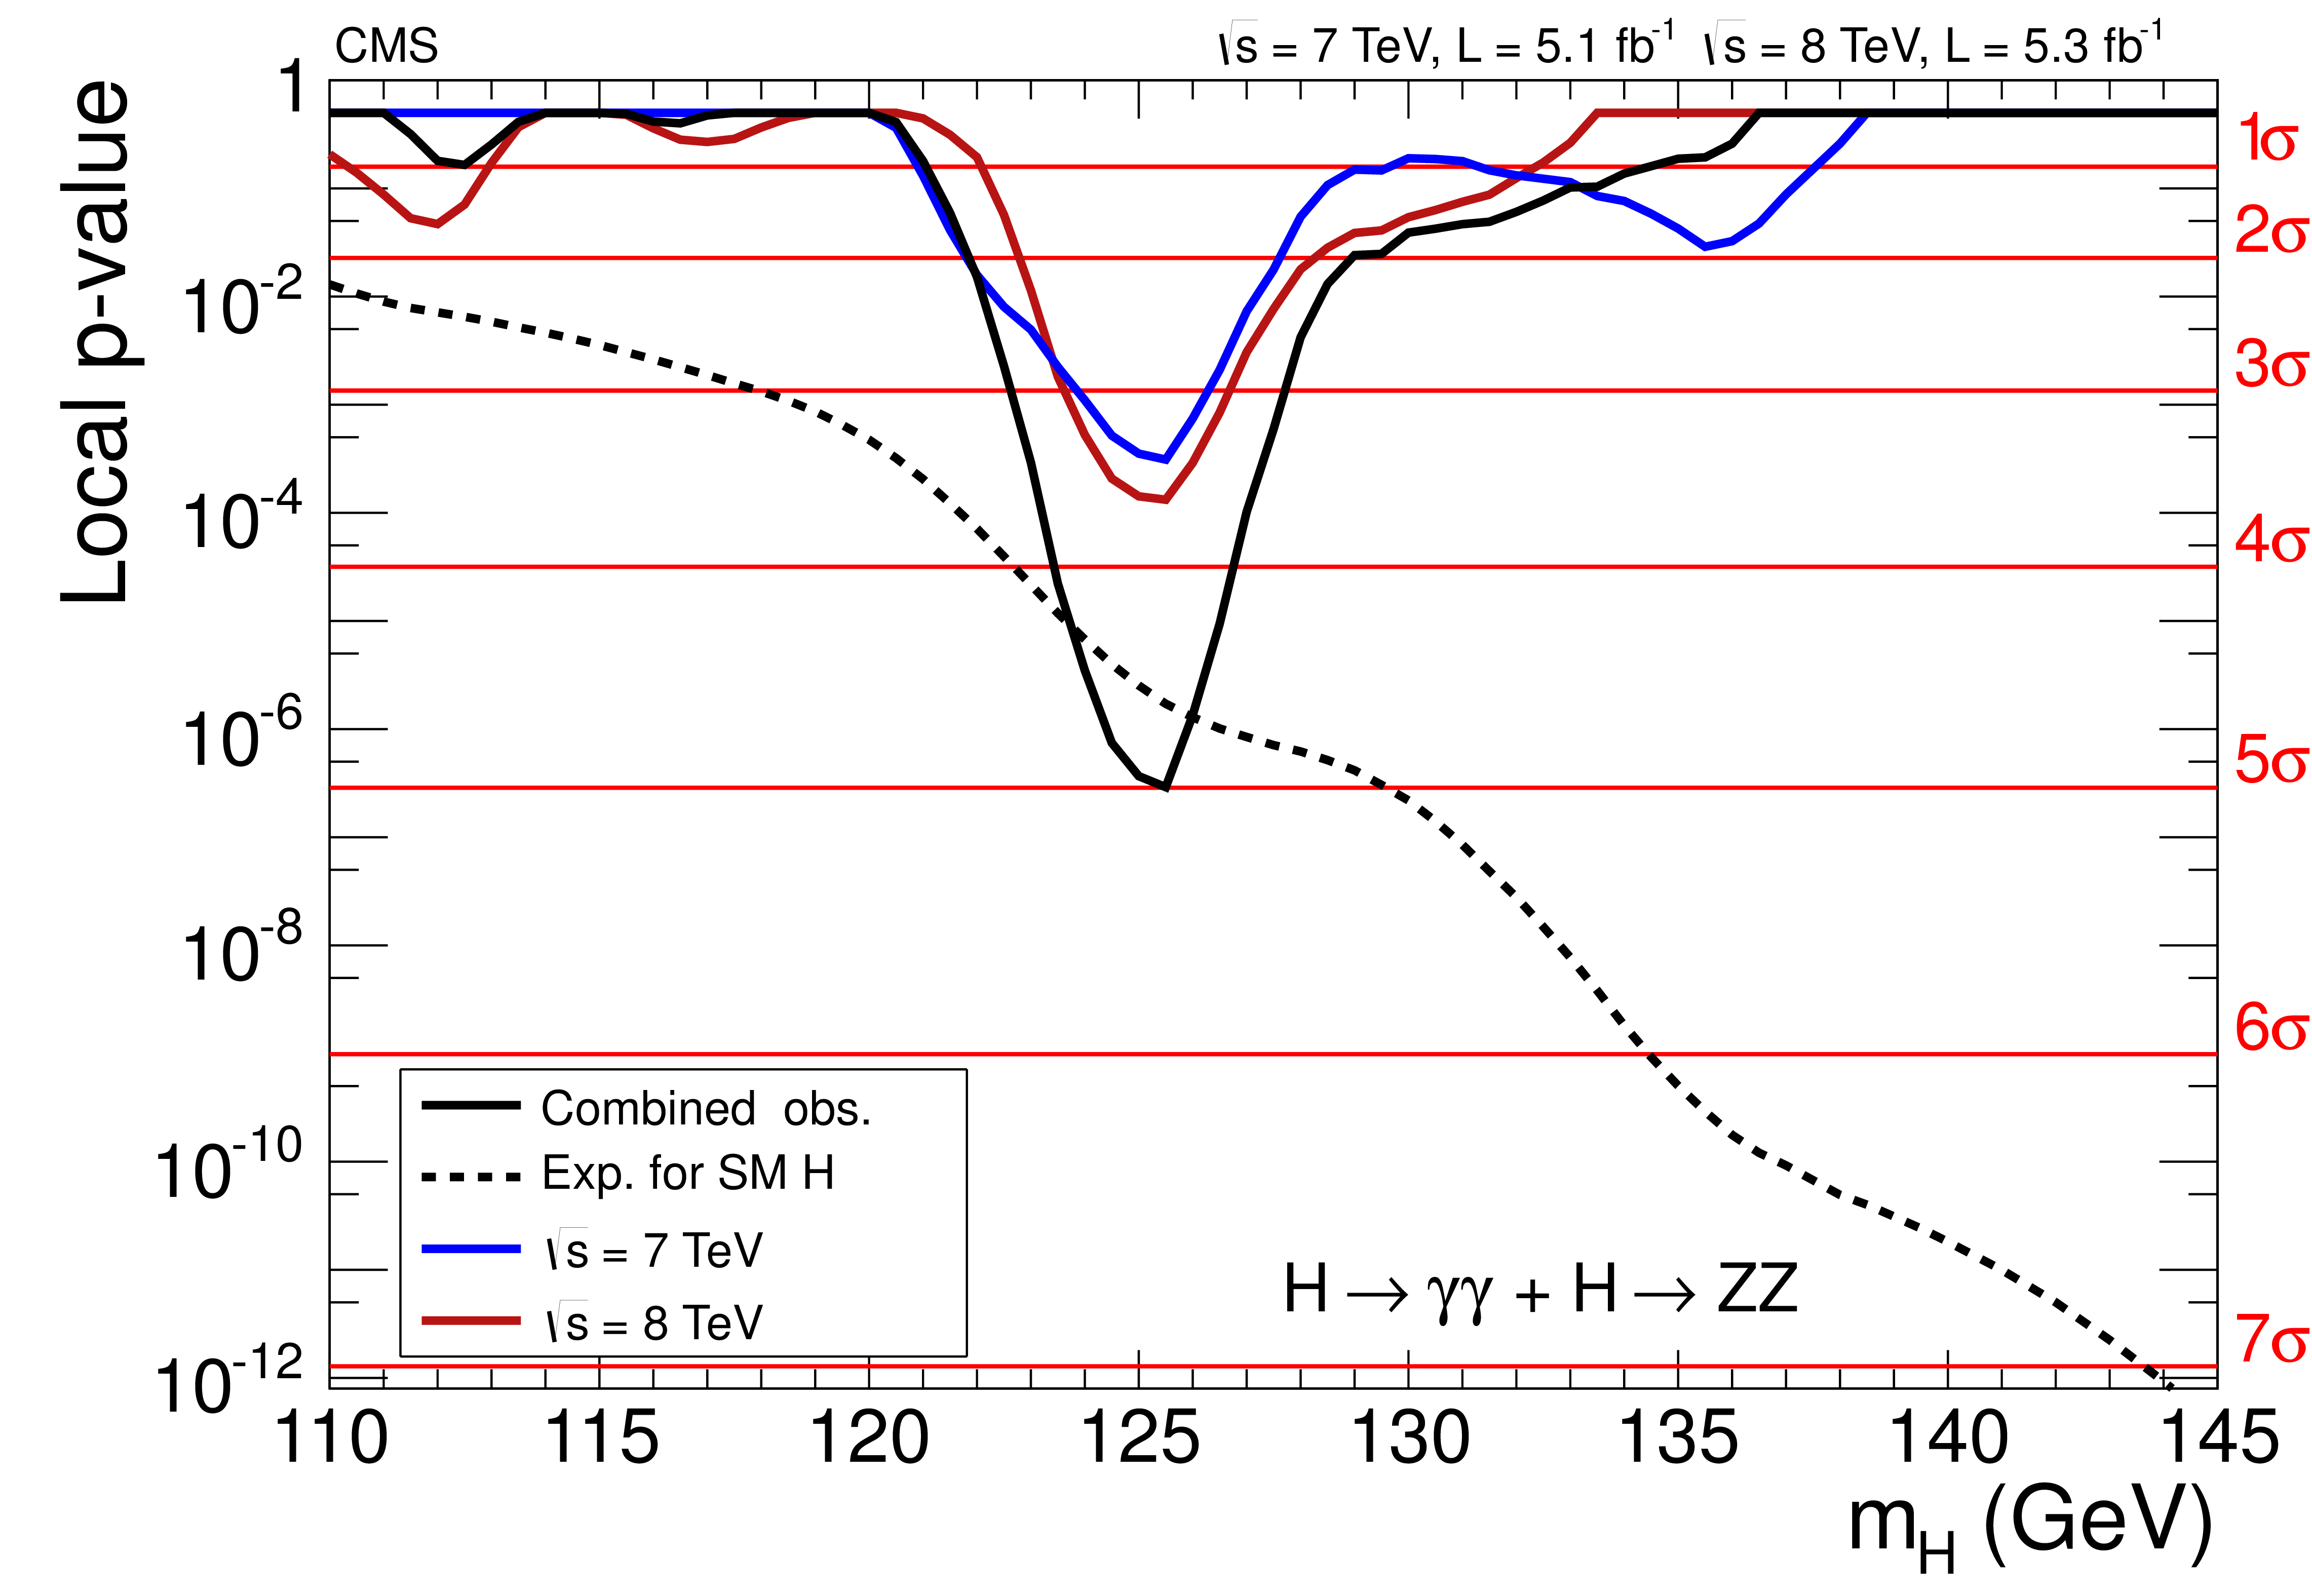
The local $p$-value as a function of $ {m_{\mathrm{ H } }}$ in the $\gamma \gamma $ decay mode for the combined 7and 8 TeV data sets. The additional lines show the values for the two data sets taken individually. The dashed line shows the expected local $p$-value for the combined data sets, should a SM Higgs boson exist with mass $ {m_{\mathrm{ H } }}$. |
png pdf |
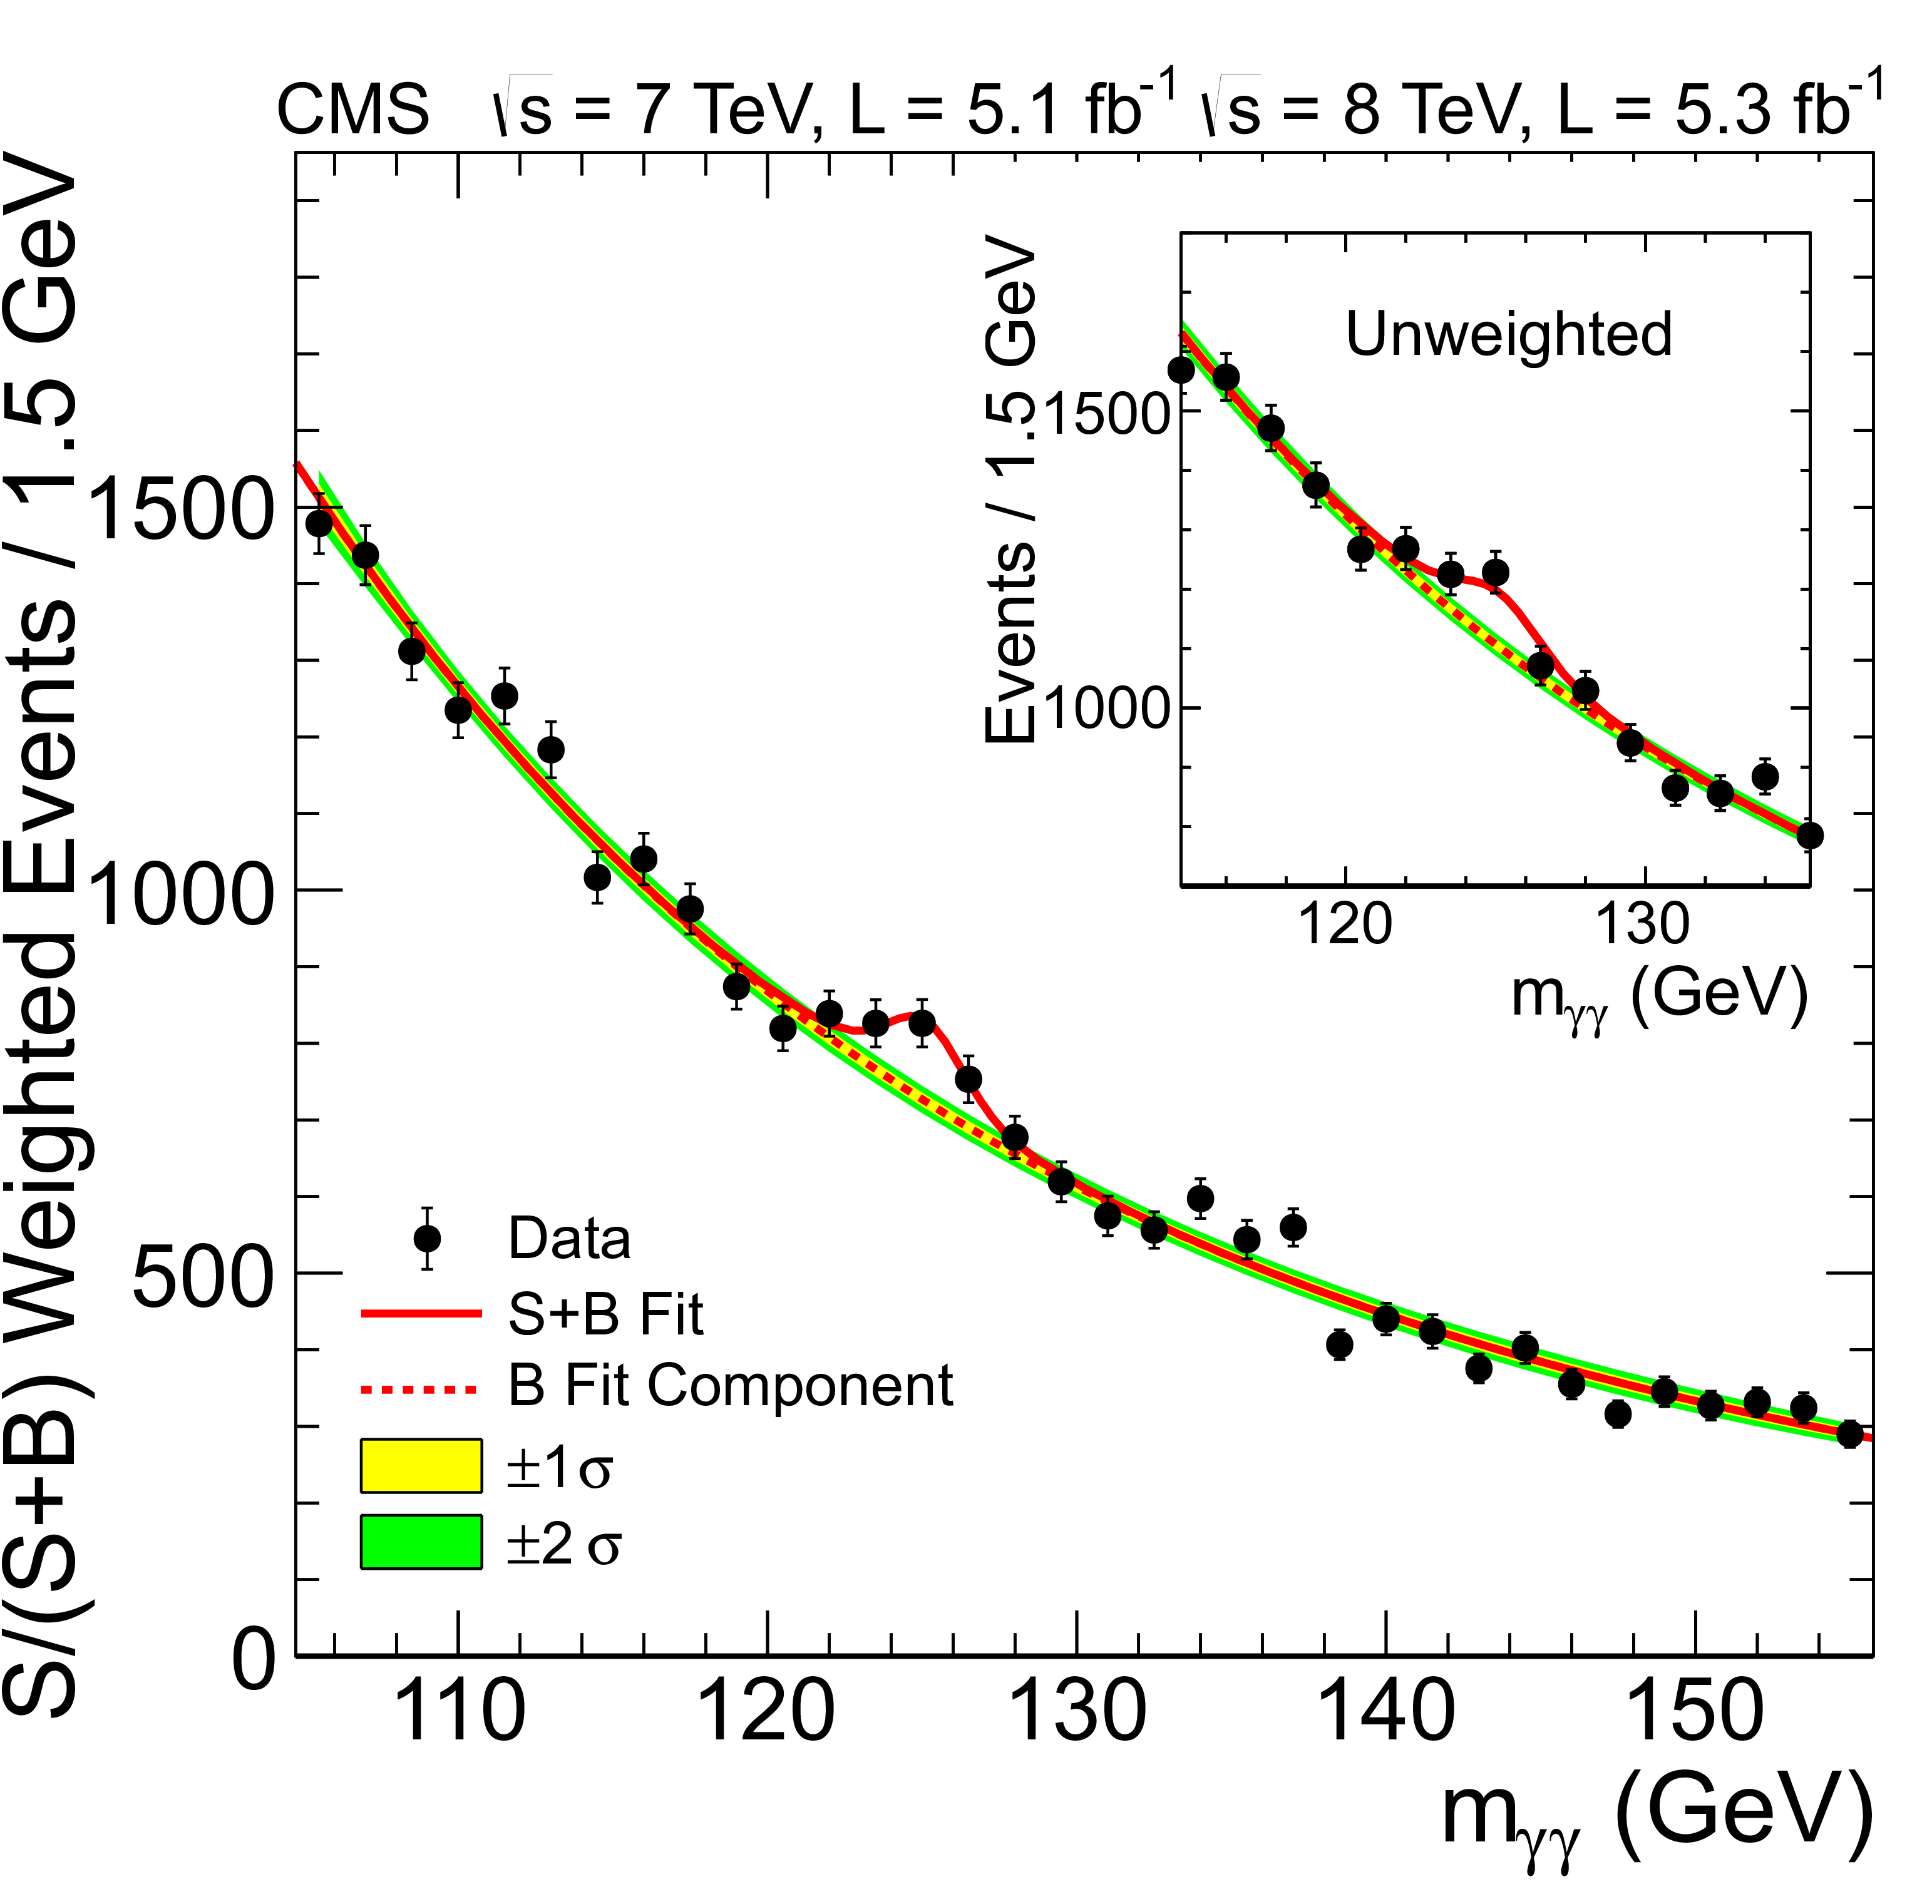
Figure 3:
The diphoton invariant mass distribution with each event weighted by the $S/(S+B)$ value of its category. The lines represent the fitted background and signal, and the coloured bands represent the $\pm $1 and $\pm $2 standard deviation uncertainties in the background estimate. The inset shows the central part of the unweighted invariant mass distribution. |
png pdf |
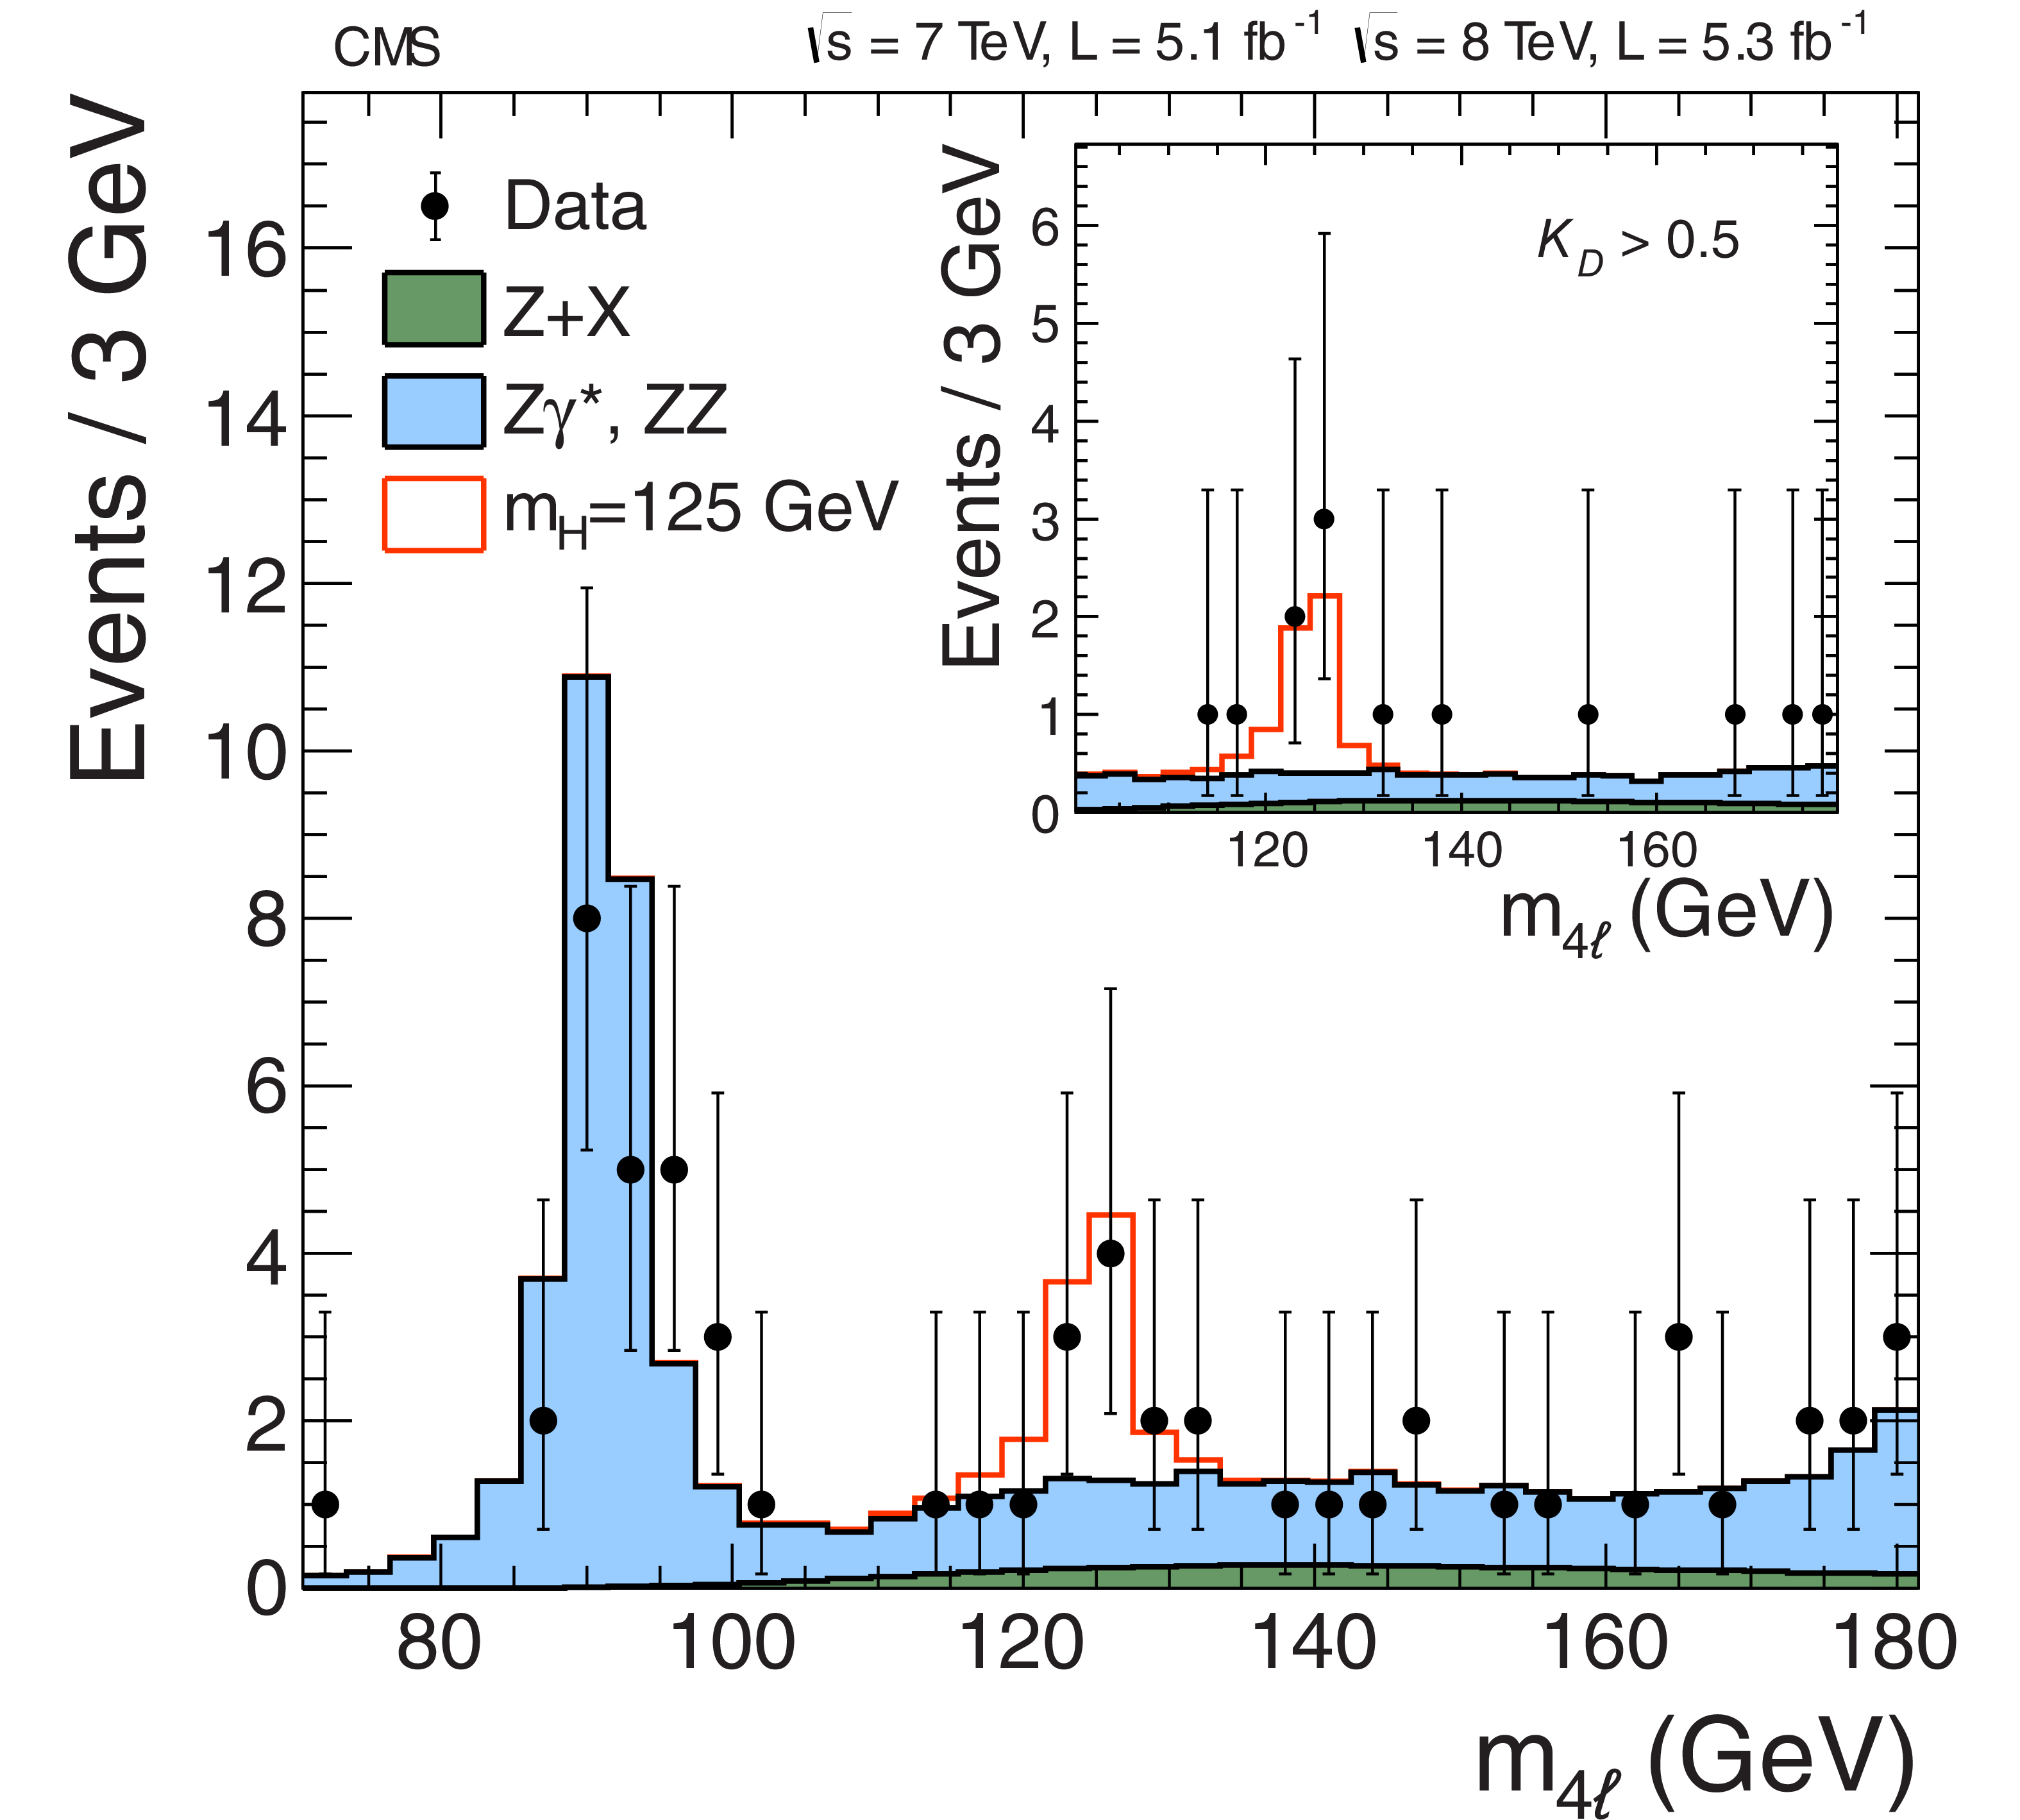
Figure 4:
Distribution of the four-lepton invariant mass for the $\mathrm{ Z } \mathrm{ Z } \to 4\ell $ analysis. The points represent the data, the filled histograms represent the background, and the open histogram shows the signal expectation for a Higgs boson of mass $ {m_{\mathrm{ H } }}= $ 125 GeV , added to the background expectation. The inset shows the $m_{4\ell }$ distribution after selection of events with $K_D > $ 0.5 , as described in the text. |

png pdf |
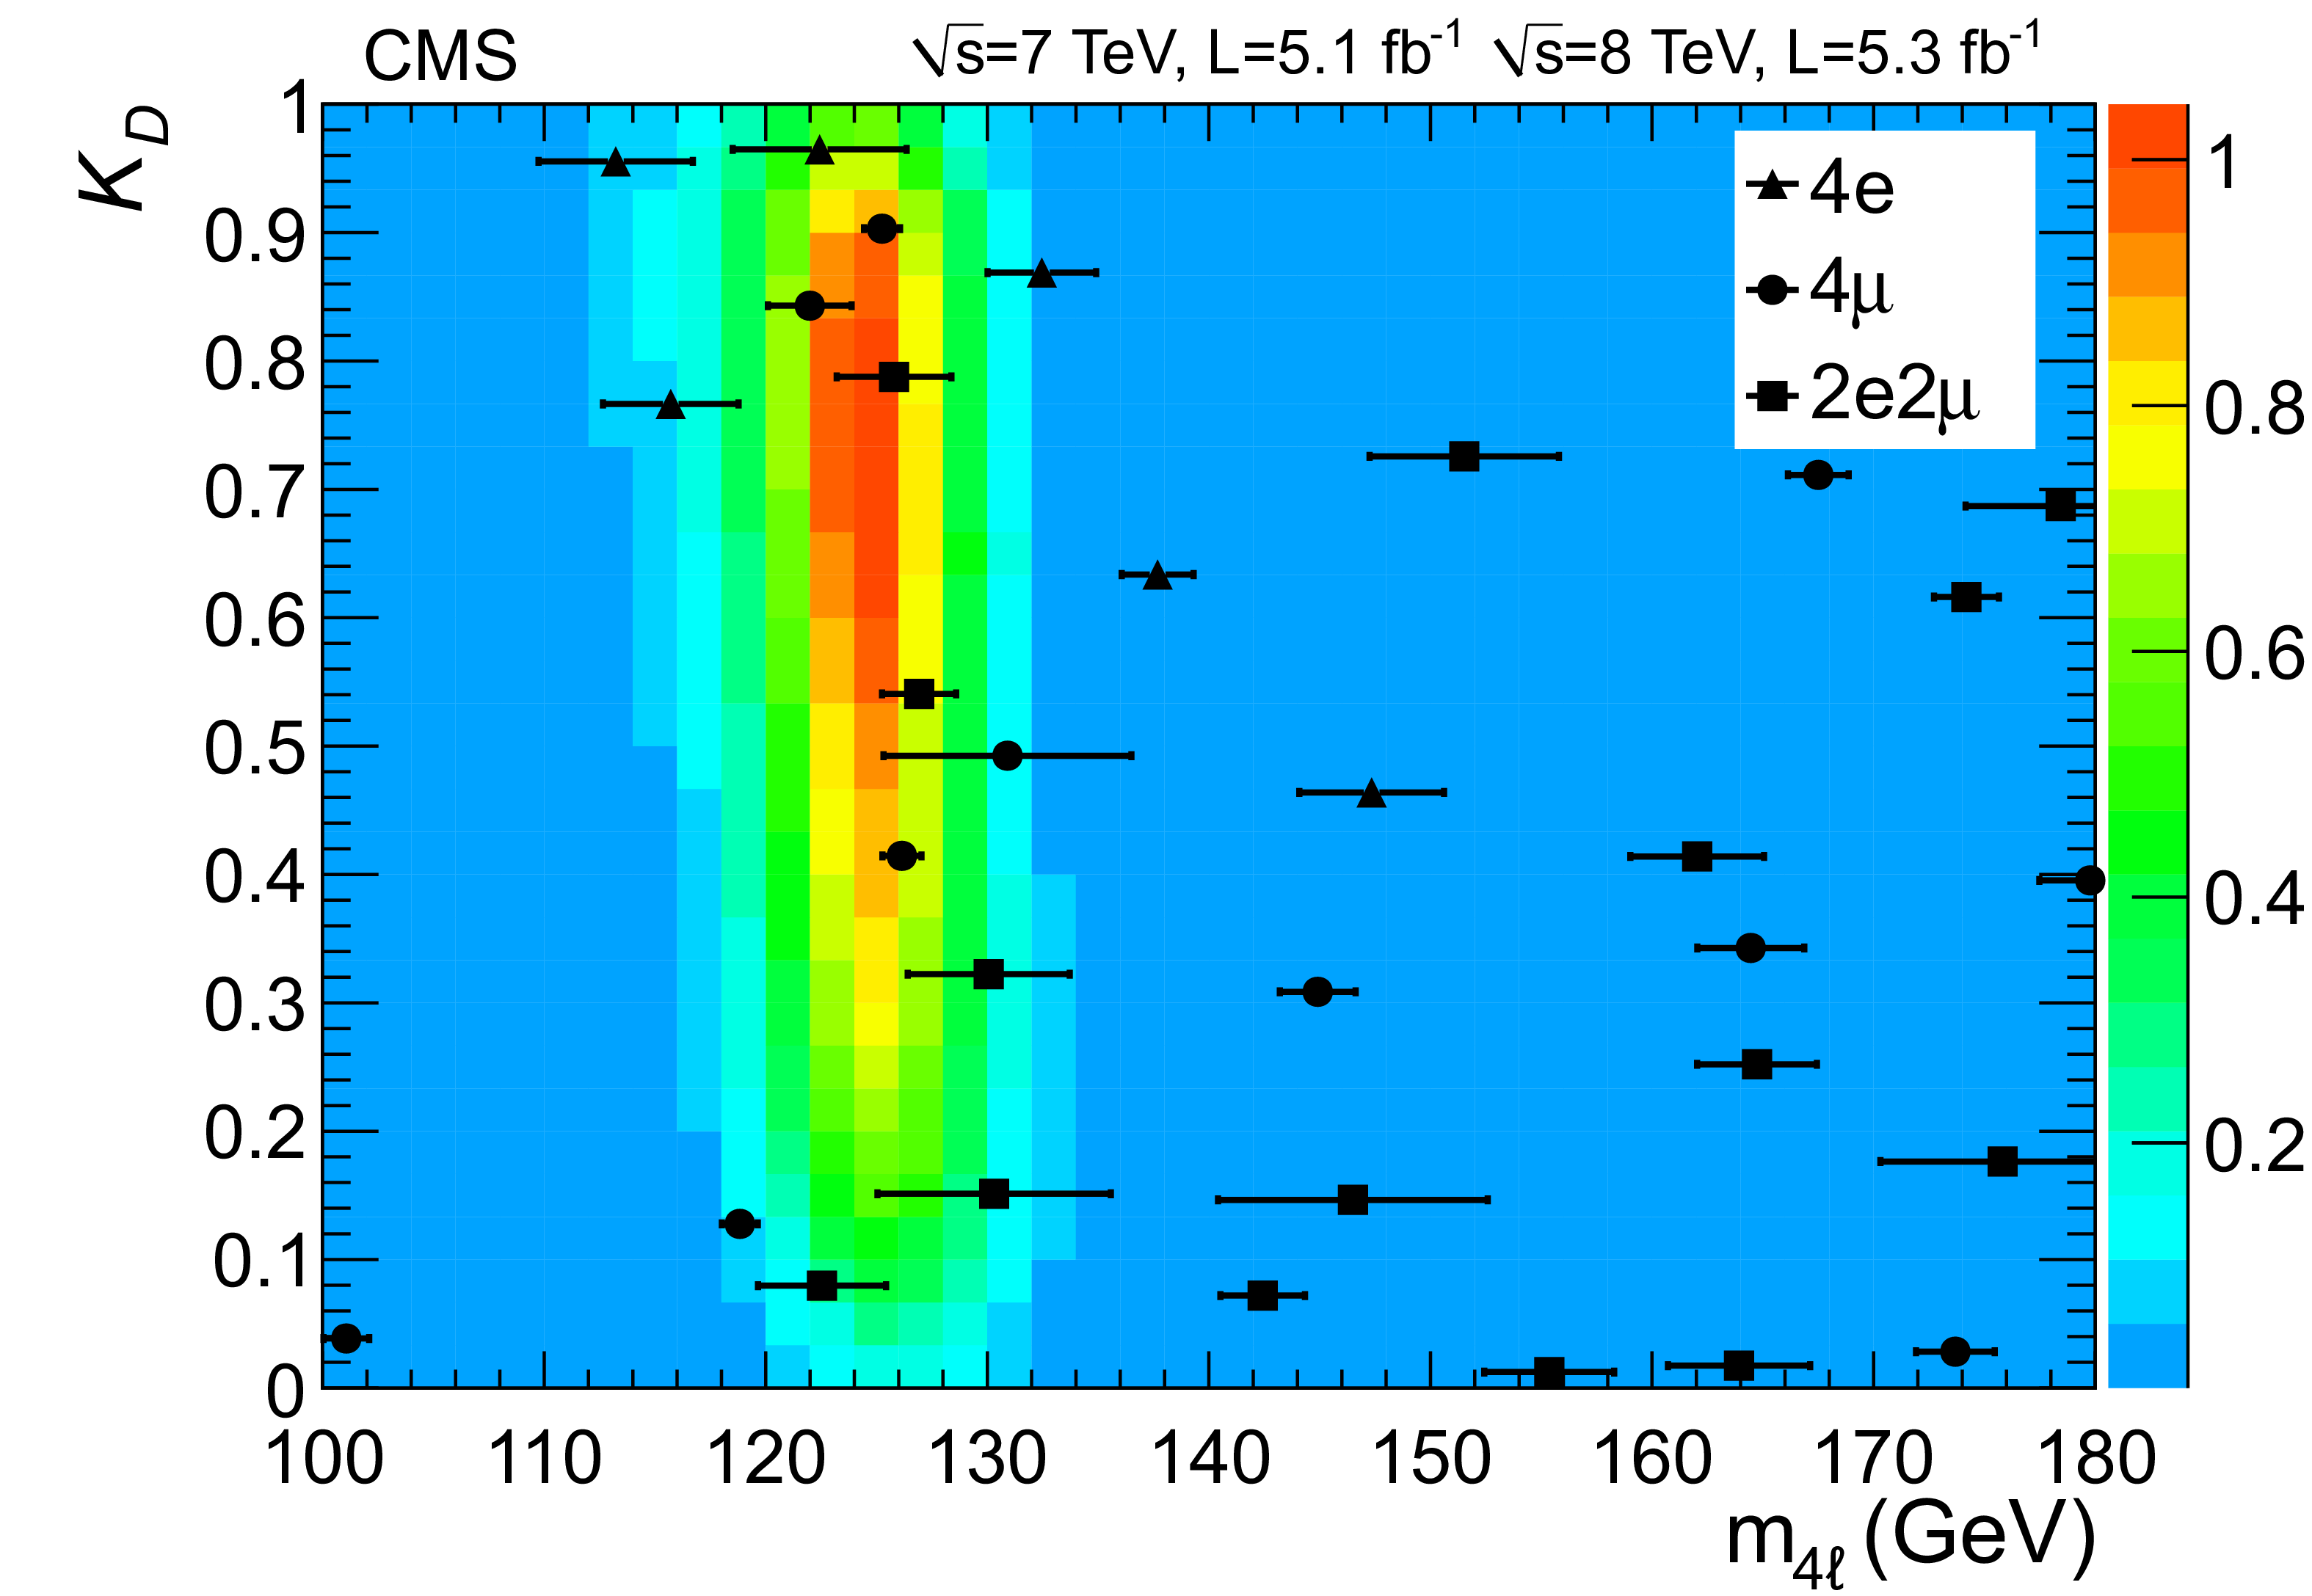
Figure 5-a:
The distribution of events selected in the $4\ell $ subchannels for the kinematic discriminant $K_{D}$ versus $m_{4\ell }$. Events in the three final states are marked by filled symbols (defined in the legend). The horizontal error bars indicate the estimated mass resolution. In the upper plot the colour-coded regions show the background expectation; in the lower plot the colour-coded regions show the event density expected from a SM Higgs boson ($ {m_{\mathrm{ H } }}$ = 125 GeV) (both in arbitrary units). |
png pdf |
Figure 5-b:
The distribution of events selected in the $4\ell $ subchannels for the kinematic discriminant $K_{D}$ versus $m_{4\ell }$. Events in the three final states are marked by filled symbols (defined in the legend). The horizontal error bars indicate the estimated mass resolution. In the upper plot the colour-coded regions show the background expectation; in the lower plot the colour-coded regions show the event density expected from a SM Higgs boson ($ {m_{\mathrm{ H } }}$ = 125 GeV) (both in arbitrary units). |
png pdf |
Figure 6:
The observed local $p$-value for the $\mathrm{ Z } \mathrm{ Z } $ decay mode as a function of the SM Higgs boson mass. The dashed line shows the expected local $p$-values for a SM Higgs boson with a mass $ {m_{\mathrm{ H } }}$. |
png pdf |
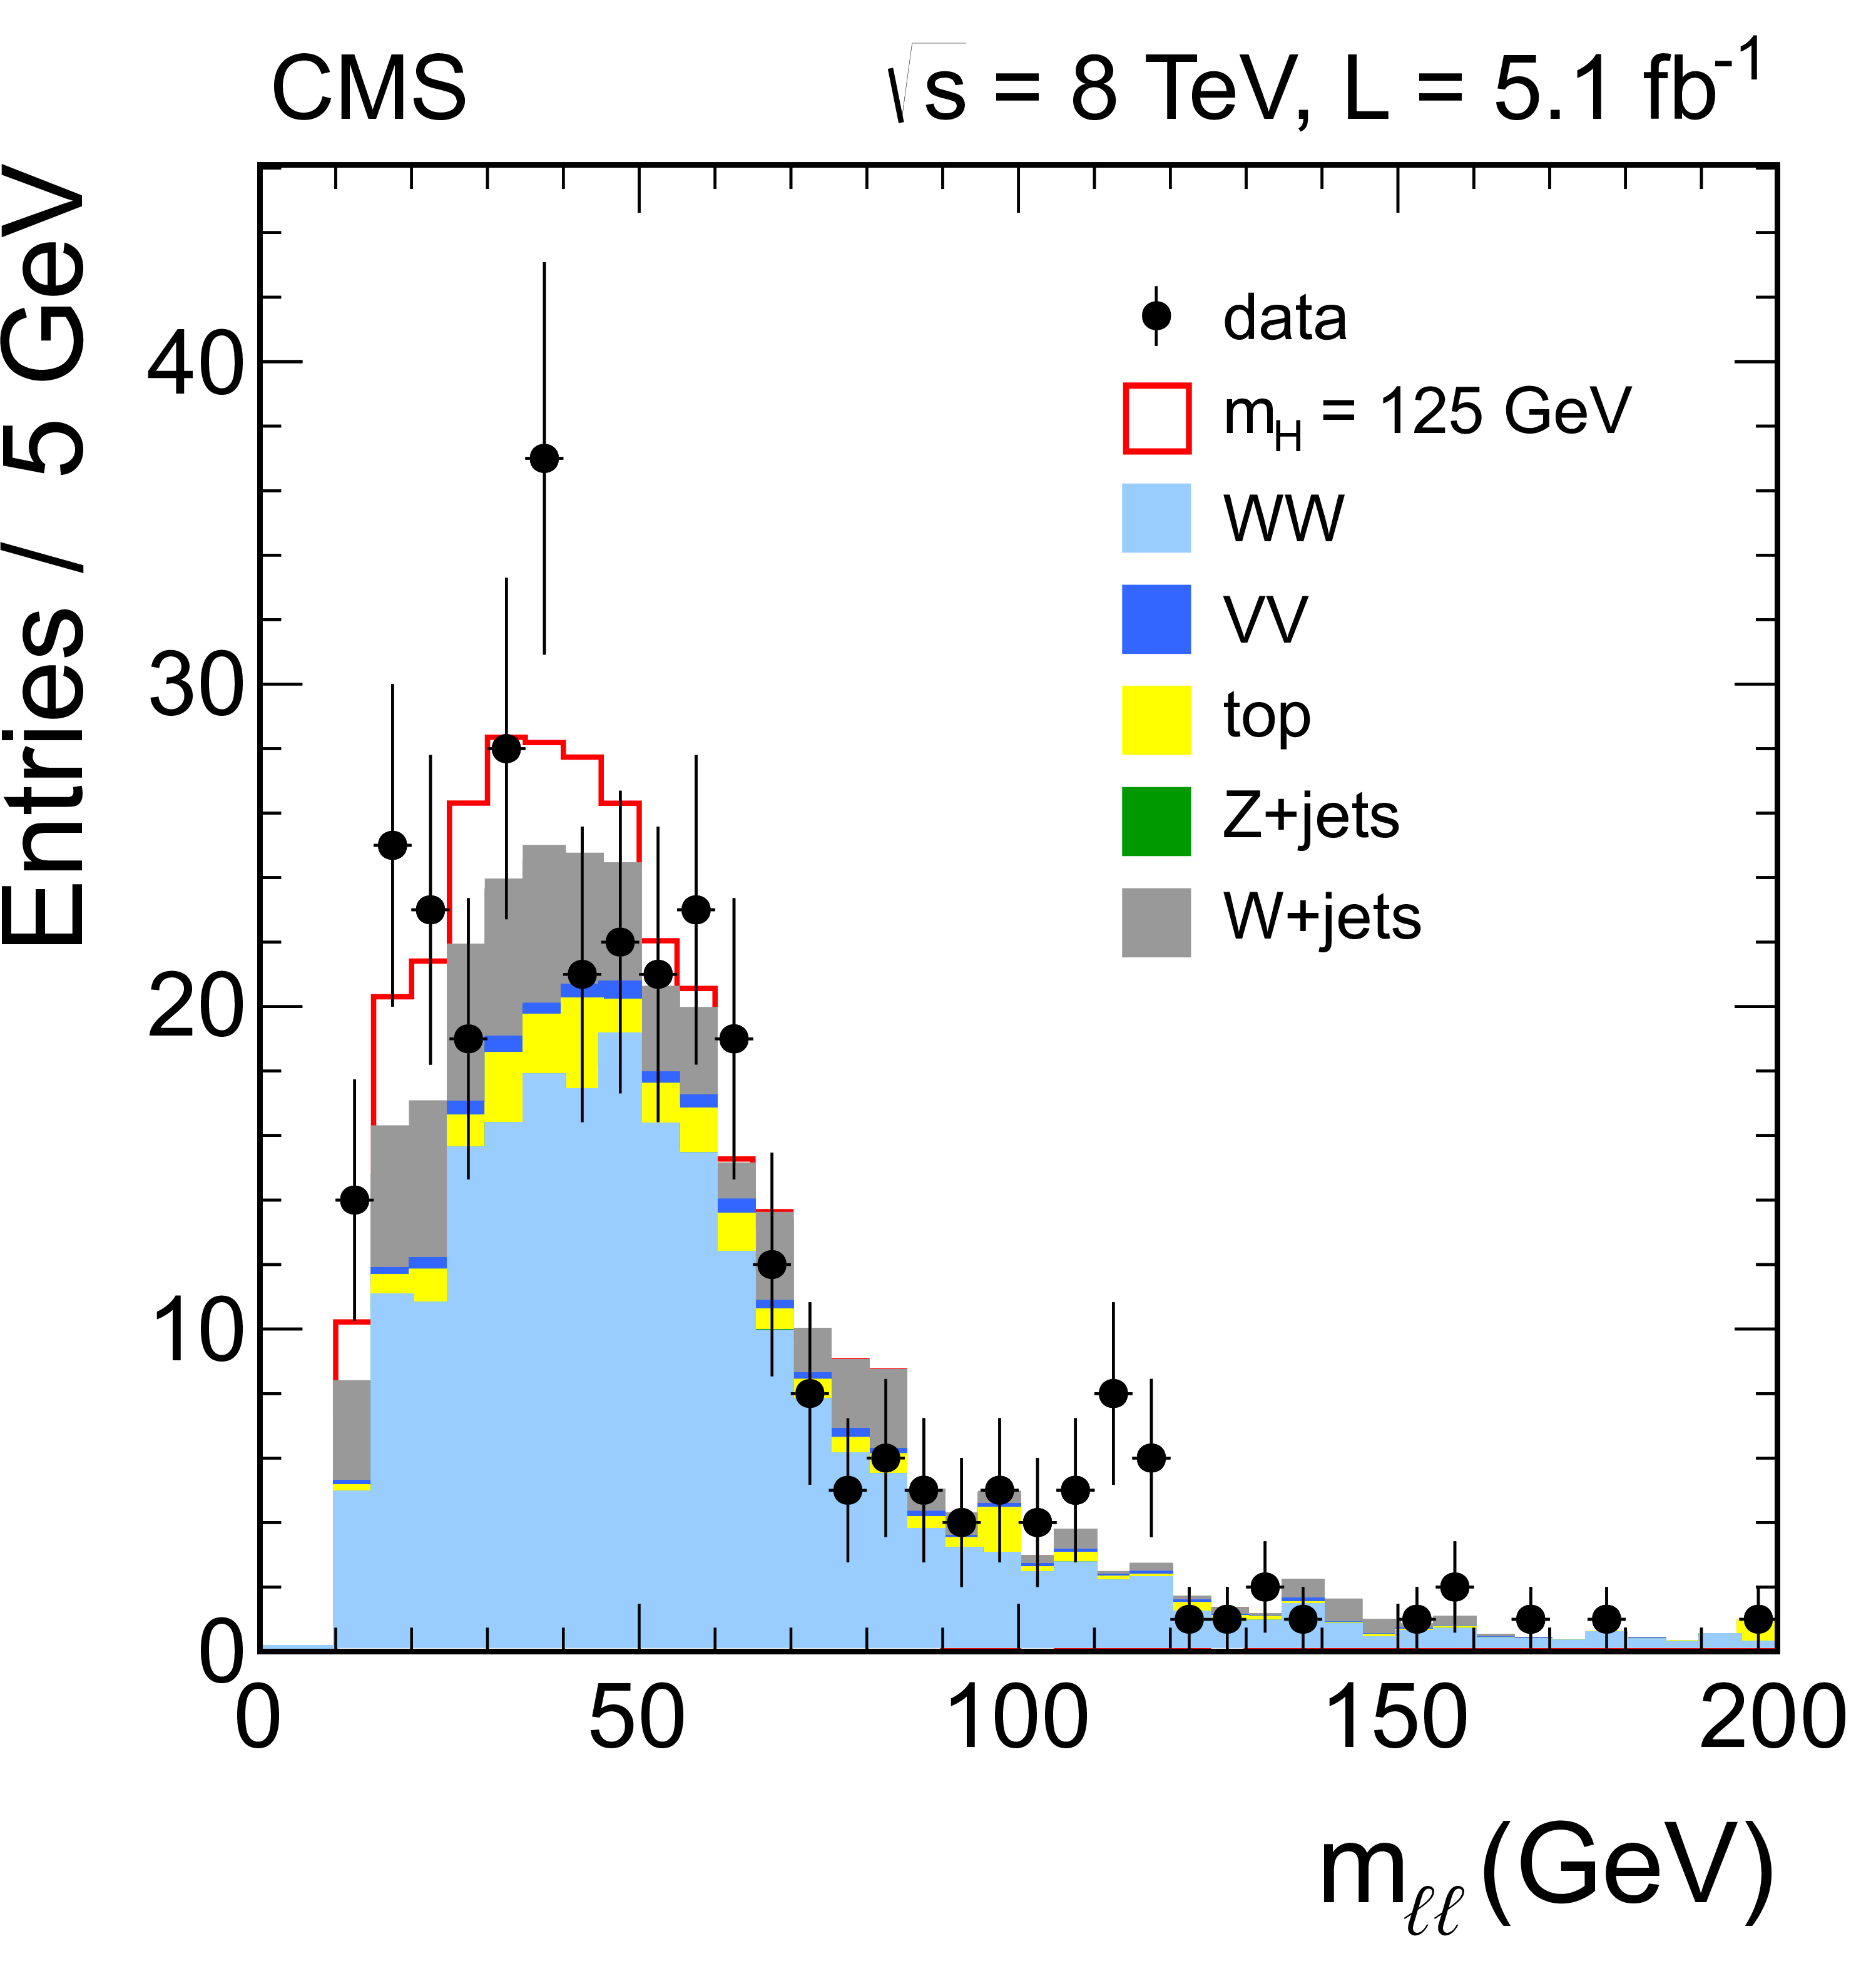
Figure 7:
Distribution of $m_{\ell \ell }$ for the zero-jet $\mathrm{ e } \mu $ category in the $\mathrm{ H } \to \mathrm{ W } \mathrm{ W } $ search at 8 TeV . The signal expected from a Higgs boson with a mass $ {m_{\mathrm{ H } }}= $ 125 GeV is shown added to the background. |

png pdf |
Figure 8:
The 95% CL limit on $\sigma /\sigma _\mathrm {SM}$ for a Higgs boson decaying, via a W boson pair, to two leptons and two neutrinos, for the combined 7 and 8 TeV data sets. The symbol $\sigma /\sigma _\mathrm {SM}$ denotes the production cross section times the relevant branching fractions, relative to the SM expectation. The background-only expectations are represented by their median (dashed line) and by the 68% and 95% CL bands. The dotted curve shows the median expected limit for a SM Higgs boson with $ {m_{\mathrm{ H } }}= $ 125 GeV. |
png pdf |
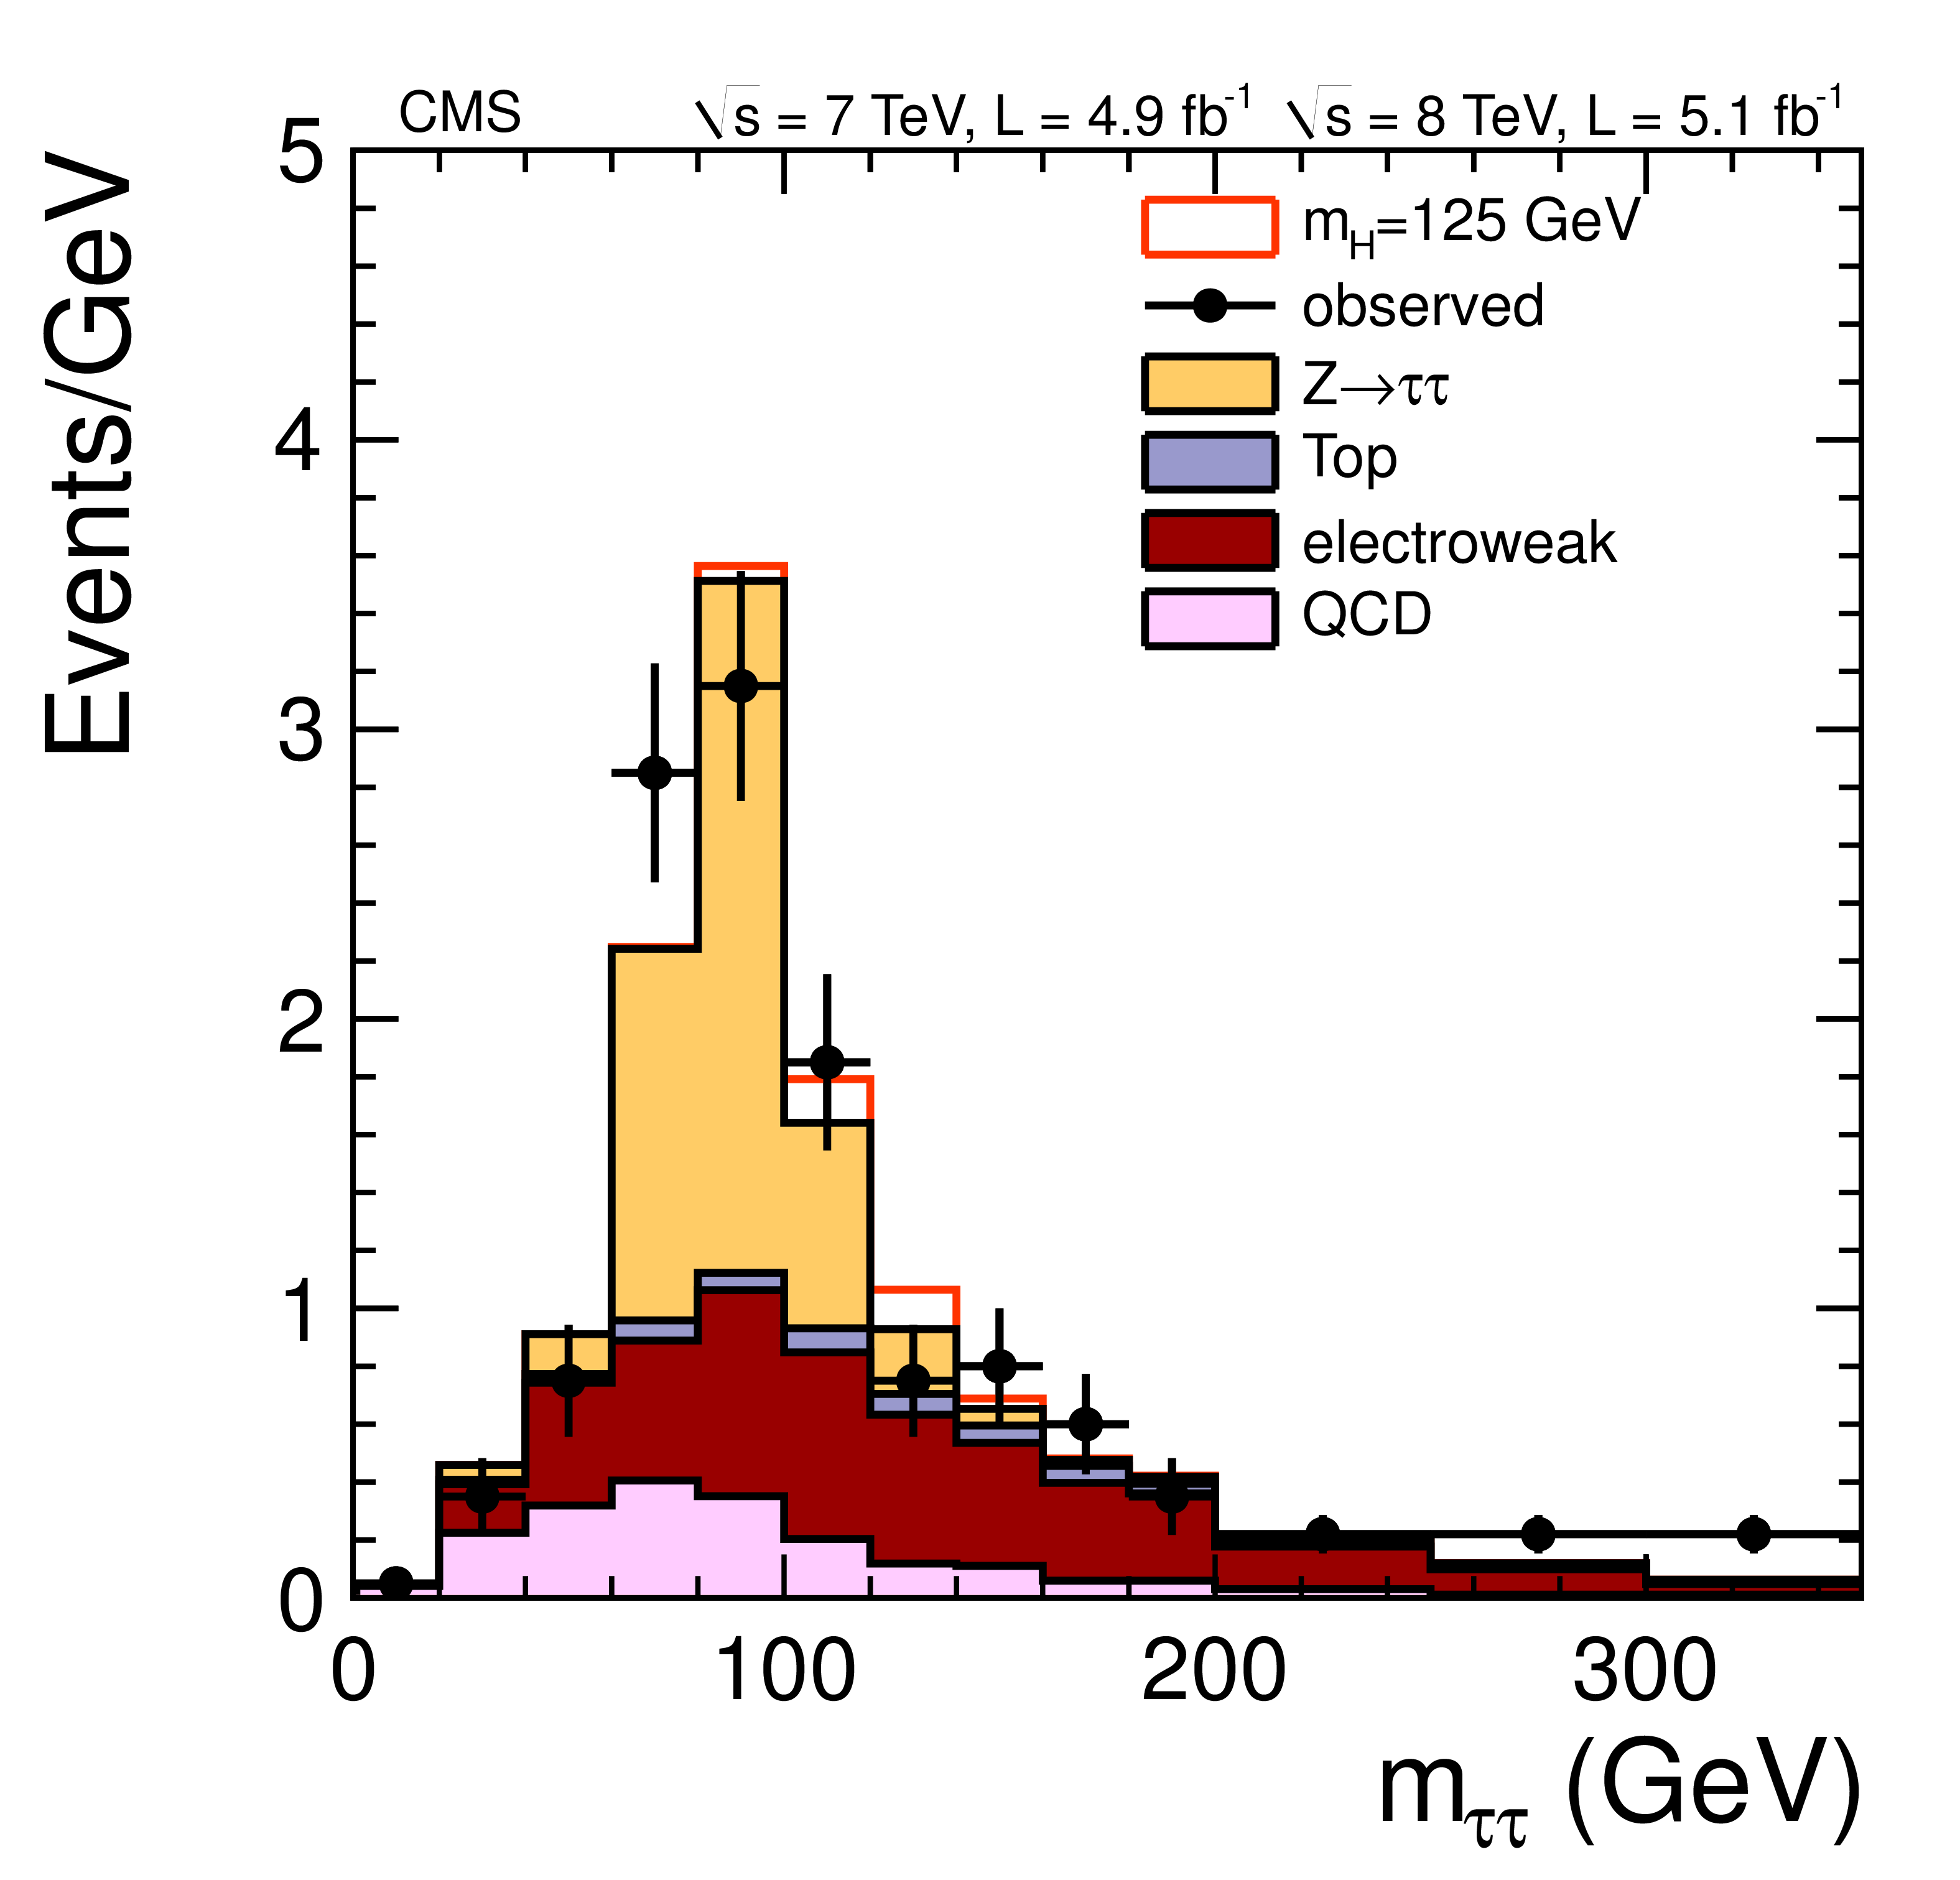
Figure 9:
Distribution of $m_{ \tau \tau }$ in the combined 7and 8 TeV data sets for the $\mu \tau _{\mathrm h}$ VBF category of the $\mathrm{ H } \to \tau \tau $ search. The signal expected from a SM Higgs boson ($ {m_{\mathrm{ H } }}= $ 125 GeV) is added to the background. |
png pdf |
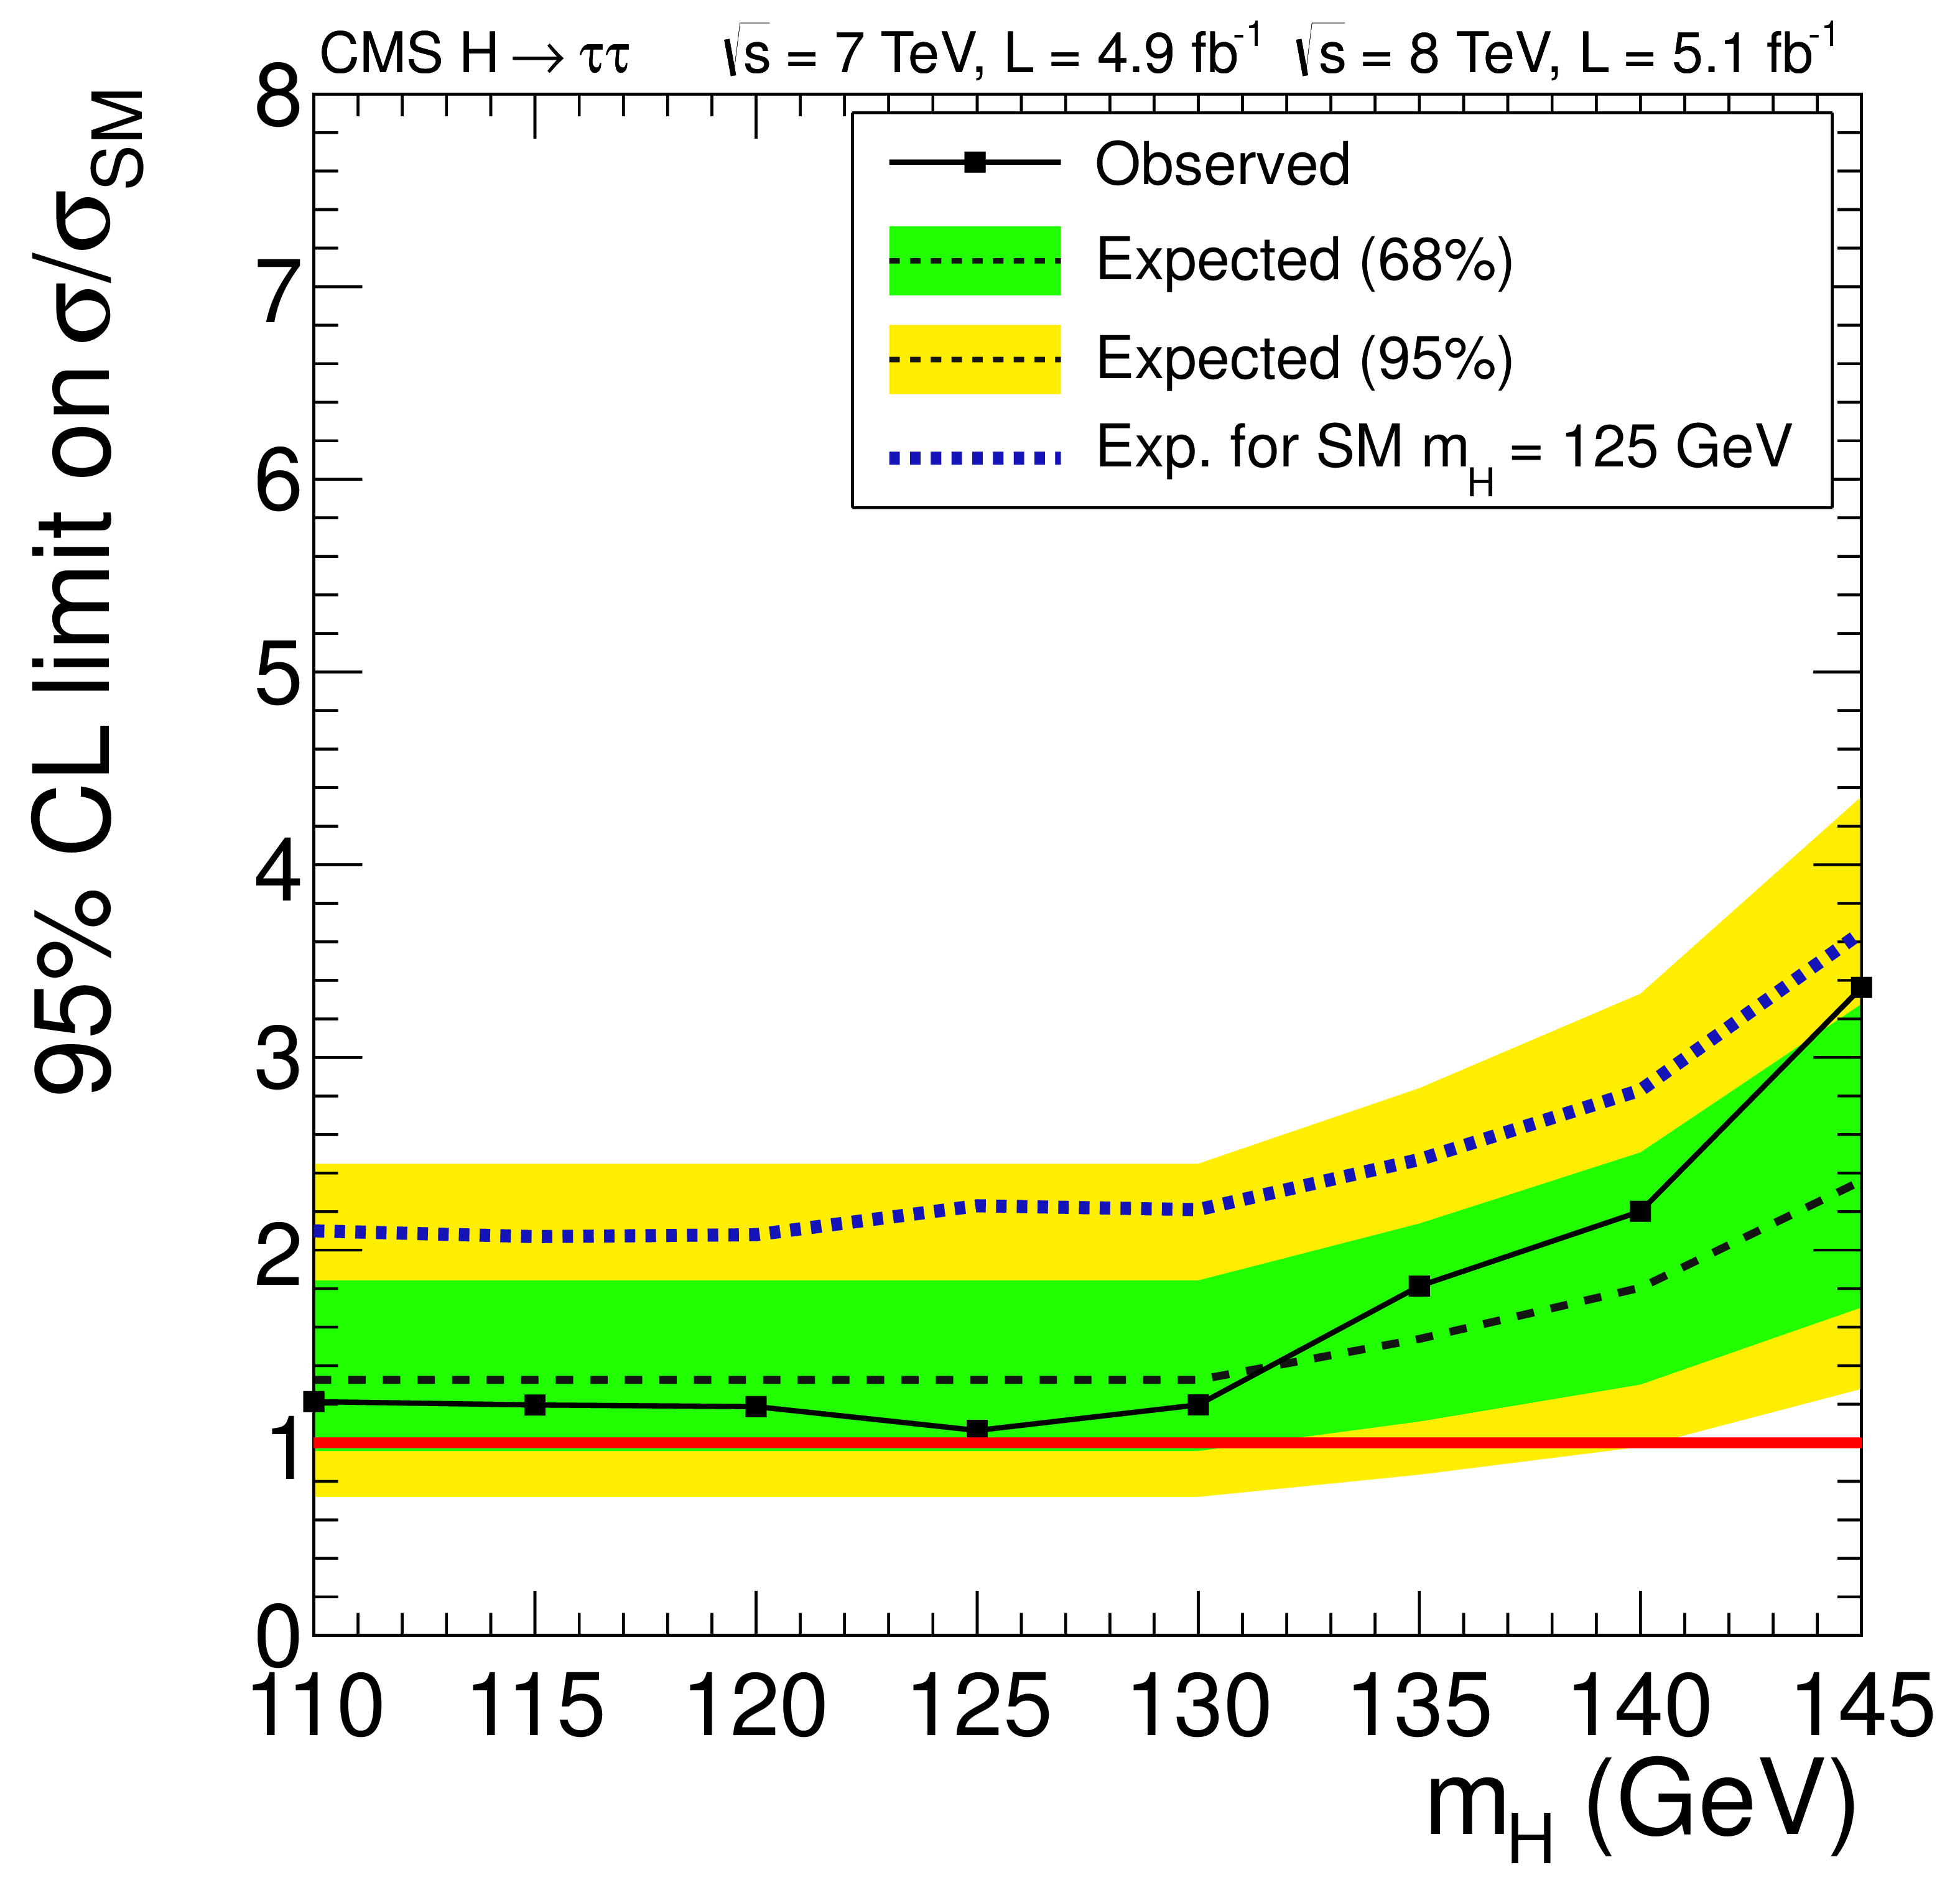
Figure 10:
The 95% CL limit on the signal strength $\sigma /\sigma _\mathrm {SM}$ for a Higgs boson decaying to $ \tau $ pairs, for the combined 7 and 8 TeV data sets. The symbol $\sigma /\sigma _\mathrm {SM}$ denotes the production cross section times the relevant branching fractions, relative to the SM expectation. The background-only expectations are represented by their median (dashed line) and by the 68% and 95% CL bands. The dotted curve shows the median expected limit for a SM Higgs boson with $ {m_{\mathrm{ H } }}= $ 125 GeV. |

png pdf |
Figure 11:
Distribution of BDT scores for the high-$ {p_{\mathrm {T}}} $ subchannel of the $\mathrm{ Z } (\nu \nu )\mathrm{ H } (\mathrm{ b } \mathrm{ b } )$ search in the 8 TeV data set after all selection criteria have been applied. The signal expected from a Higgs boson ($ {m_{\mathrm{ H } }}= $ 125 GeV), including $\mathrm{ W } (\ell \nu )\mathrm{ H } $ events where the charged lepton is not reconstructed, is shown added to the background and also overlaid for comparison with the diboson background. |
png pdf |
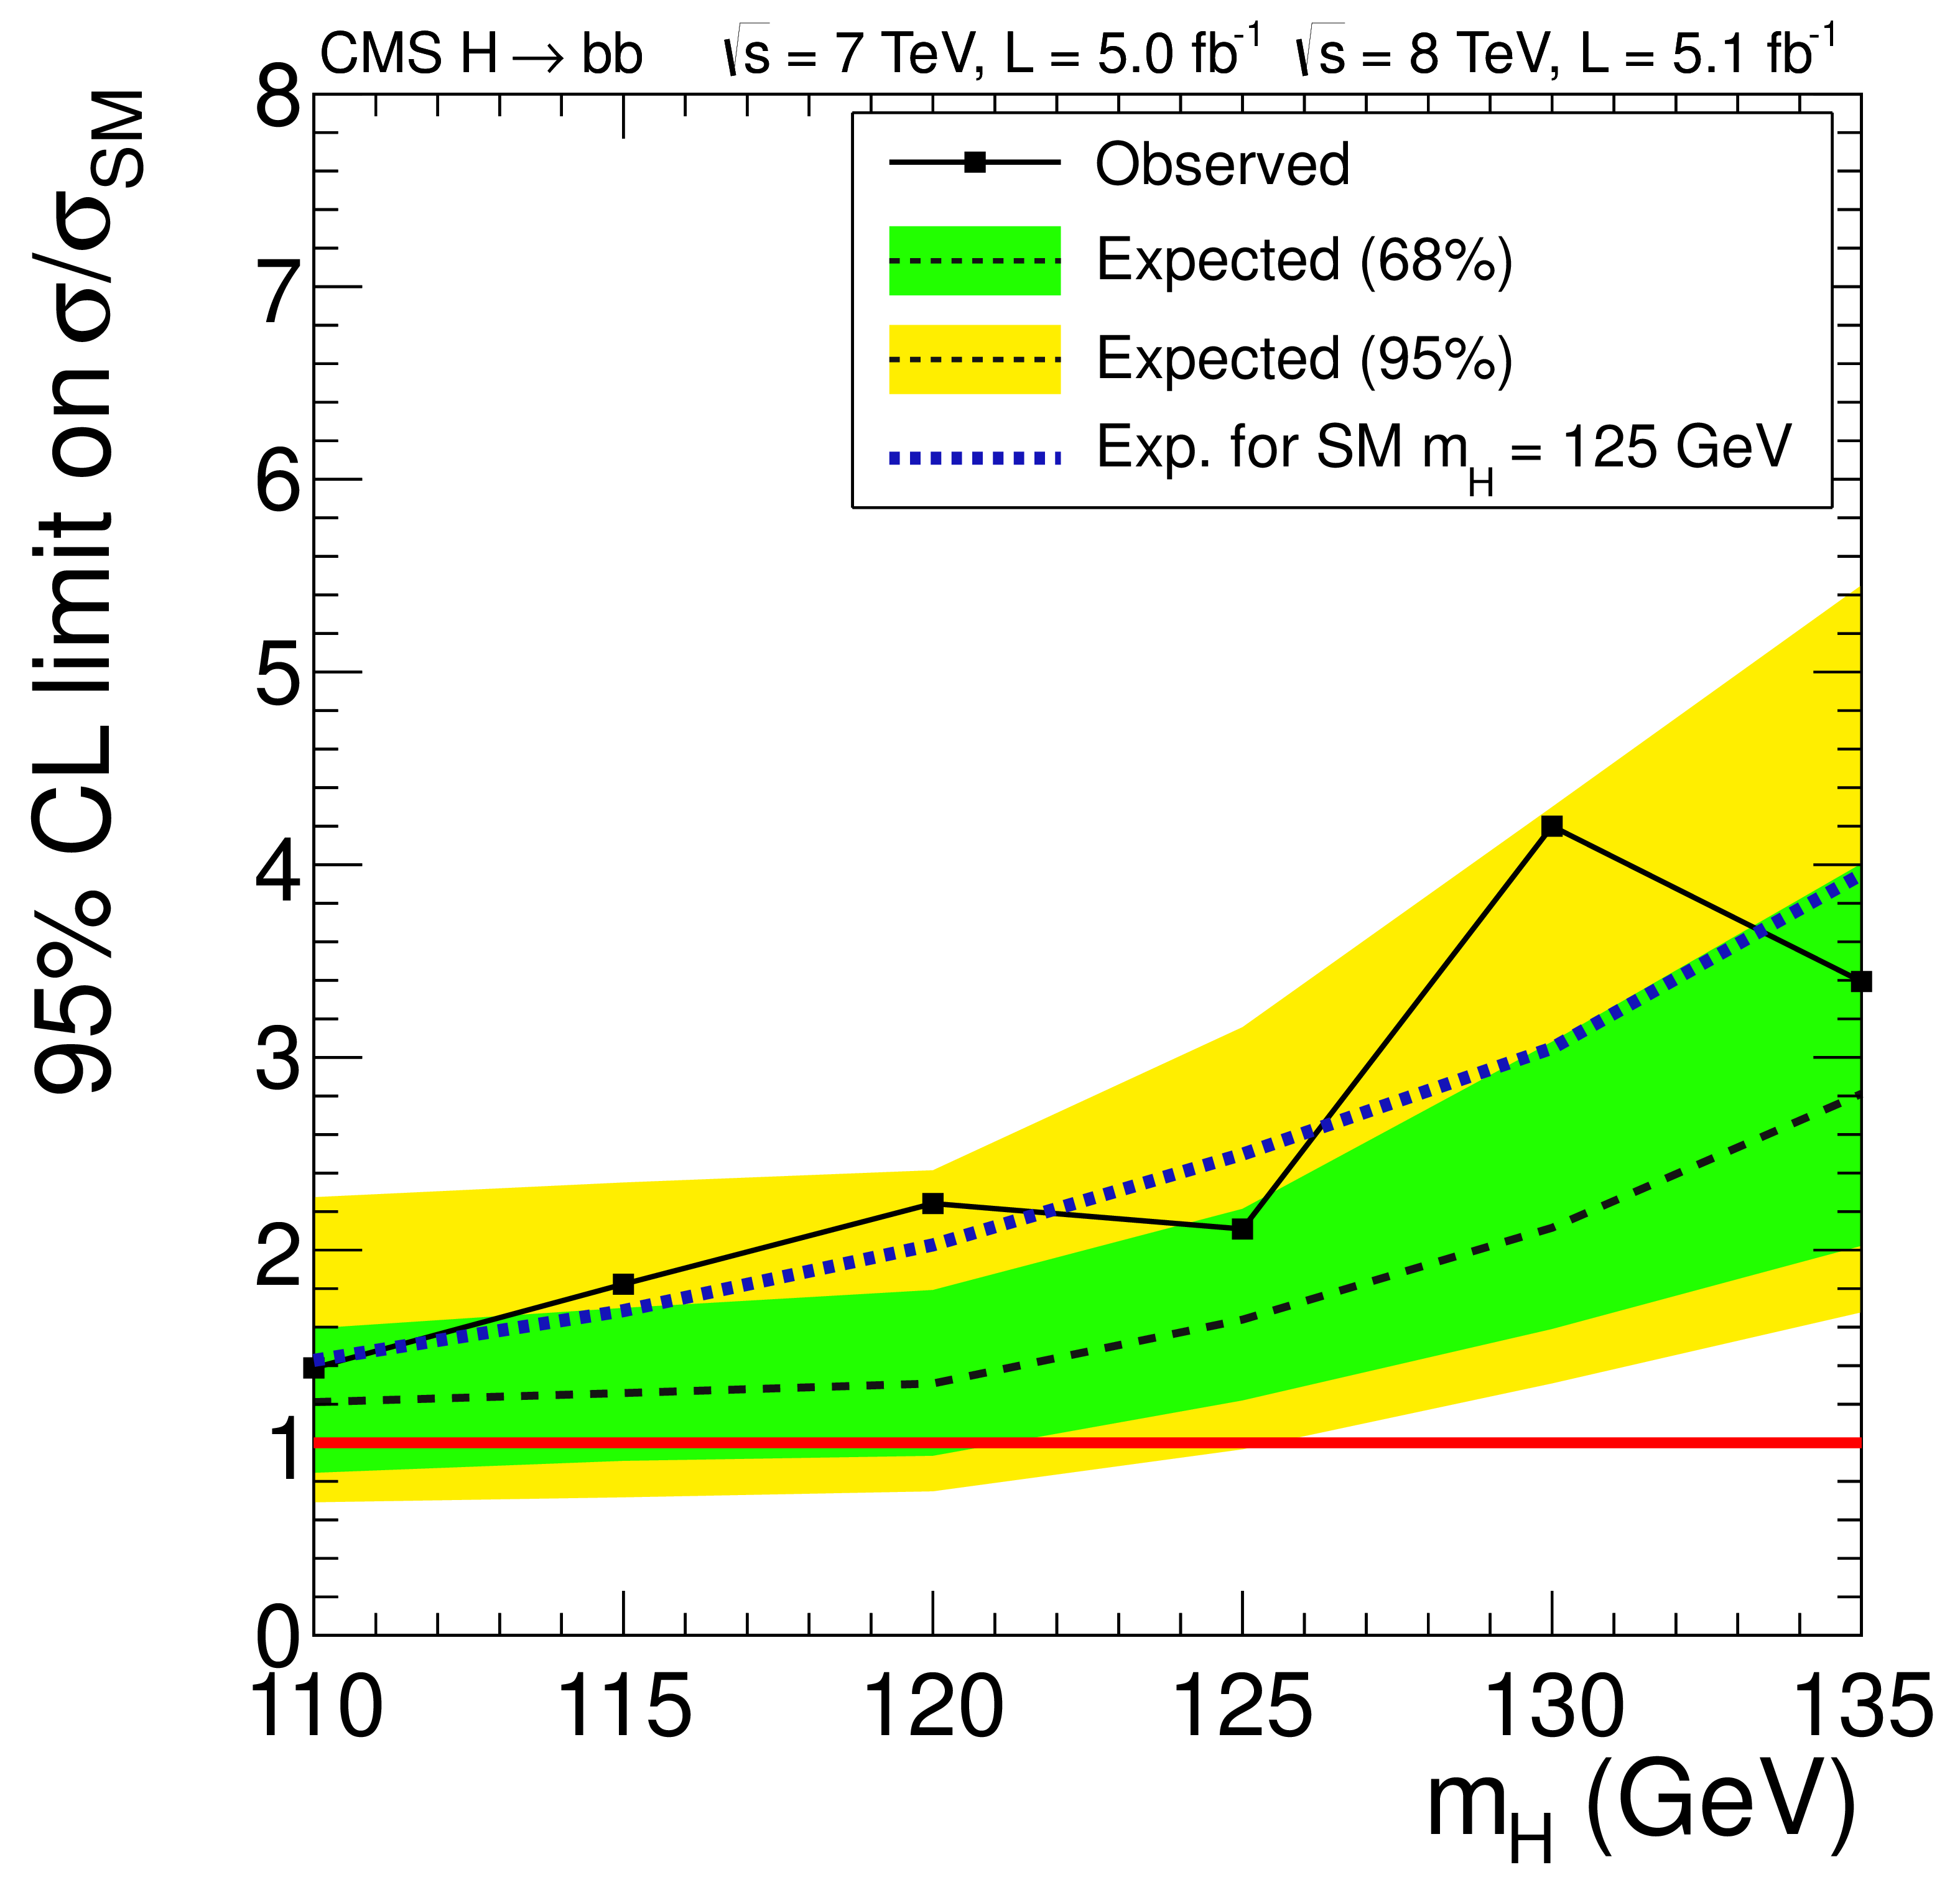
Figure 12:
The 95% CL limit on the signal strength $\sigma /\sigma _\mathrm {SM}$ for a Higgs boson decaying to two b quarks, for the combined 7 and 8 TeV data sets. The symbol $\sigma /\sigma _\mathrm {SM}$ denotes the production cross section times the relevant branching fractions, relative to the SM expectation. The background-only expectations are represented by their median (dashed line) and by the 68% and 95% CL bands. The dotted curve shows the median expected limit for a SM Higgs boson with $ {m_{\mathrm{ H } }}=$ 125 GeV. |
png pdf |
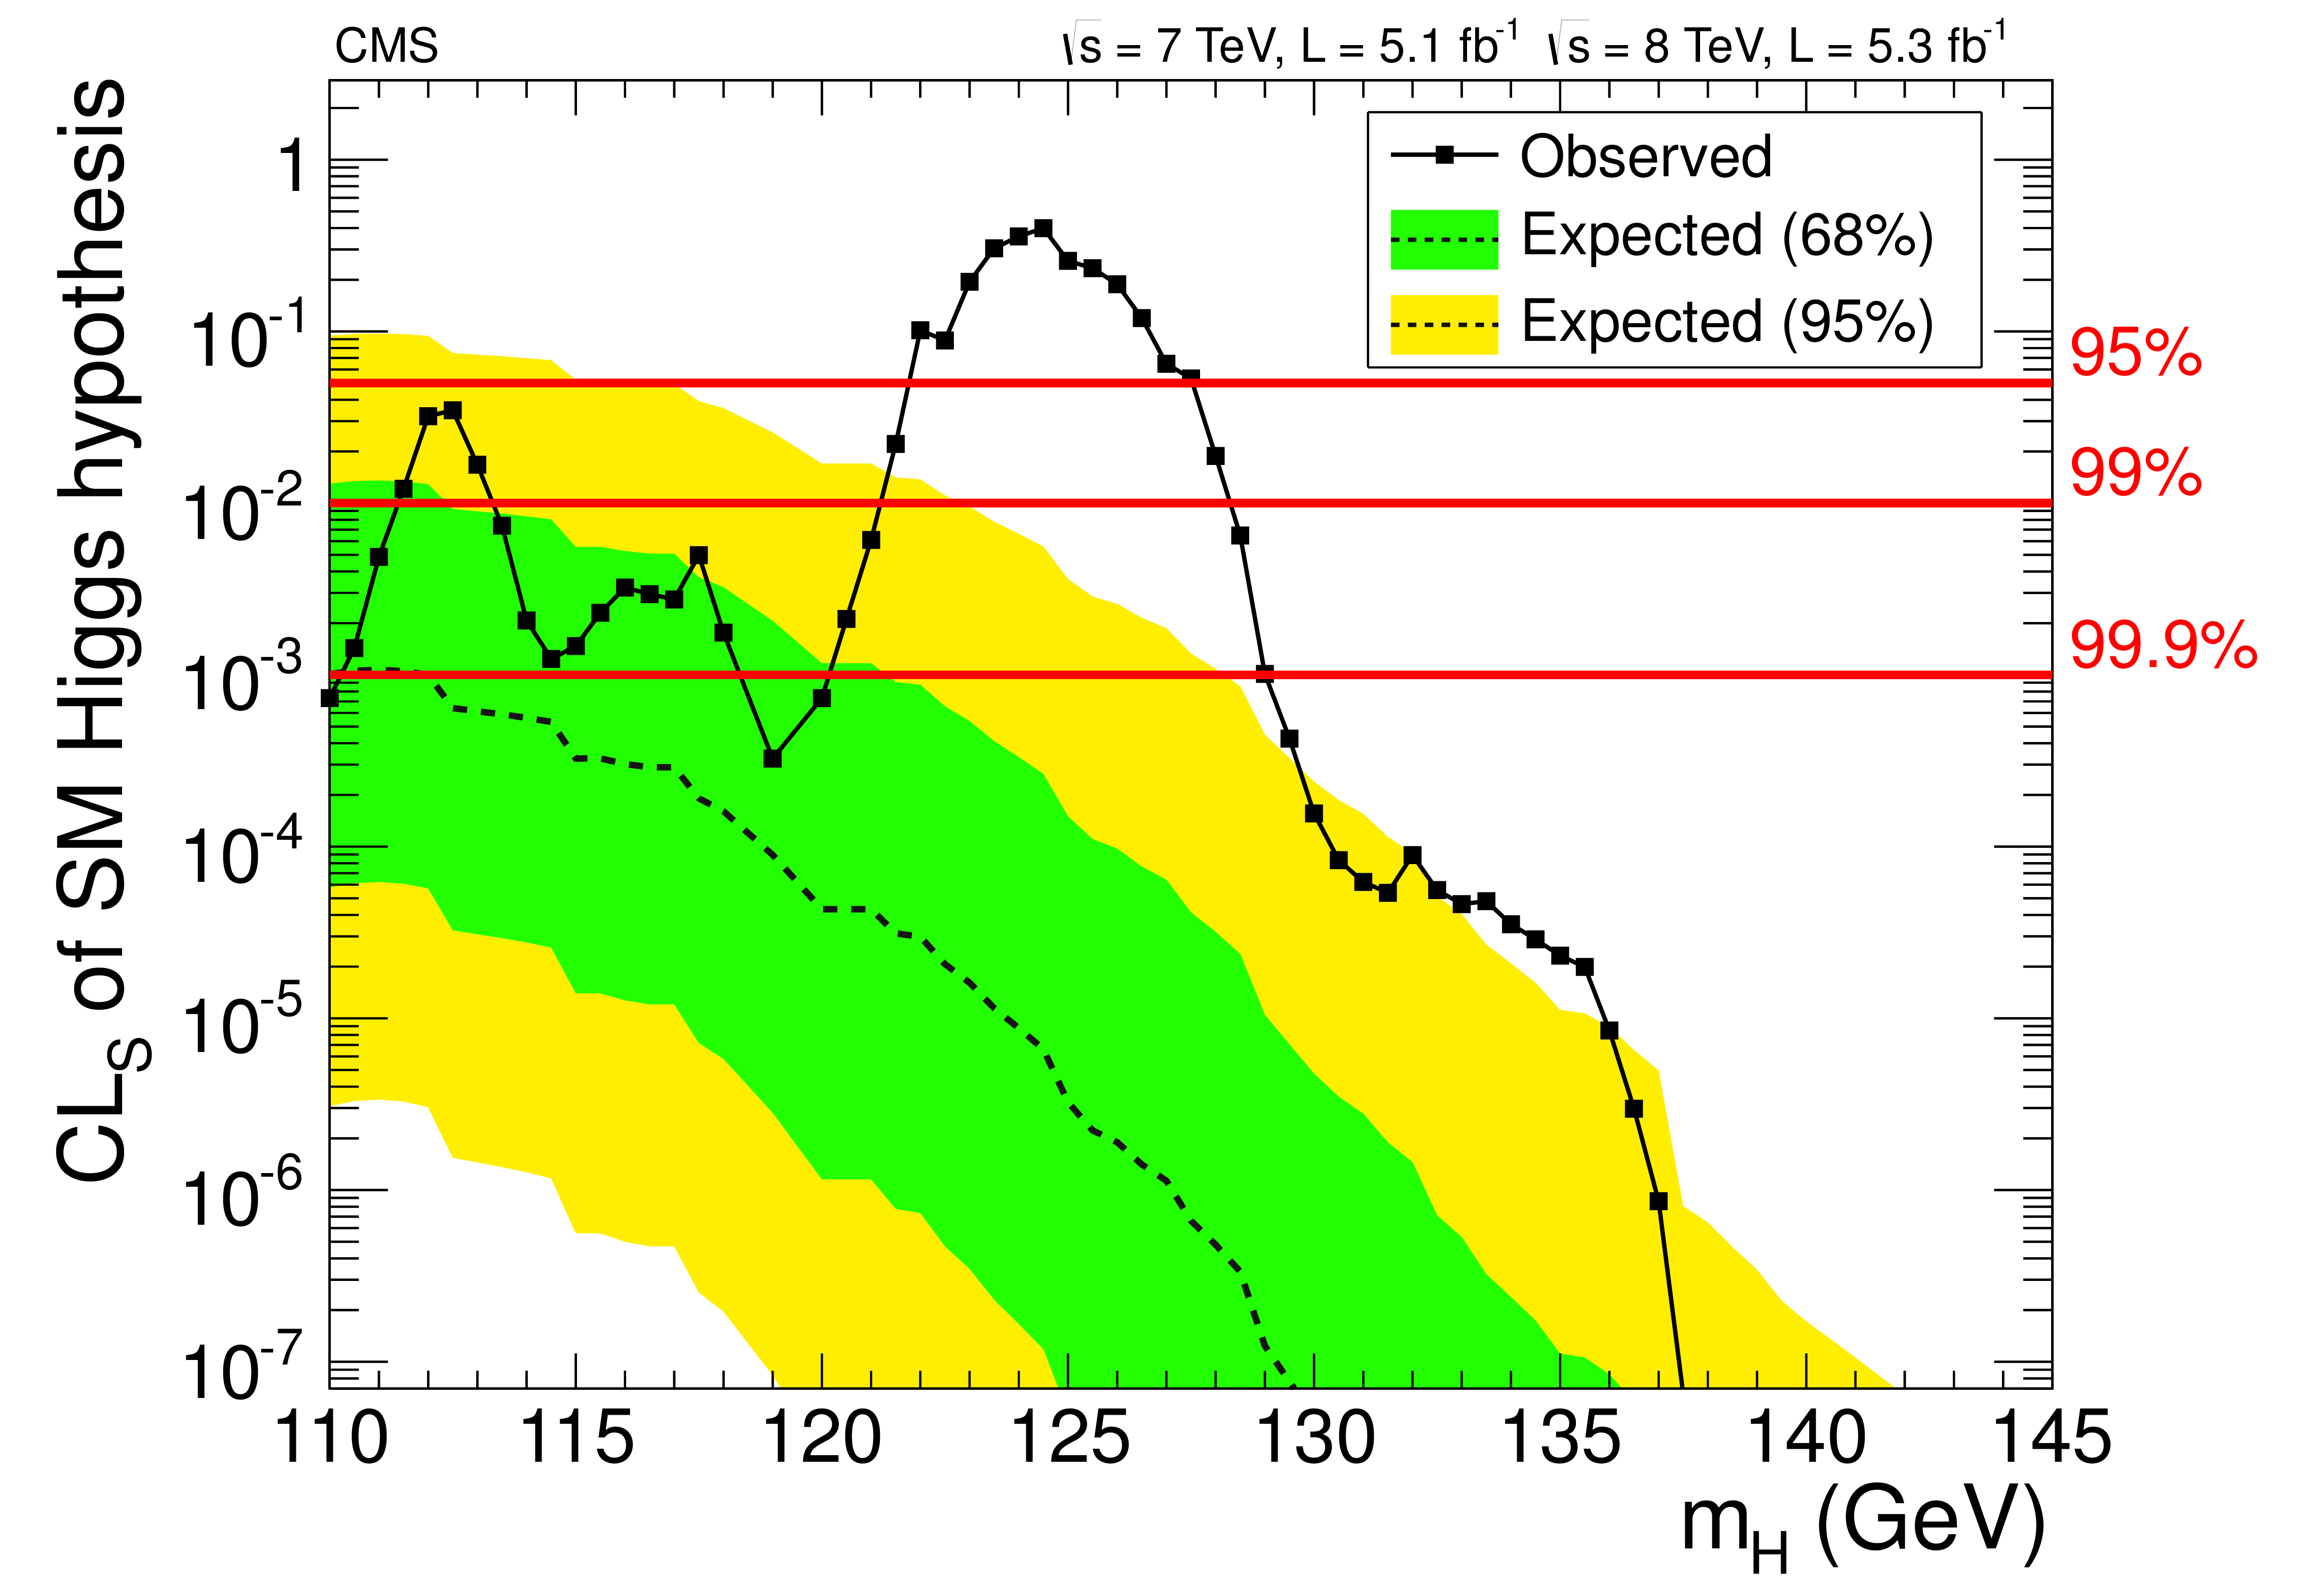
Figure 13:
The $ {\mathrm {CL_s} }$ values for the SM Higgs boson hypothesis as a function of the Higgs boson mass in the range 110-145 GeV. The background-only expectations are represented by their median (dashed line) and by the 68% and 95% CL bands. |
png pdf |
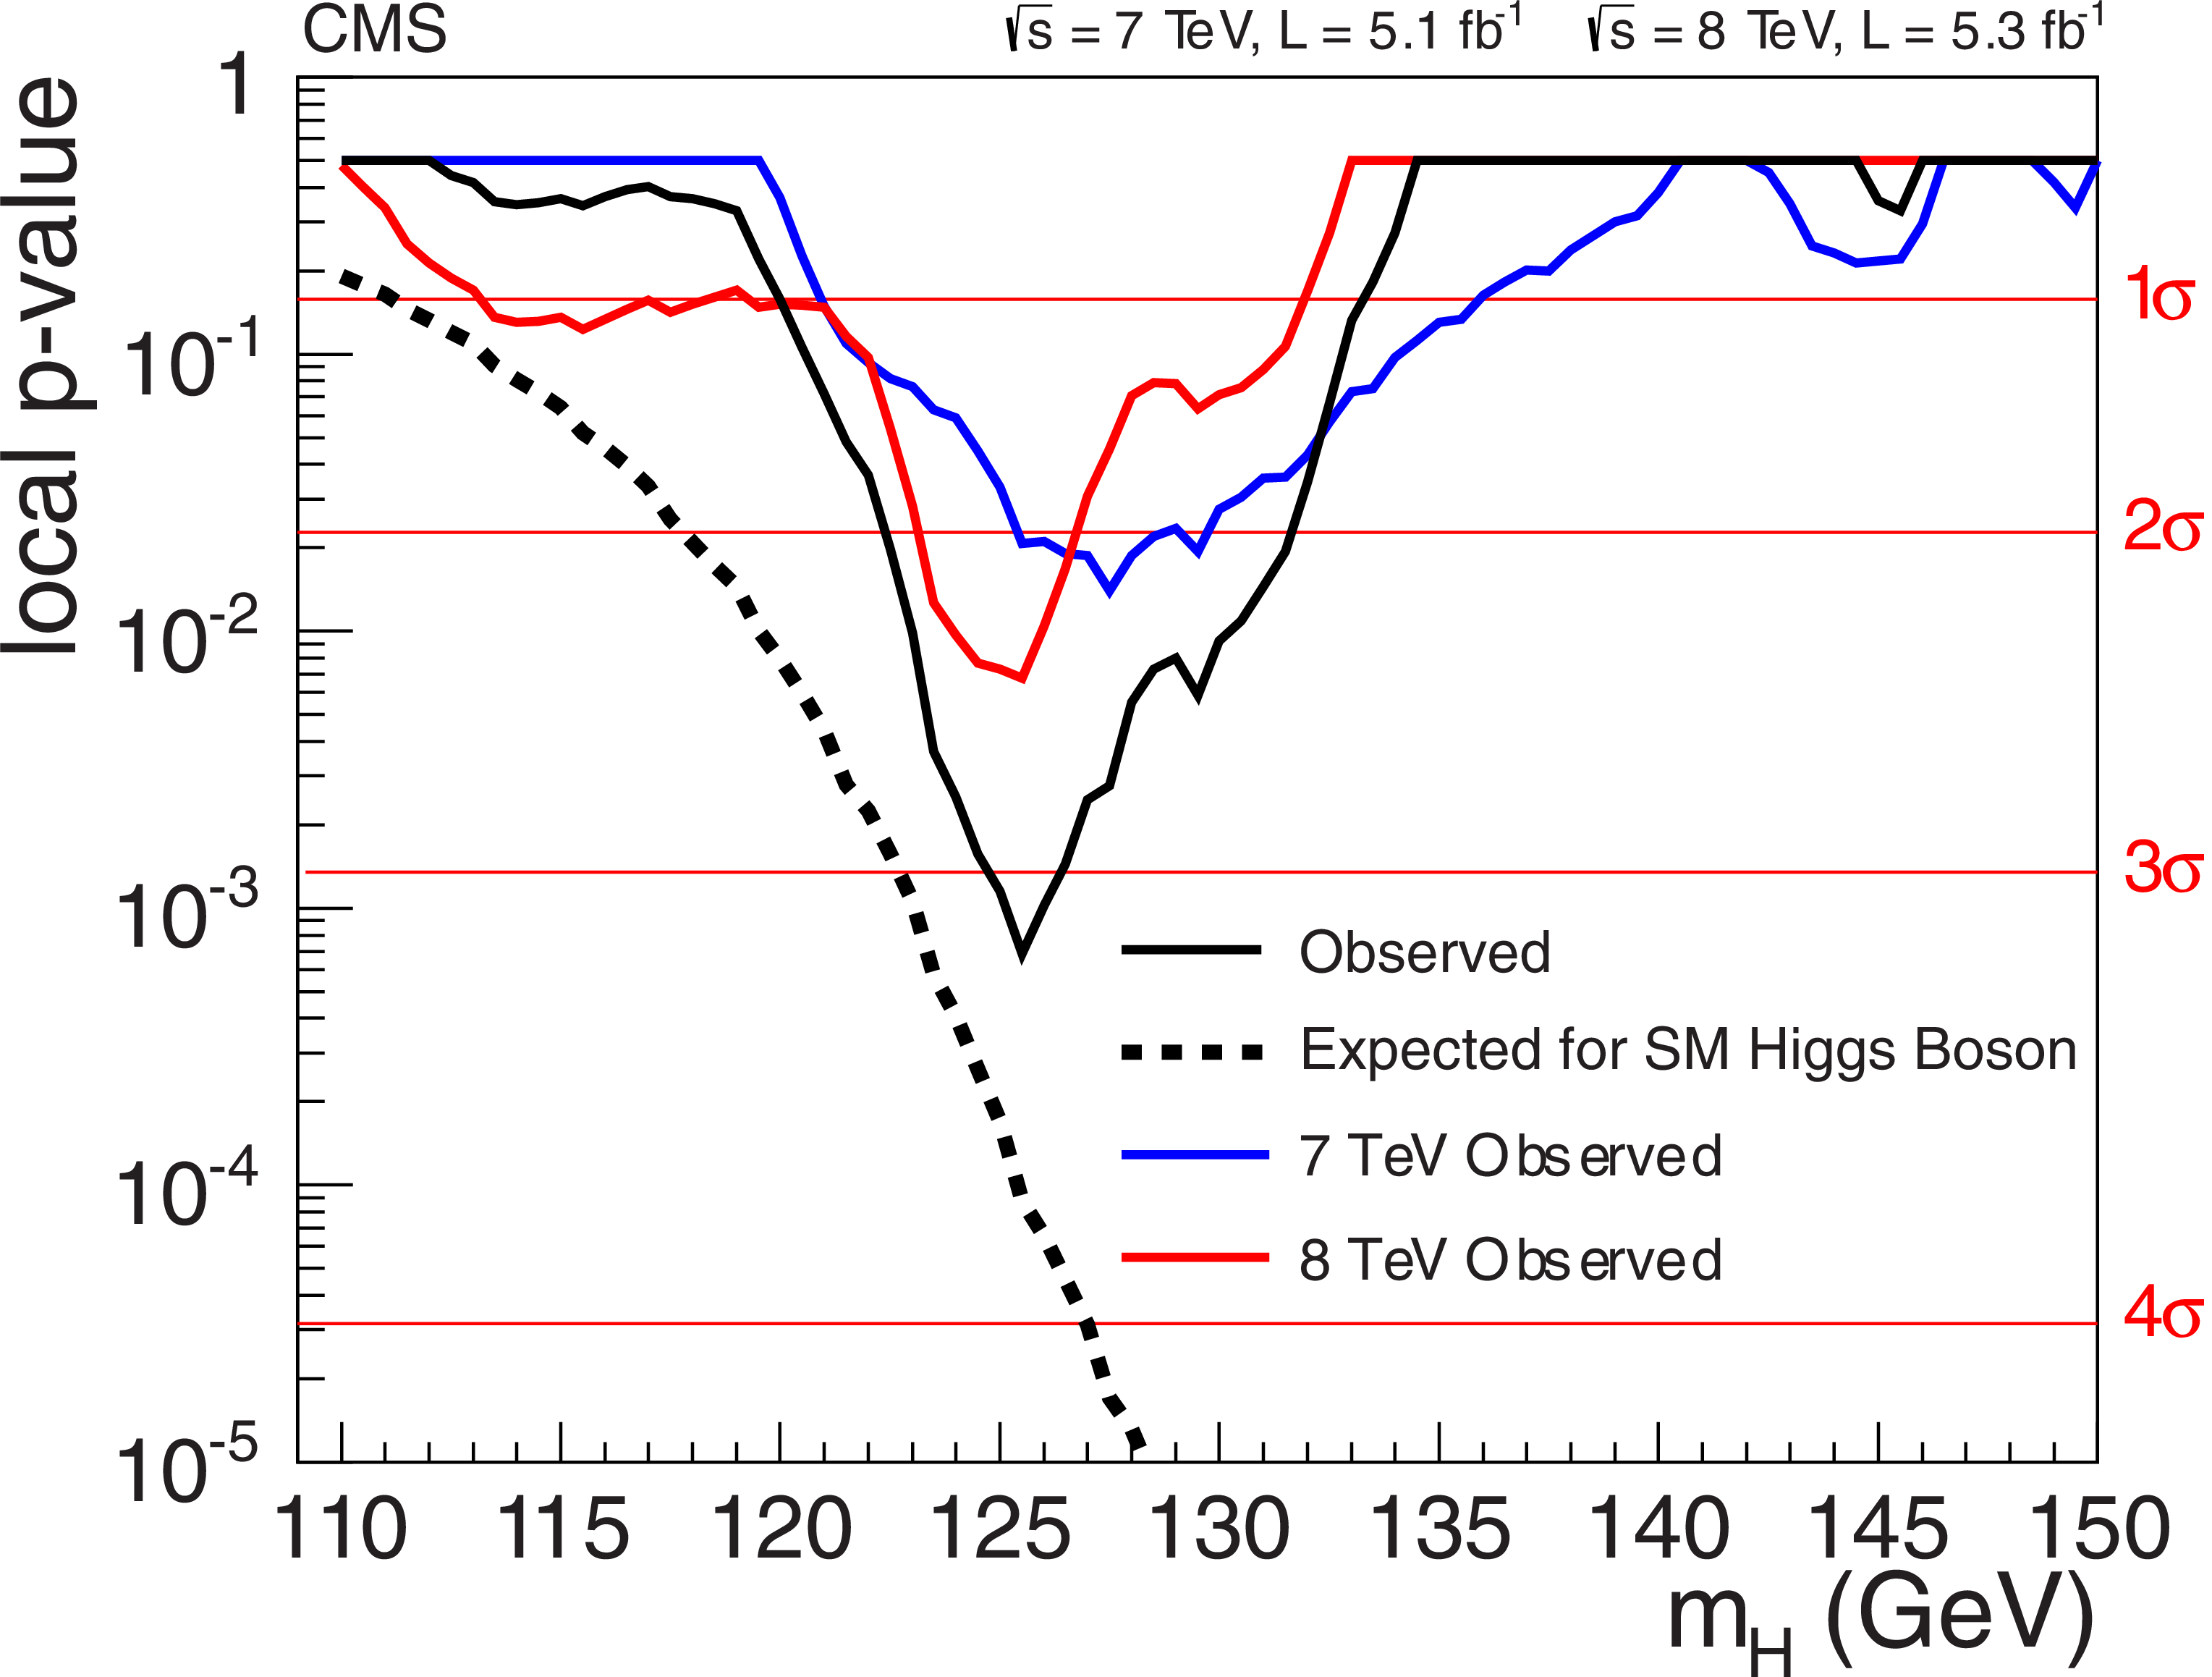
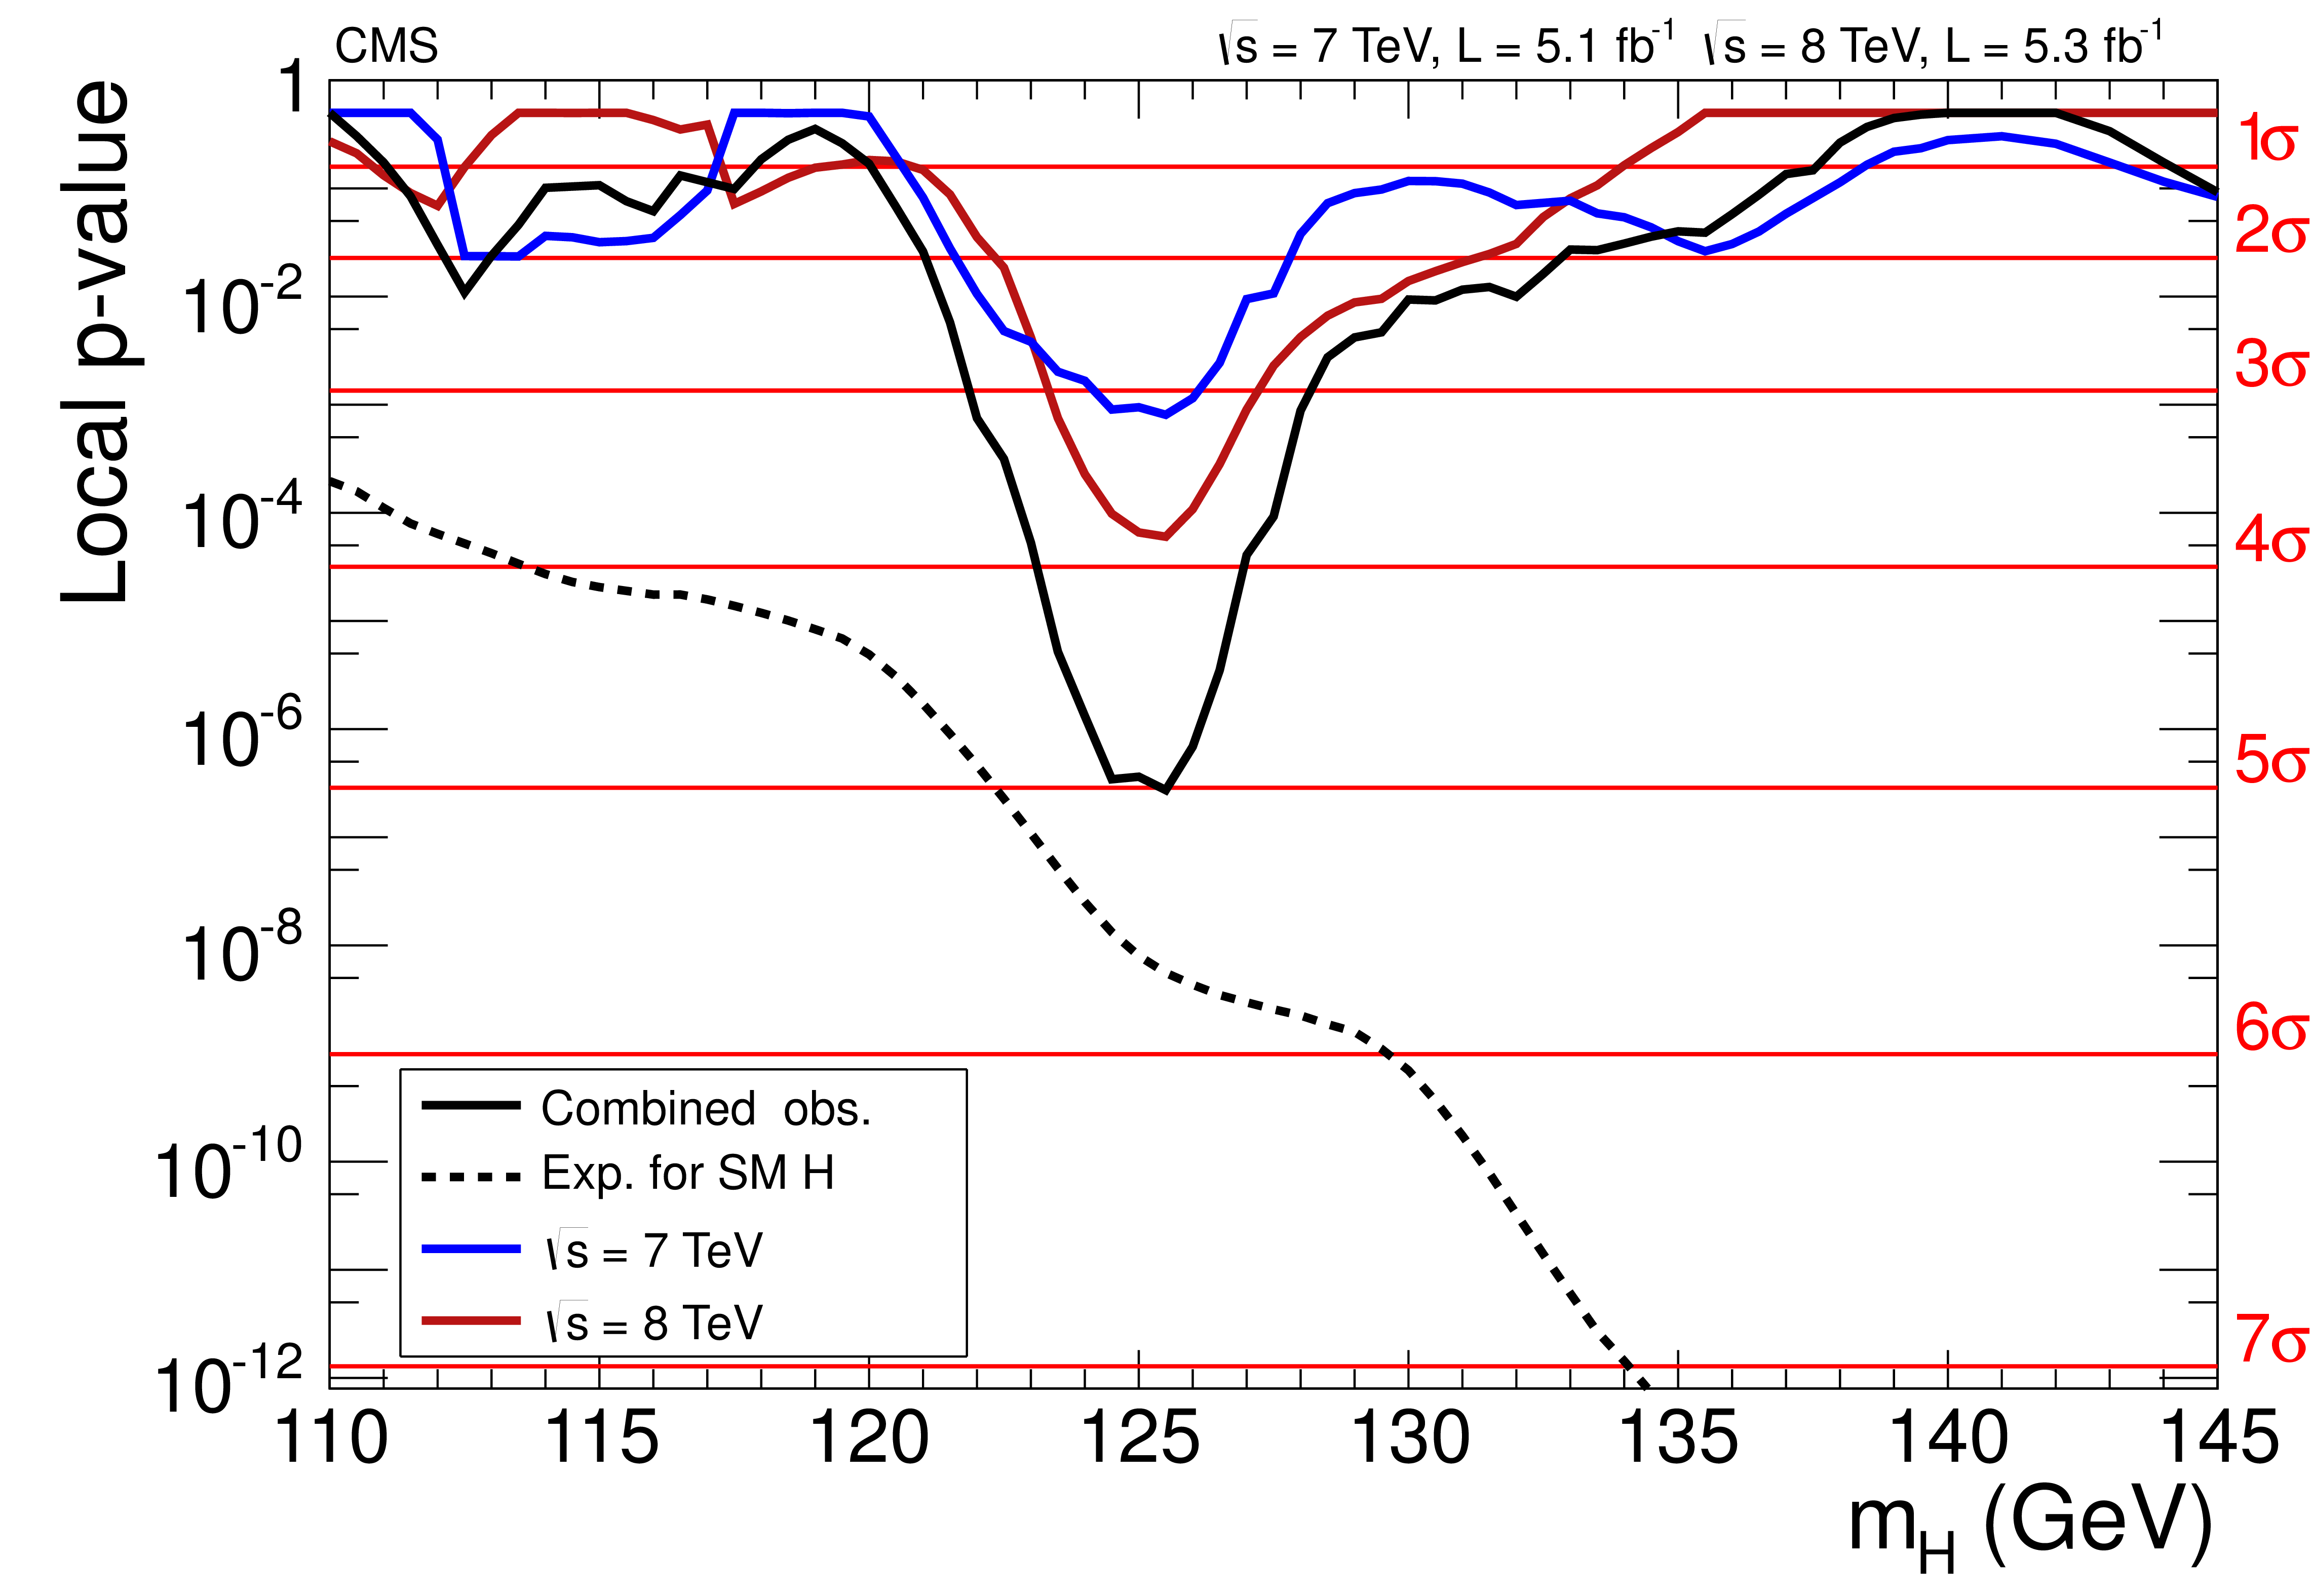
Figure 14:
The observed local $p$-value for 7 TeV and 8 TeV data, and their combination as a function of the SM Higgs boson mass. The dashed line shows the expected local $p$-values for a SM Higgs boson with a mass $ {m_{\mathrm{ H } }}$. |
png pdf |
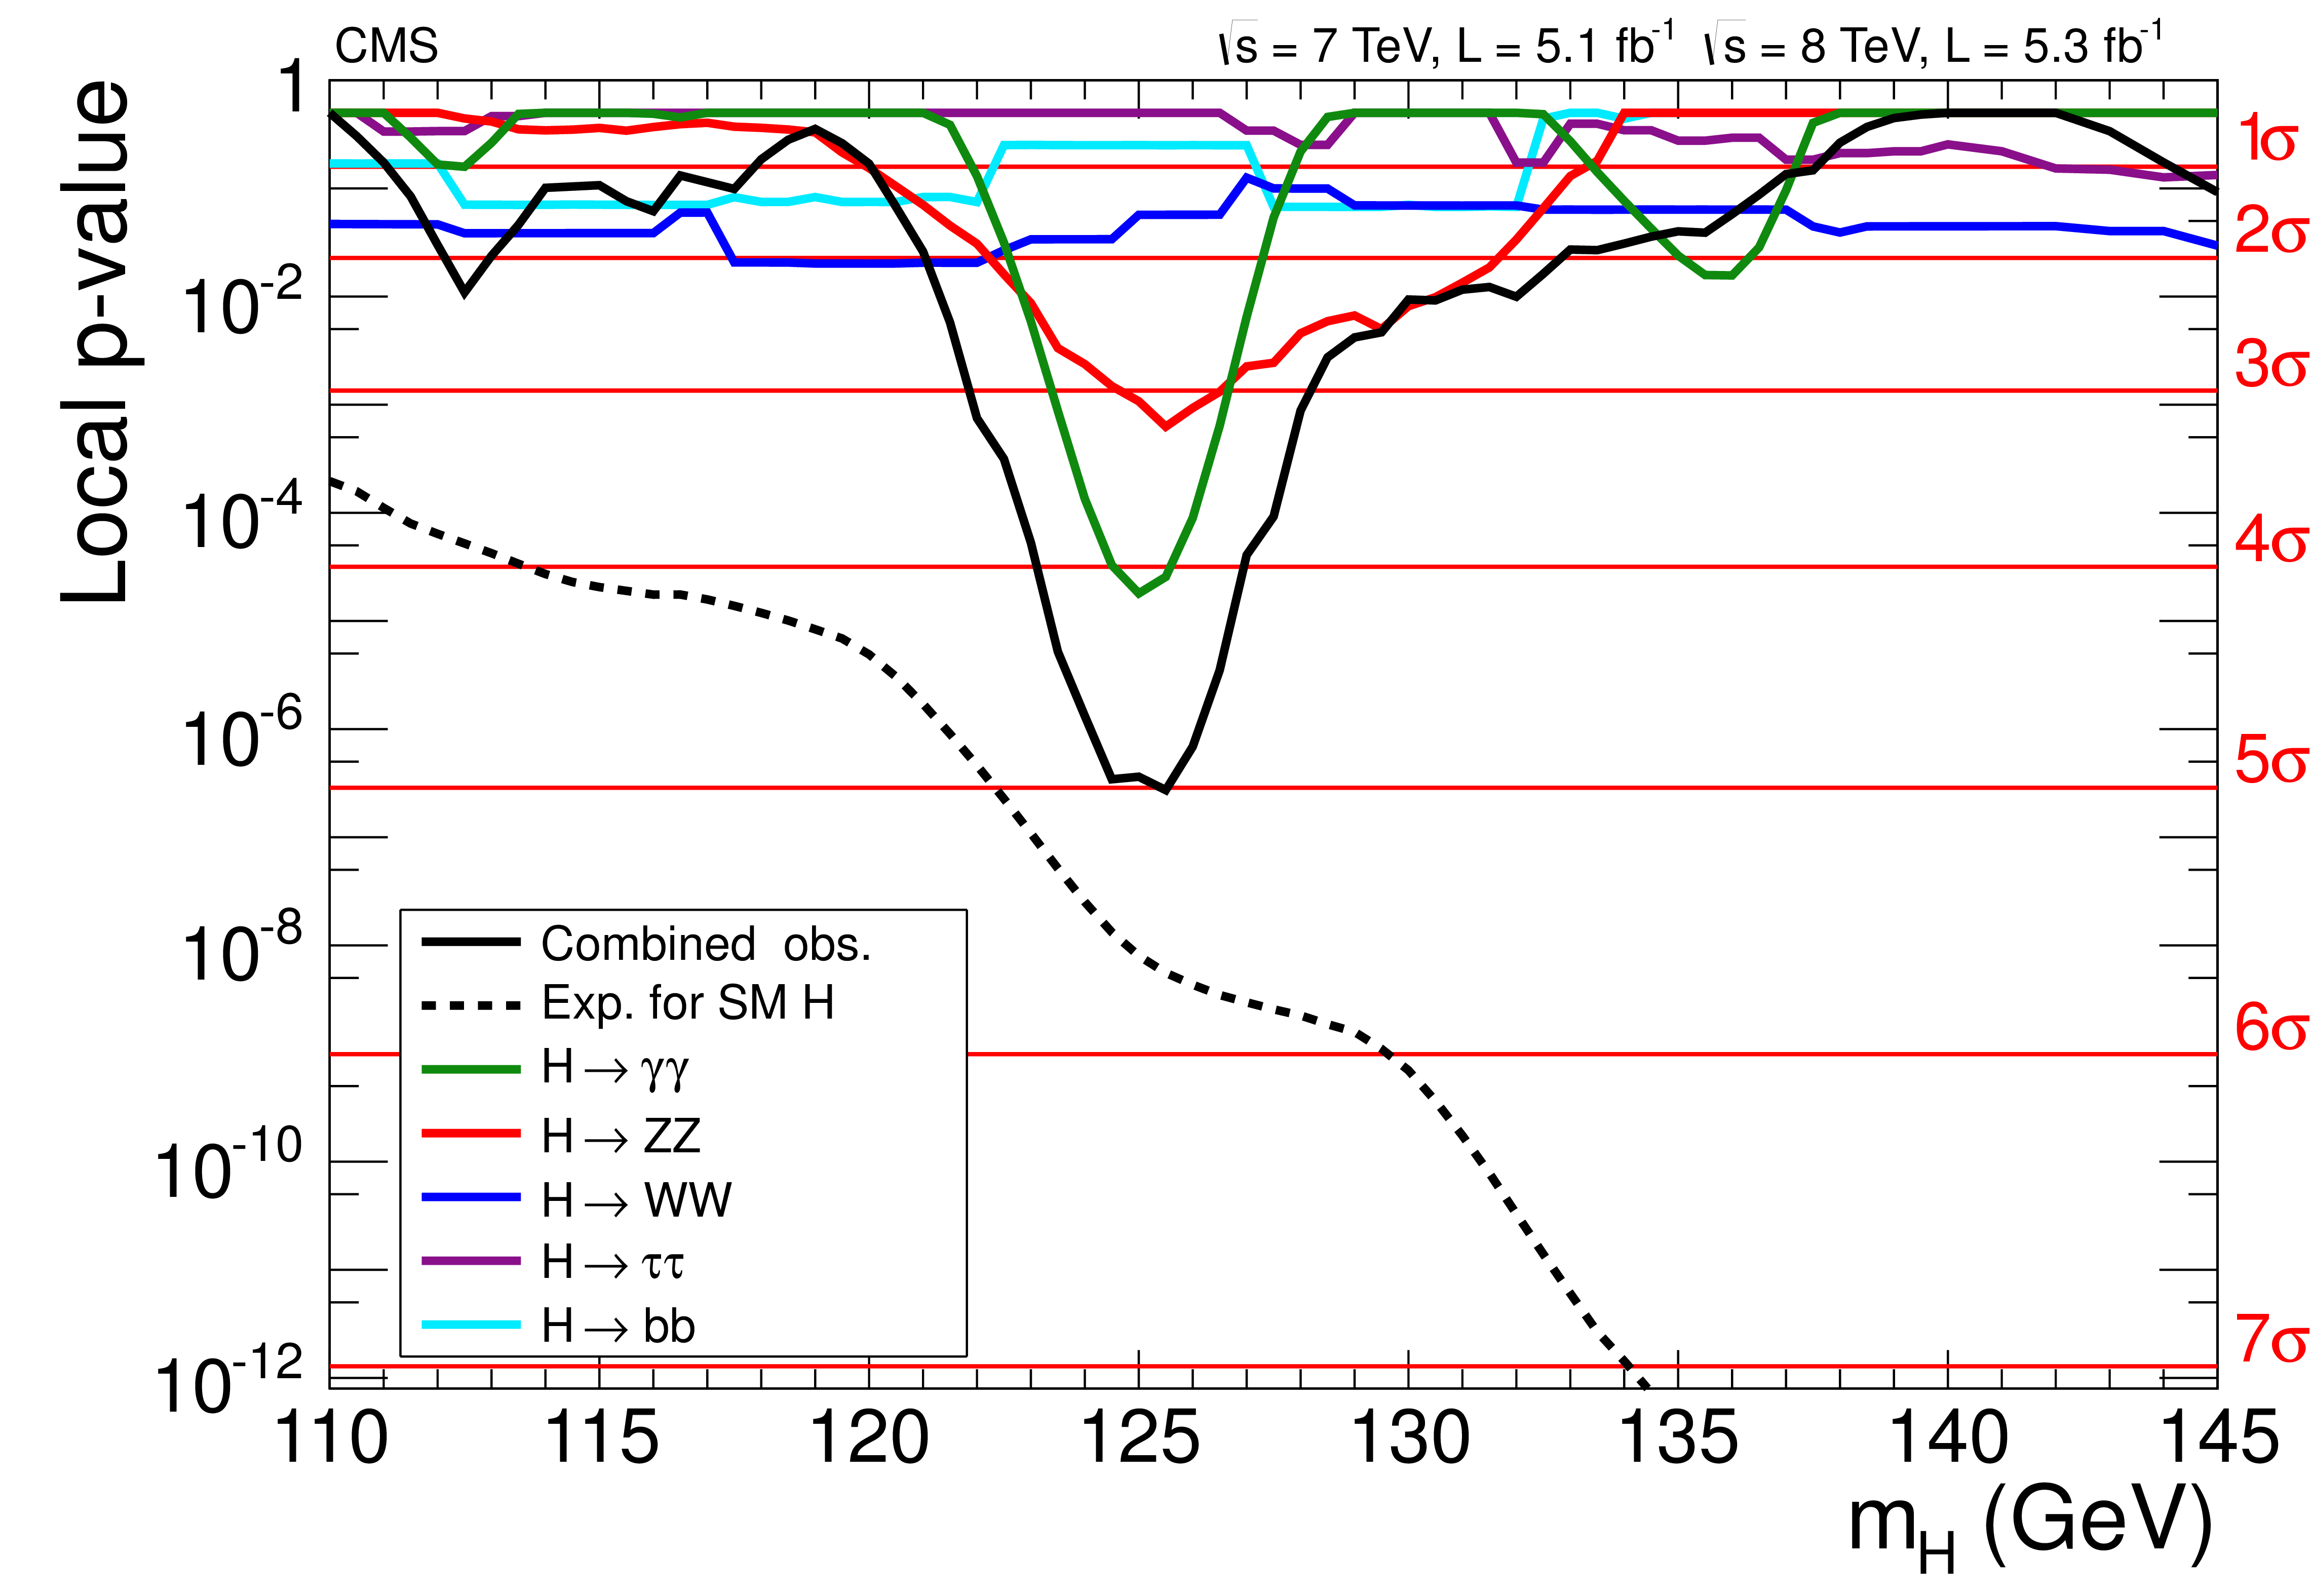
Figure 15:
The observed local $p$-value for the five decay modes and the overall combination as a function of the SM Higgs boson mass. The dashed line shows the expected local $p$-values for a SM Higgs boson with a mass $ {m_{\mathrm{ H } }}$. |
png pdf |
Figure 16:
The observed local $p$-value for decay modes with high mass-resolution channels, $\gamma \gamma $ and $\mathrm{ Z } \mathrm{ Z } $, as a function of the SM Higgs boson mass. The dashed line shows the expected local $p$-values for a SM Higgs boson with a mass $ {m_{\mathrm{ H } }}$. |
png pdf |
Figure 17:
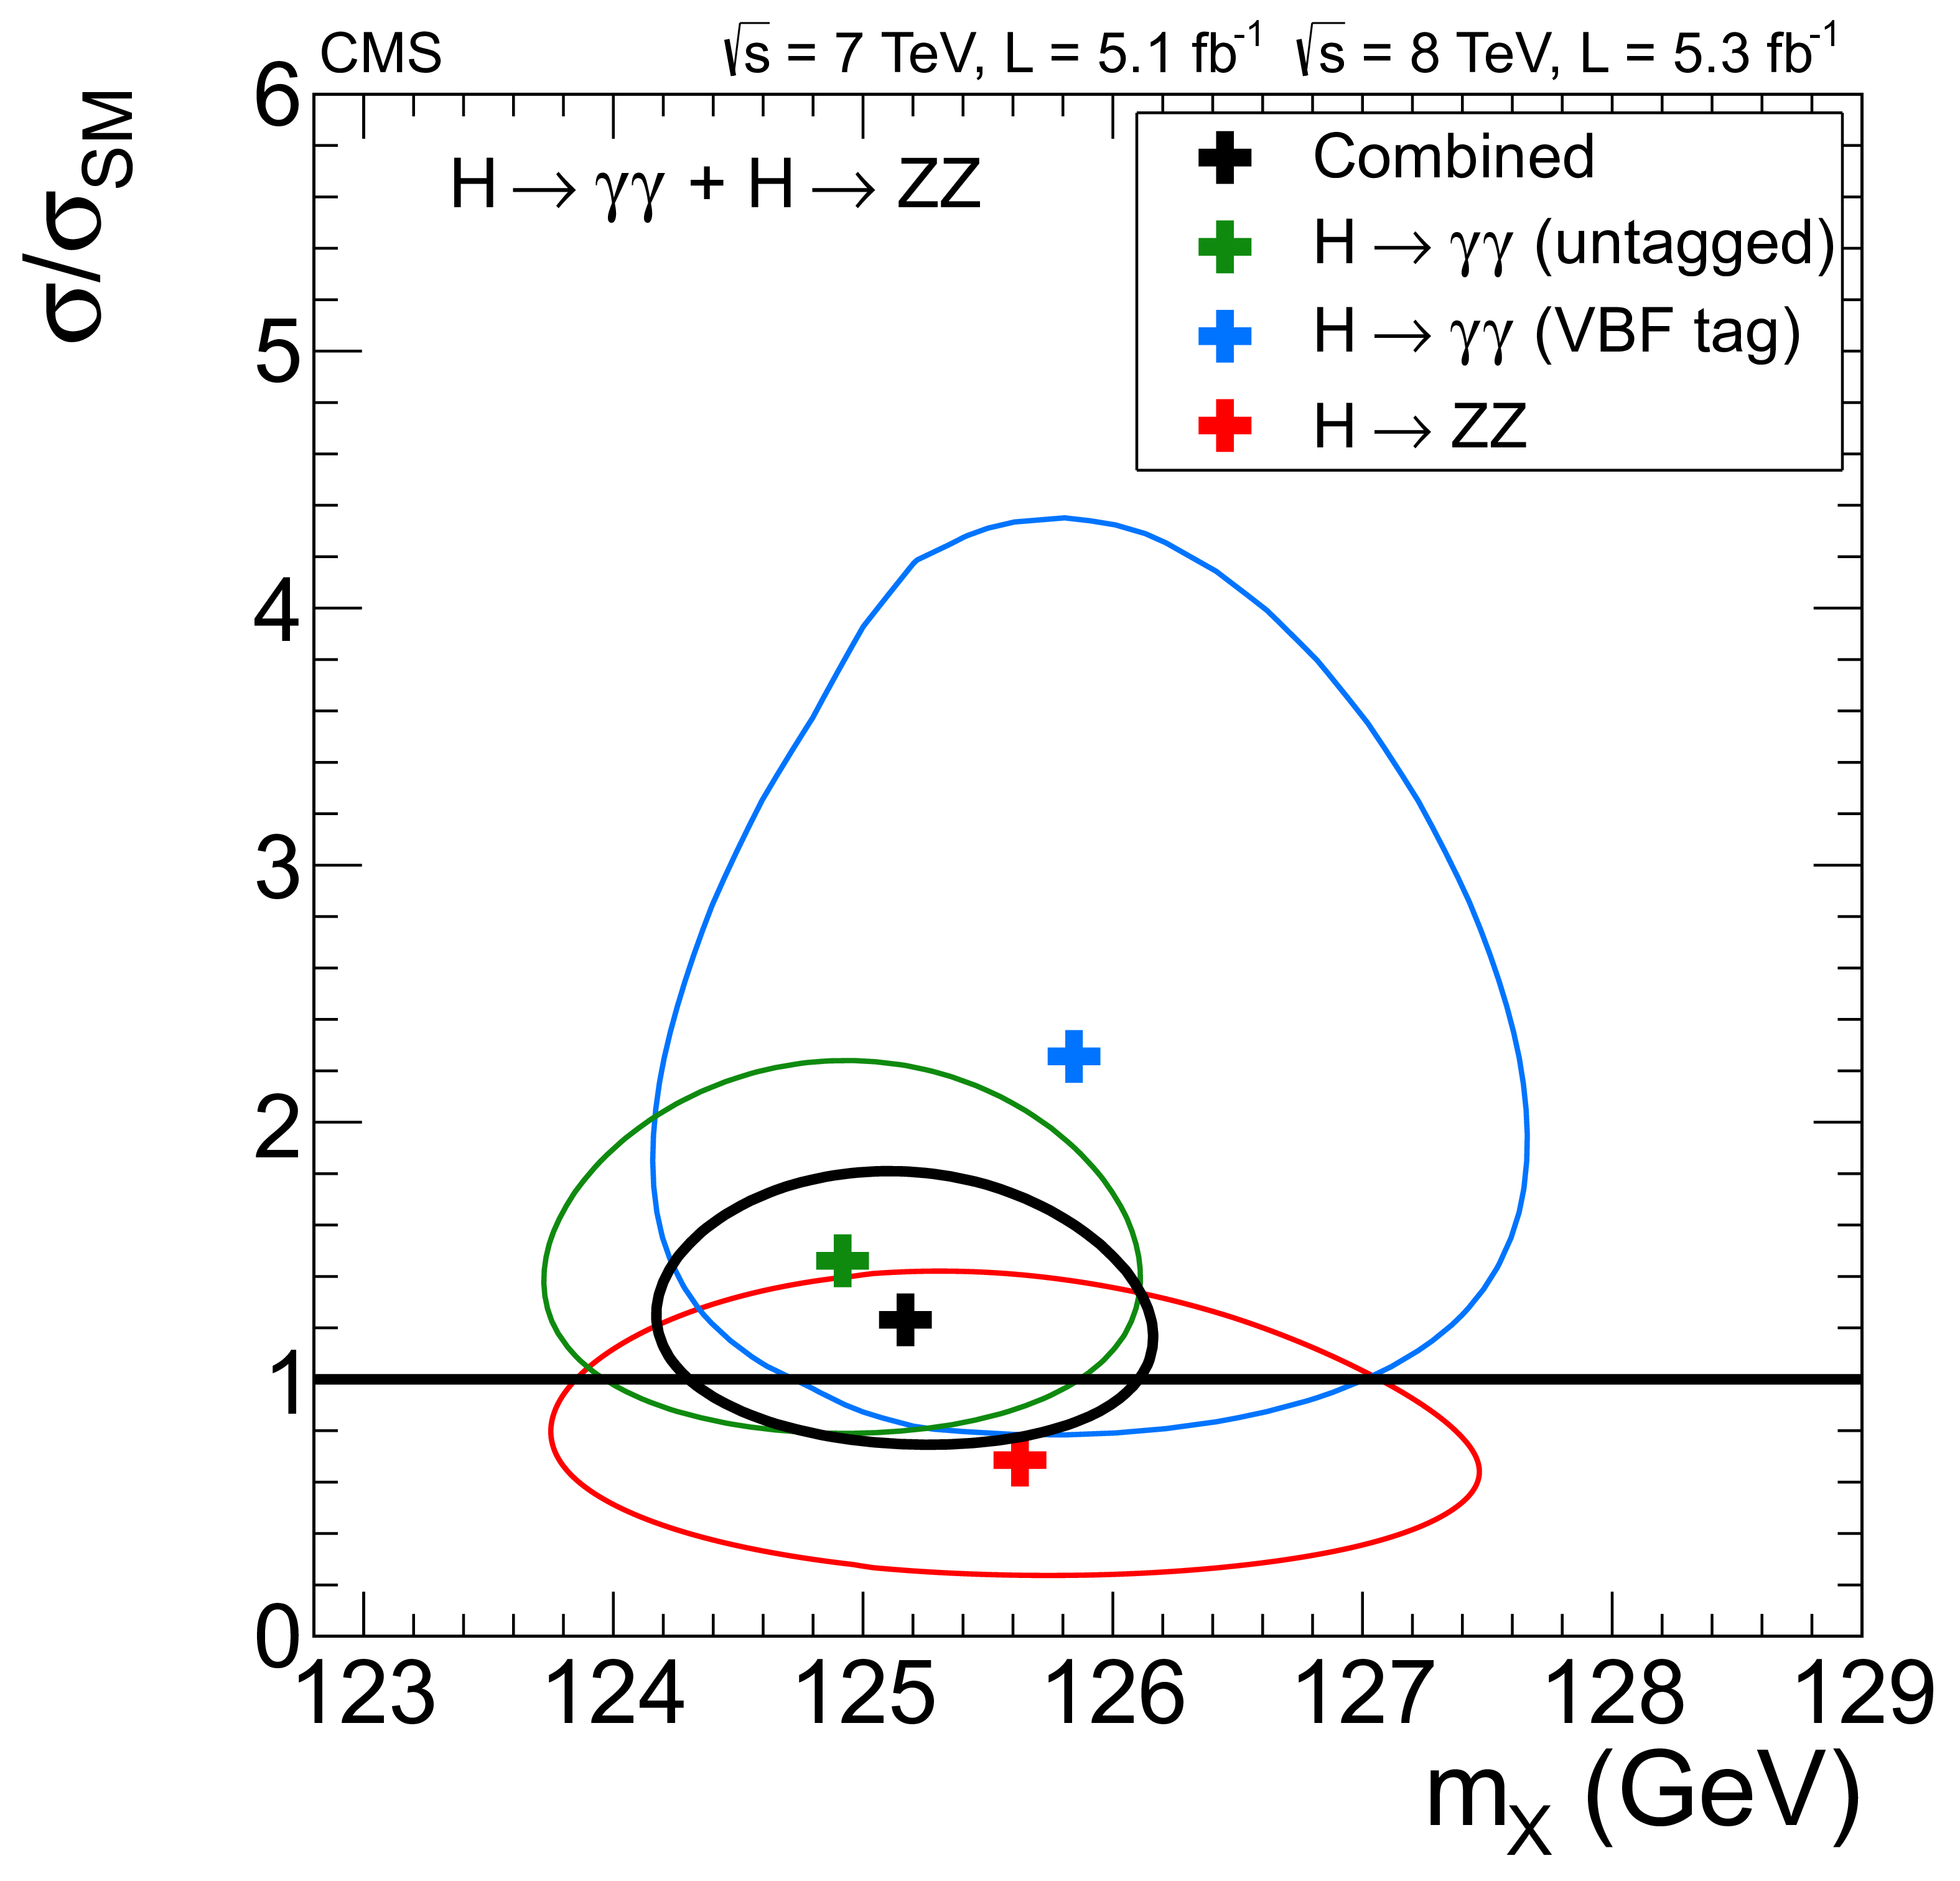
The 68% CL contours for the signal strength $\sigma /\sigma _\text {SM}$ versus the boson mass $m_\mathrm {X}$ for the untagged $\gamma \gamma $, $\gamma \gamma $ with VBF-like dijet, 4$\ell $, and their combination. The symbol $\sigma /\sigma _\mathrm {SM}$ denotes the production cross section times the relevant branching fractions, relative to the SM expectation. In this combination, the relative signal strengths for the three decay modes are constrained by the expectations for the SM Higgs boson. |
png pdf |
Figure 18:
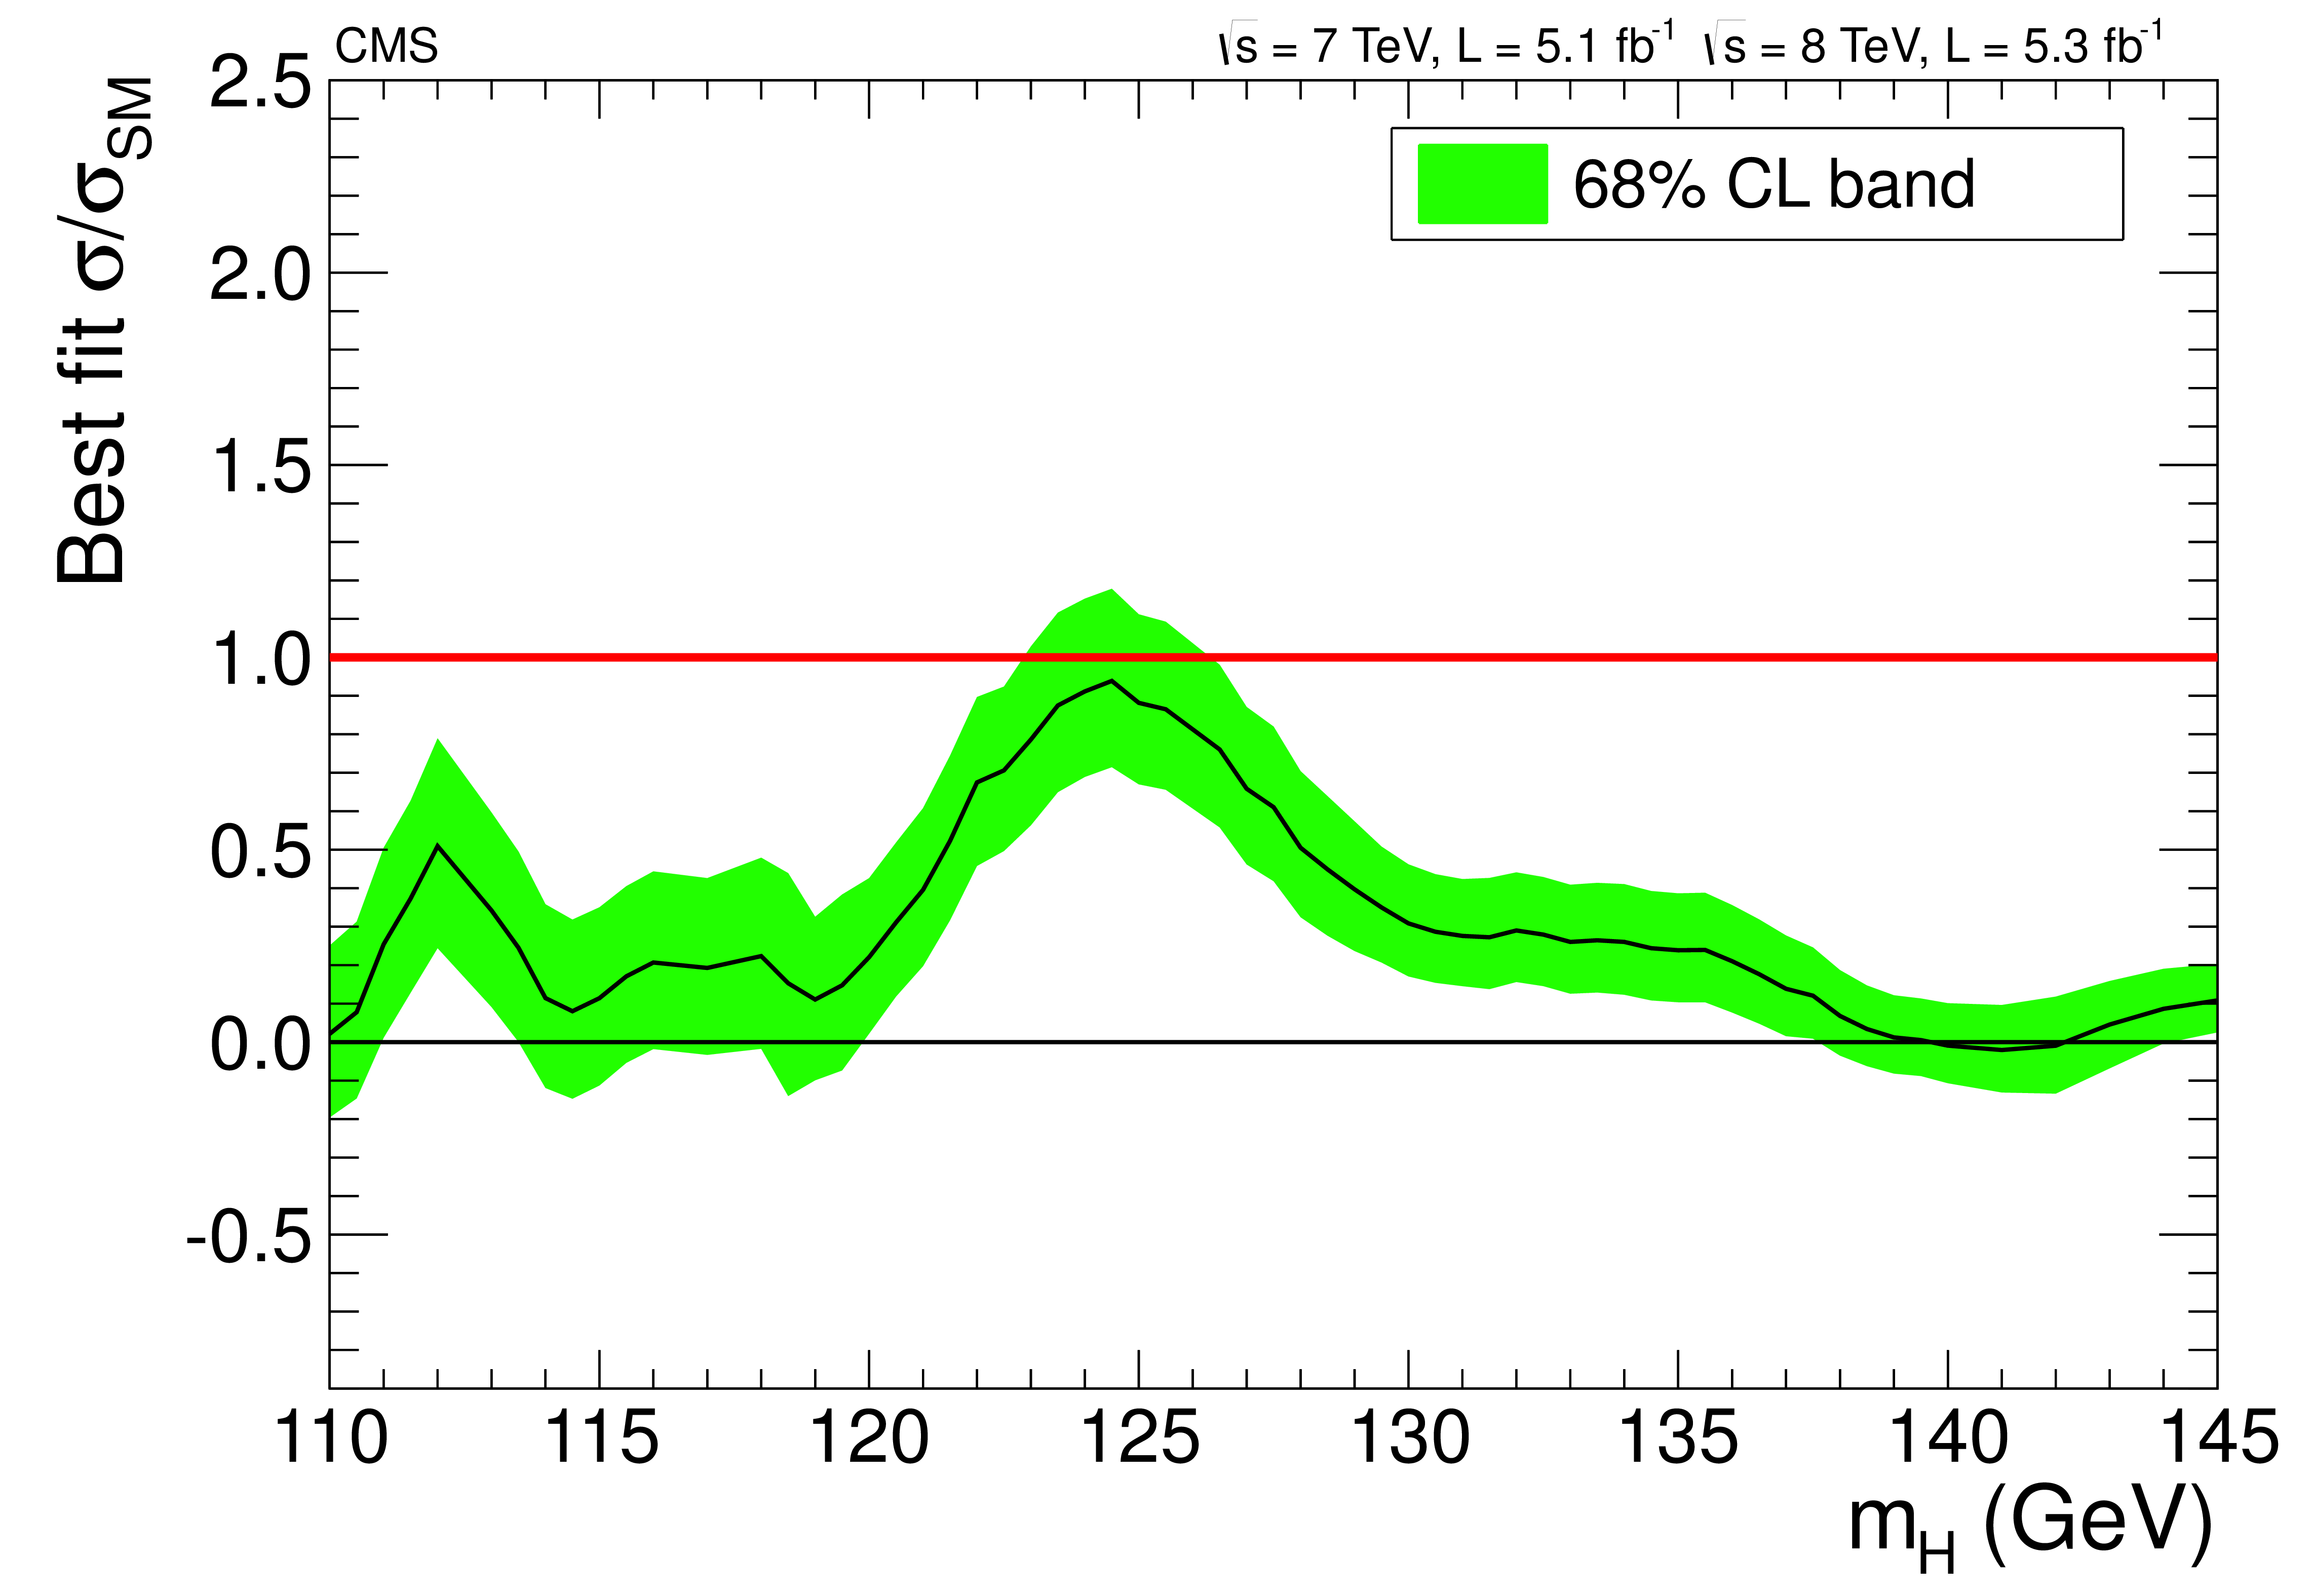
The observed best-fit signal strength $\sigma /\sigma _\mathrm {SM}$ as a function of the SM Higgs boson mass in the range 110-145 GeV for the combined 7and 8 TeV data sets. The symbol $\sigma /\sigma _\mathrm {SM}$ denotes the production cross section times the relevant branching fractions, relative to the SM expectation. The band corresponds to the $\pm 1$ standard deviation uncertainty in $\sigma /\sigma _\mathrm {SM}$. |
png pdf |
Figure 19:
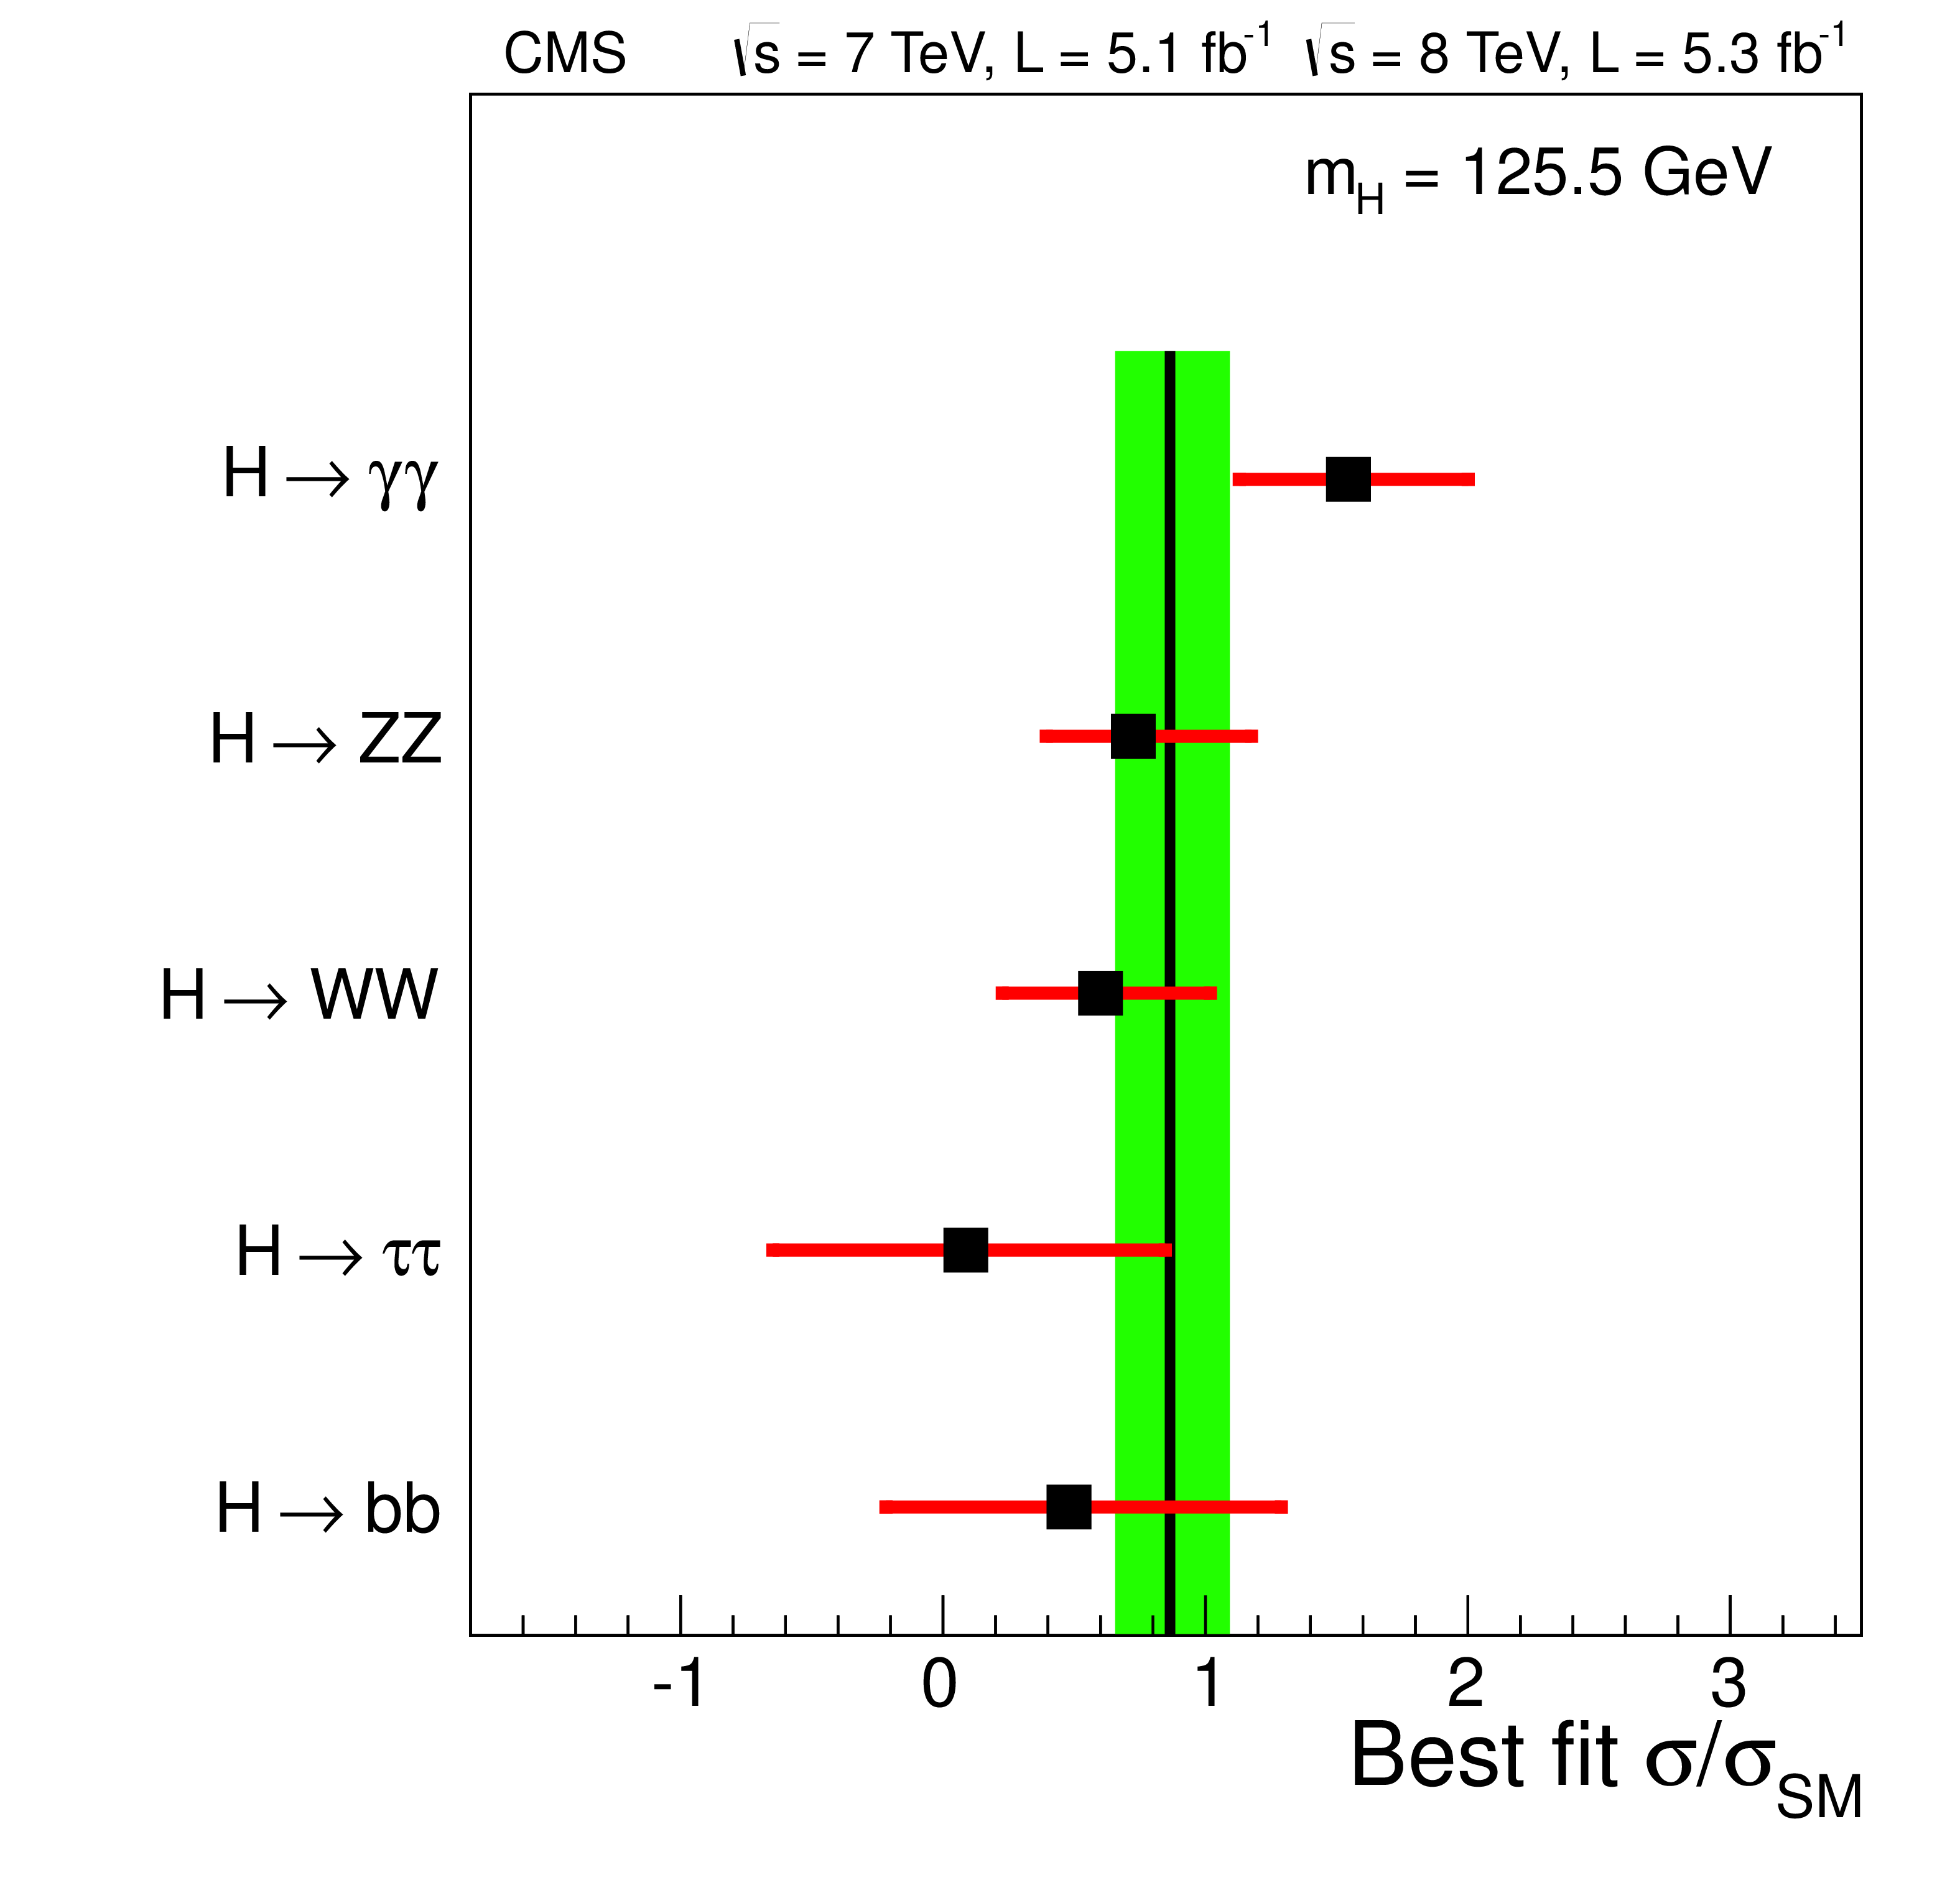
Values of $\sigma /\sigma _\text {SM}$ for the combination (solid vertical line) and for individual decay modes (points). The vertical band shows the overall $\sigma /\sigma _\text {SM}$ value 0.87 $\pm$ 0.23. The symbol $\sigma /\sigma _\mathrm {SM}$ denotes the production cross section times the relevant branching fractions, relative to the SM expectation. The horizontal bars indicate the ${\pm}$1 standard deviation uncertainties in the $\sigma /\sigma _\text {SM}$ values for individual modes; they include both statistical and systematic uncertainties. |
| Tables | |
png pdf |
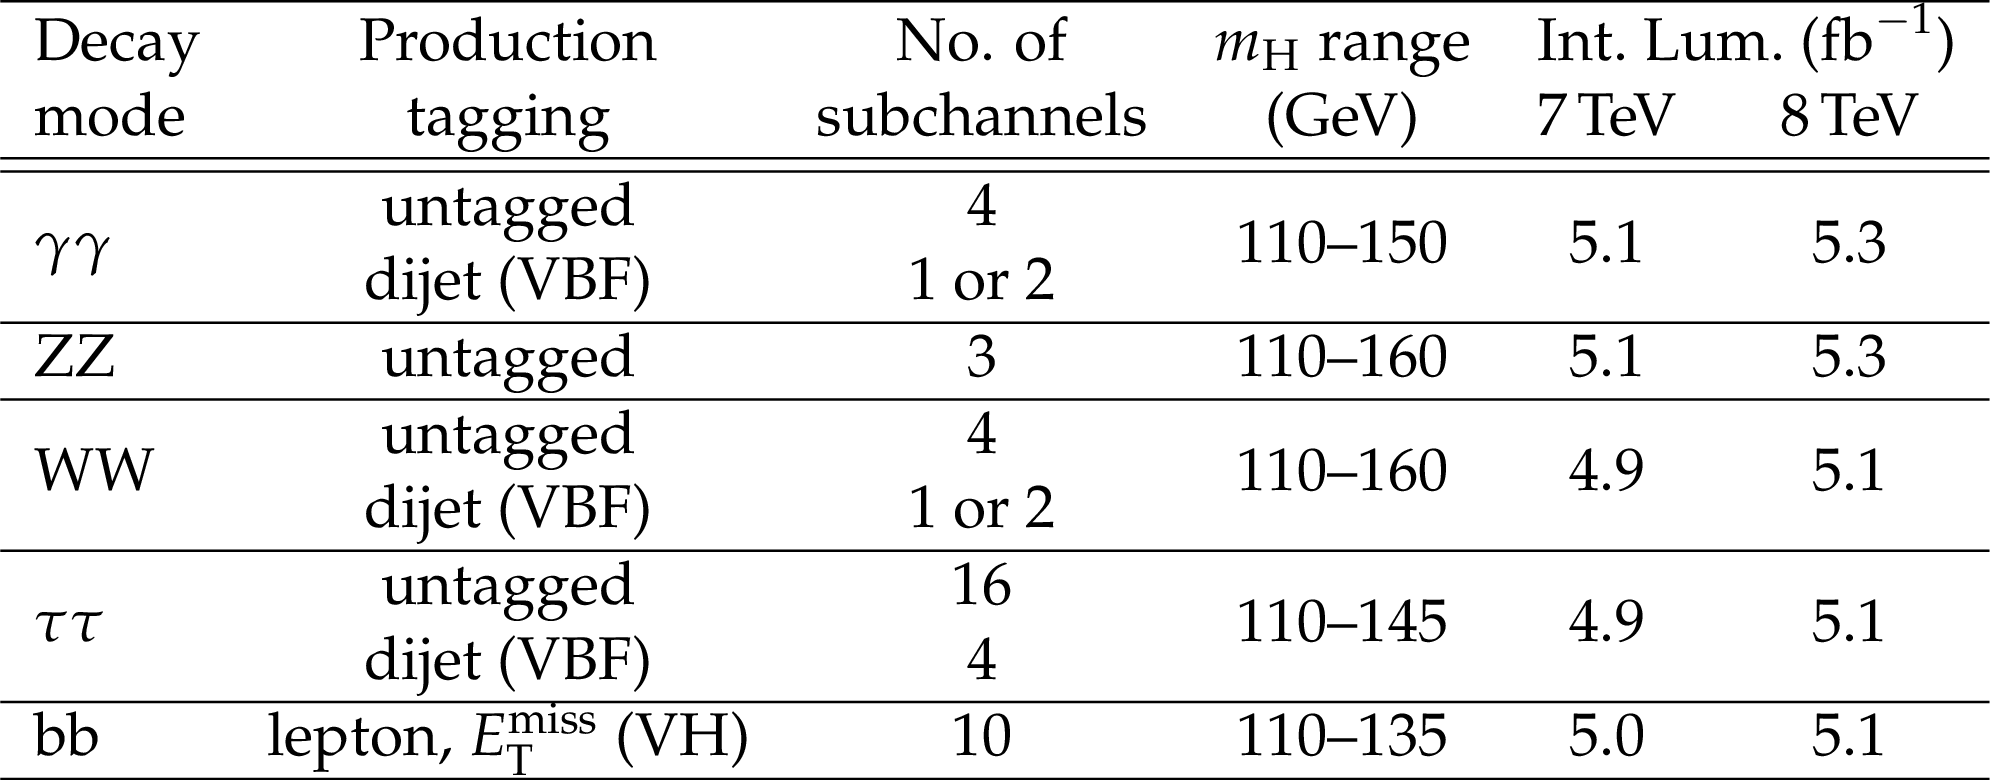
Table 1:
Summary of the subchannels, or categories, used in the analysis of each decay mode. |
png pdf |
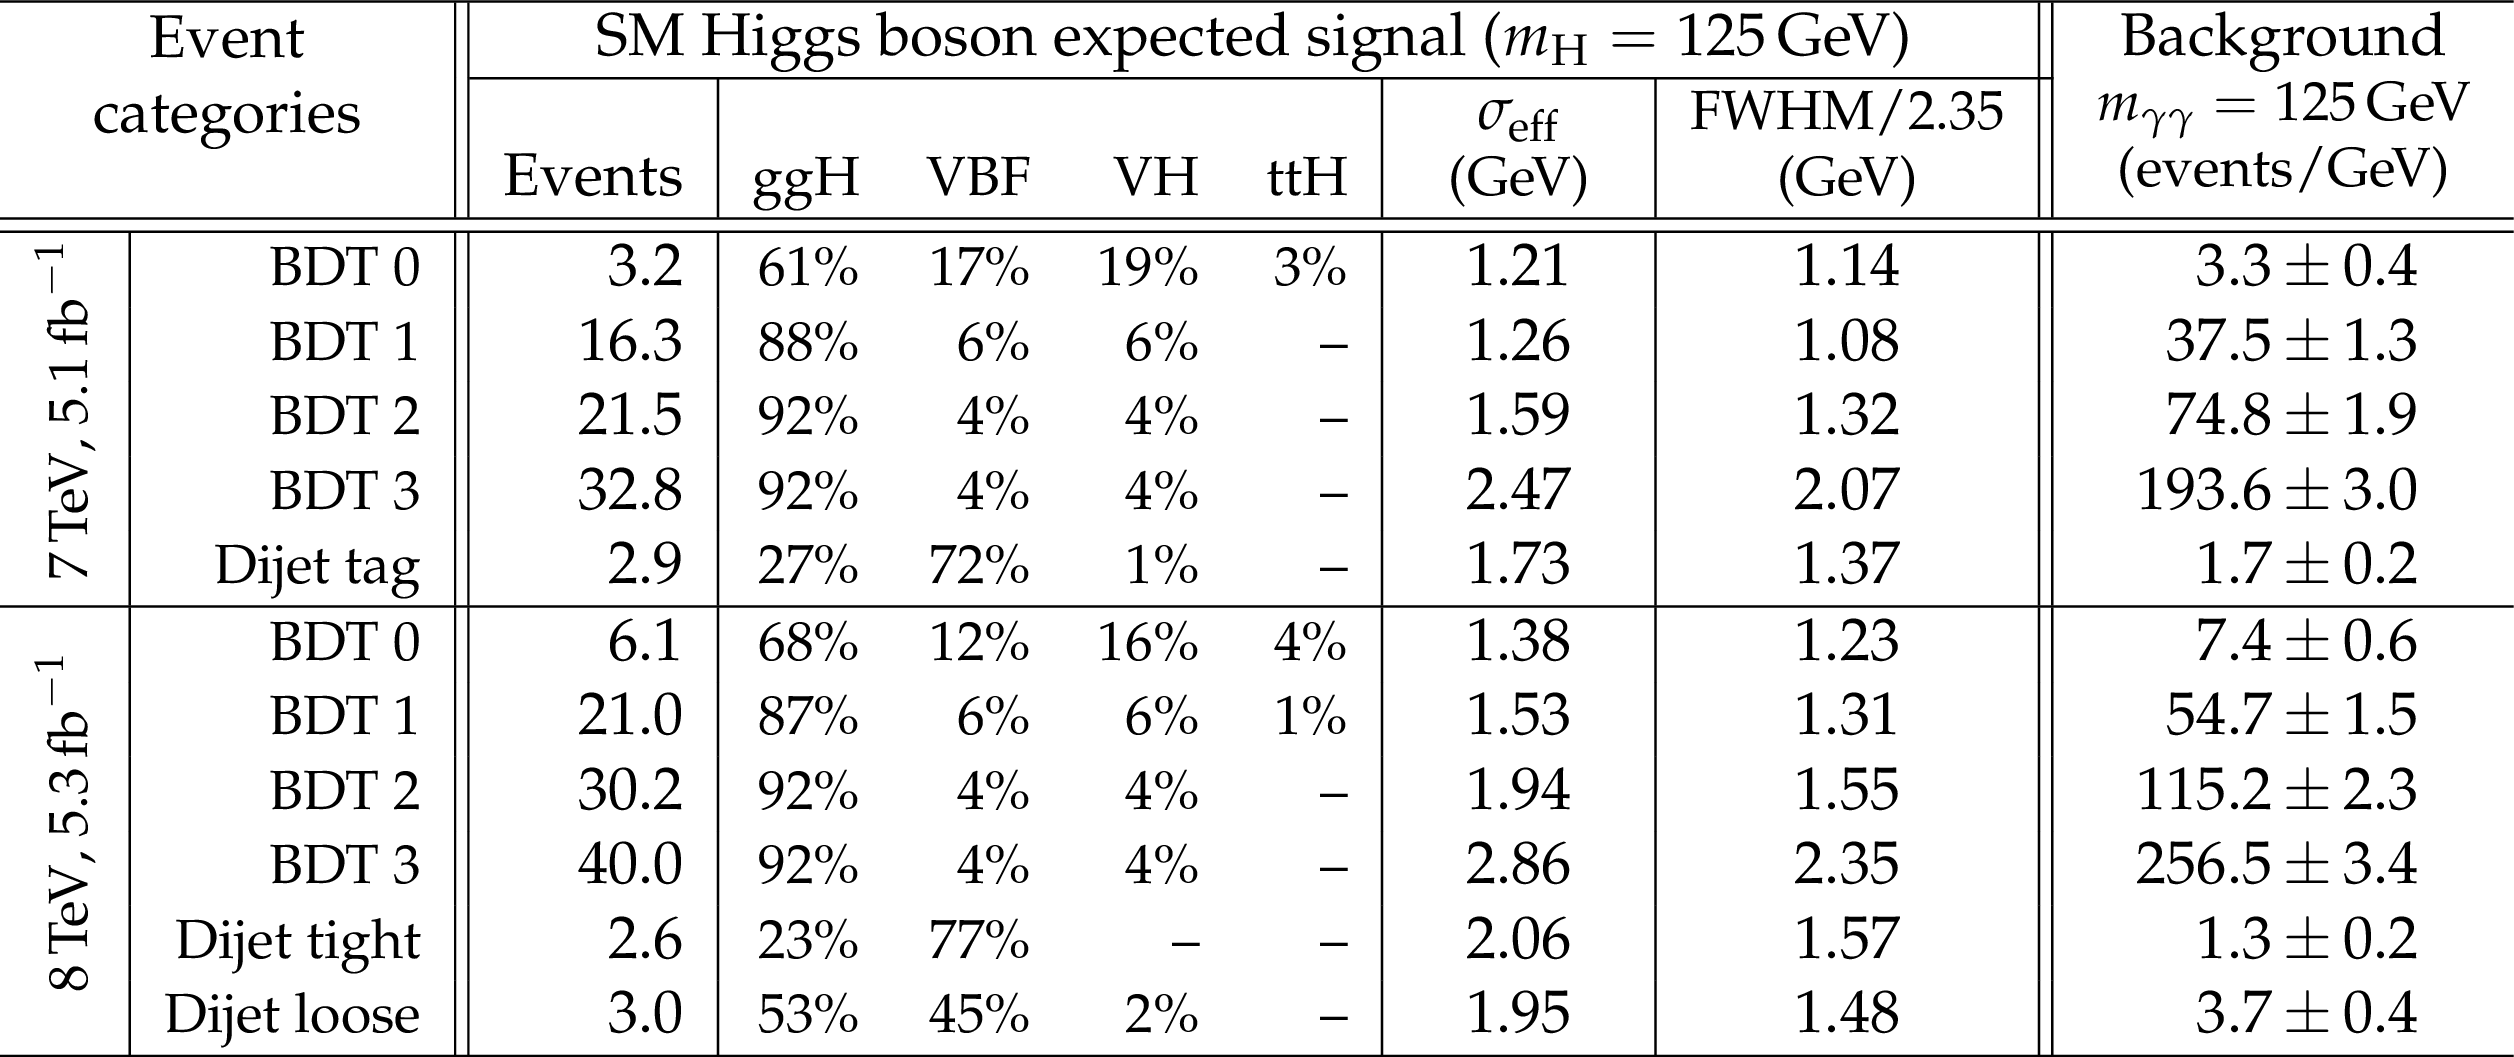
Table 2:
Expected numbers of SM Higgs boson events ($ {m_{\mathrm{ H } }}= $ 125 GeV) and estimated background (at $ {m_{\gamma \gamma }} = $ 125 GeV) for all event categories of the 7 and 8 TeV data sets. There are two dijet-tagged categories for the 8 TeV data as described in the text, and for both data sets the remaining untagged events are separated into four categories labelled here BDT 0-3, BDT 0 having the largest expected signal-to-background ratio. The composition of the SM Higgs boson signal in terms of the production processes, and its mass resolution, are also given. |
png pdf |
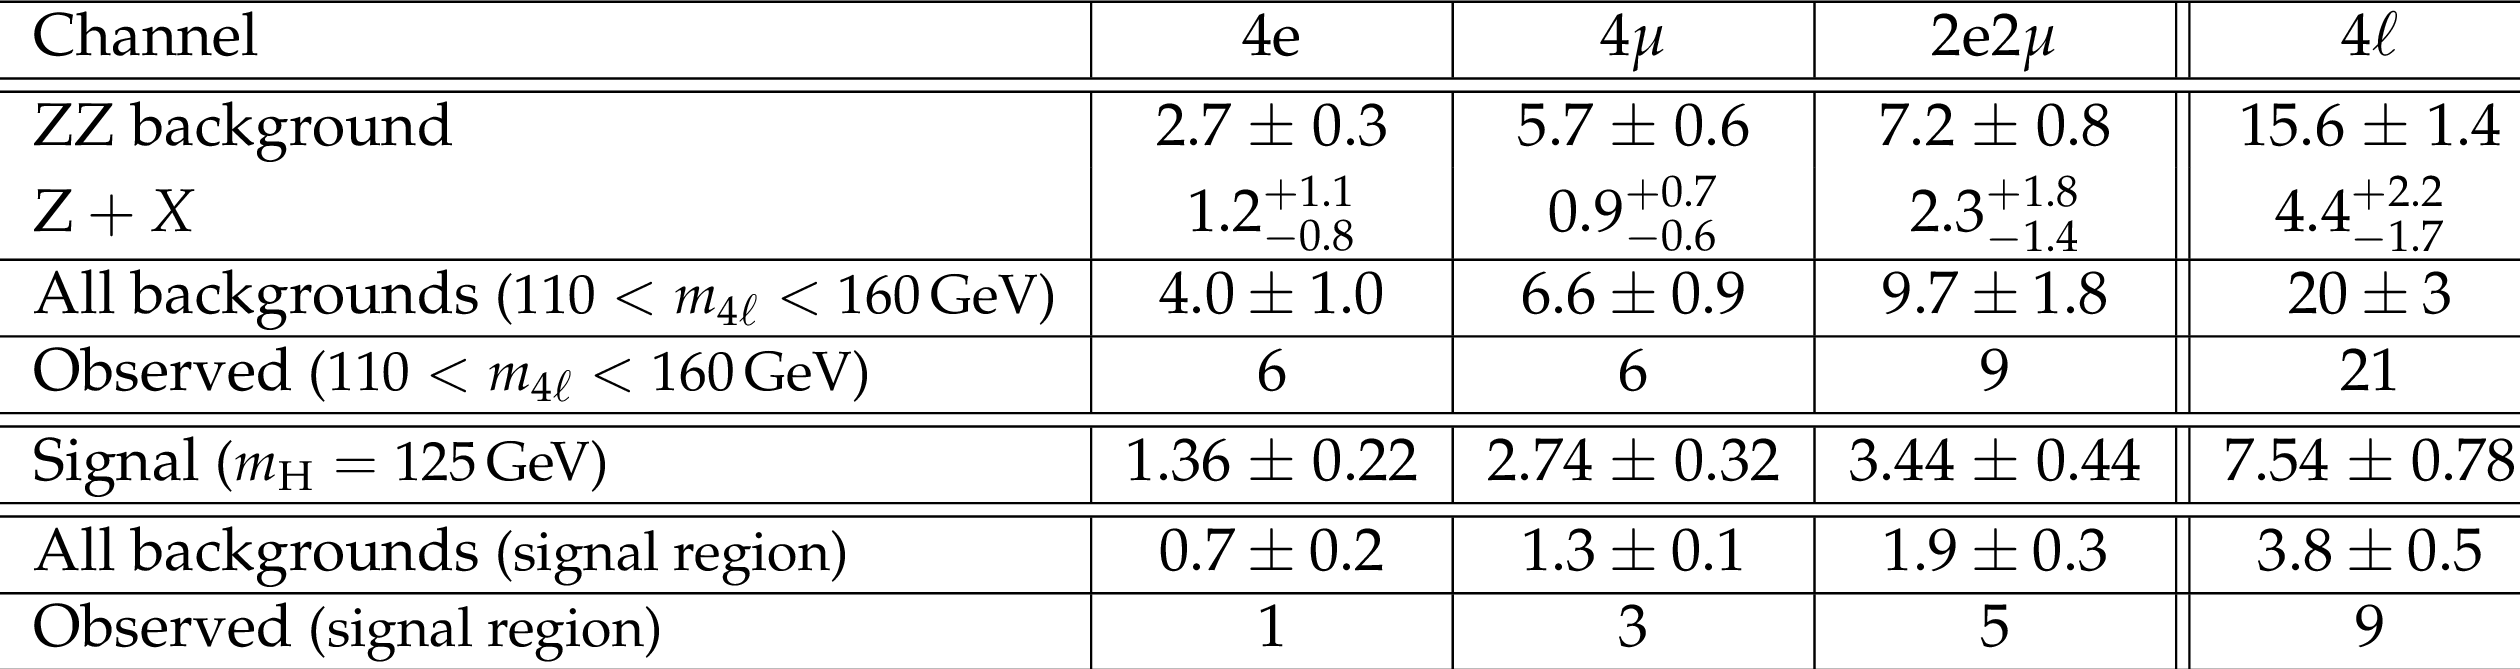
Table 3:
The number of selected events, compared to the expected background yields and expected number of signal events ($ {m_{\mathrm{ H } }}= $ 125 GeV) for each final state in the $\mathrm{ H } \to \mathrm{ Z } \mathrm{ Z } $ analysis. The estimates of the $\mathrm{ Z } +X$ background are based on data. These results are given for the mass range from 110 to 160 GeV. The total background and the observed numbers of events are also shown for the three bins (``signal region'') of Fig. 4 where an excess is seen (121.5 $ < m_{4\ell } < $ 130.5 GeV). |
png pdf |
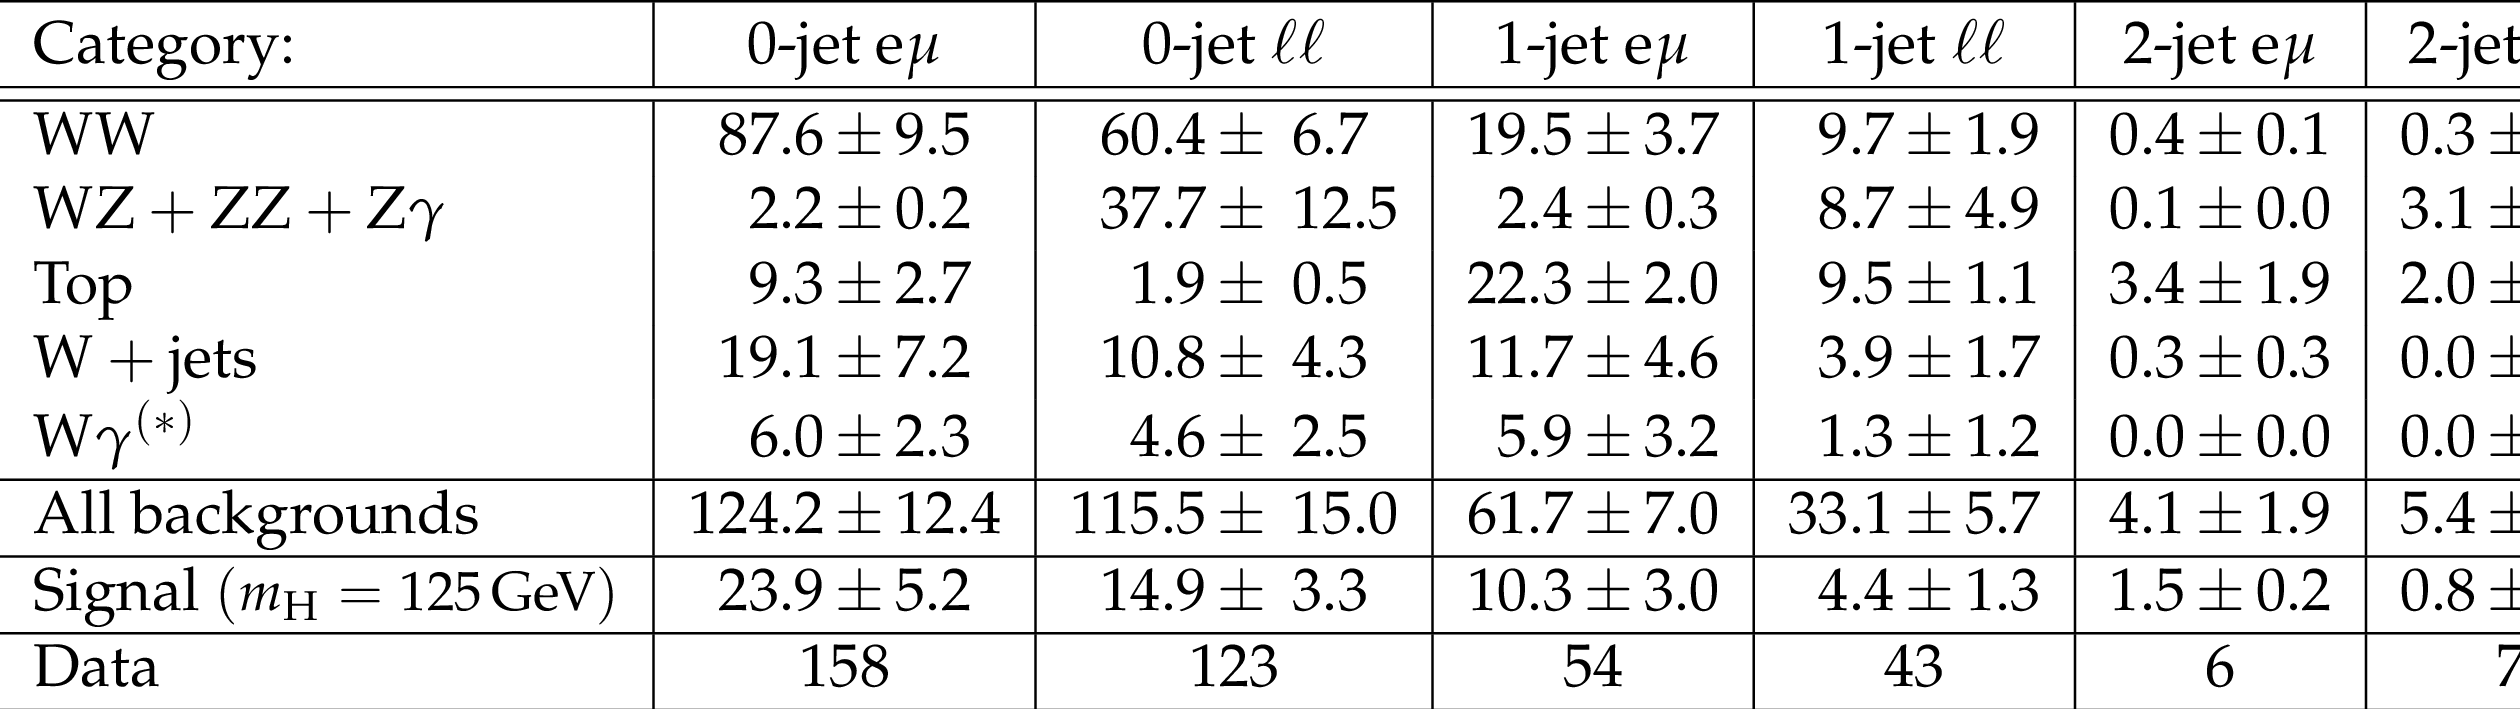
Table 4:
Observed number of events, background estimates, and signal predictions for $ {m_{\mathrm{ H } }}= $ 125 GeV in each category of the $\mathrm{ W } \mathrm{ W } $ analysis of the 8 TeV data set. All the selection requirements have been applied. The combined experimental and theoretical, systematic and statistical uncertainties are shown. The $\mathrm{Z} \gamma $ process includes the dimuon, dielectron, and $ \tau \tau \to \ell \ell $ final states. |

png pdf |
Table 5:
Numbers of expected and observed events in the most sensitive event categories (VBF) in the $\mathrm{ H } \to \tau \tau $ analysis for the 7 and 8 TeV data sets. The expected signal yields for a SM Higgs boson with $ {m_{\mathrm{ H } }}= $ 125 GeV are also shown. Combined statistical and systematic uncertainties in each estimate are reported. |

png pdf |
Table 6:
The expected and observed local $p$-values, expressed as the corresponding number of standard deviations of the observed excess from the background-only hypothesis, for $ {m_{\mathrm{ H } }}= $ 125.5 GeV, for various combinations of decay modes. |
| Summary |
|
Results are presented from searches for the standard model Higgs boson in proton-proton collisions at $\sqrt{s}= $ 7 and 8 TeV in the CMS experiment at the LHC, using data samples corresponding to integrated luminosities of up to 5.1 fb$^{-1}$ at 7 TeV and 5.3 fb$^{-1}$ at 8 TeV. The search is performed in five decay modes: $ \gamma \gamma$, $\mathrm{Z}\mathrm{Z}$, $\mathrm{ W }^+\mathrm{ W }^-$, $ \tau^+ \tau^-$, and $\mathrm{ b \bar{b} }$. An excess of events is observed above the expected background, with a local significance of 5.0$ \sigma$, at a mass near 125 GeV, signalling the production of a new particle. The expected local significance for a standard model Higgs boson of that mass is 5.8$ \sigma$. The global $p$-value in the search range of 115-130 (110-145) GeV corresponds to 4.6$\sigma$ (4.5$\sigma$). The excess is most significant in the two decay modes with the best mass resolution, $ \gamma \gamma$ and $\mathrm{Z}\mathrm{Z}$, and a fit to these signals gives a mass of 125.3 $\pm$ 0.4 (stat.) $\pm$ 0.5 (syst.) GeV. The decay to two photons indicates that the new particle is a boson with spin different from one. The results presented here are consistent, within uncertainties, with expectations for a standard model Higgs boson. The collection of further data will enable a more rigorous test of this conclusion and an investigation of whether the properties of the new particle imply physics beyond the standard model. |
|
|
Compact Muon Solenoid LHC, CERN |
|

|

|

|

|

|